Global Photonic Bandgap Fiber Market, Size, Trends, Business Strategies 2025-2032

The Global Photonic Bandgap Fiber Market size was estimated at USD 153 million in 2023 and is projected to reach USD 243.53 million by 2032, exhibiting a CAGR of 5.30% during the forecast period.

PDF Icon Download Sample Report PDF
  • Quick Dispatch

    All Orders

  • Secure Payment

    100% Secure Payment

Compare

$1,500.00$4,250.00

Clear

Photonic Bandgap Fiber Market Overview

Photonic bandgap fibers are optical fibers where a photonic bandgap effect rather than a fiber core region with increased refractive index is utilized for guiding light. Such a guiding mechanism normally works only in a limited wavelength region. The conceptually simplest kind of realization is a kind of two-dimensional Bragg mirror.

This report provides a deep insight into the global Photonic Bandgap Fiber market covering all its essential aspects. This ranges from a macro overview of the market to micro details of the market size, competitive landscape, development trend, niche market, key market drivers and challenges, SWOT analysis, value chain analysis, etc.

The analysis helps the reader to shape the competition within the industries and strategies for the competitive environment to enhance the potential profit. Furthermore, it provides a simple framework for evaluating and accessing the position of the business organization. The report structure also focuses on the competitive landscape of the Global Photonic Bandgap Fiber Market, this report introduces in detail the market share, market performance, product situation, operation situation, etc. of the main players, which helps the readers in the industry to identify the main competitors and deeply understand the competition pattern of the market.
In a word, this report is a must-read for industry players, investors, researchers, consultants, business strategists, and all those who have any kind of stake or are planning to foray into the Photonic Bandgap Fiber market in any manner.

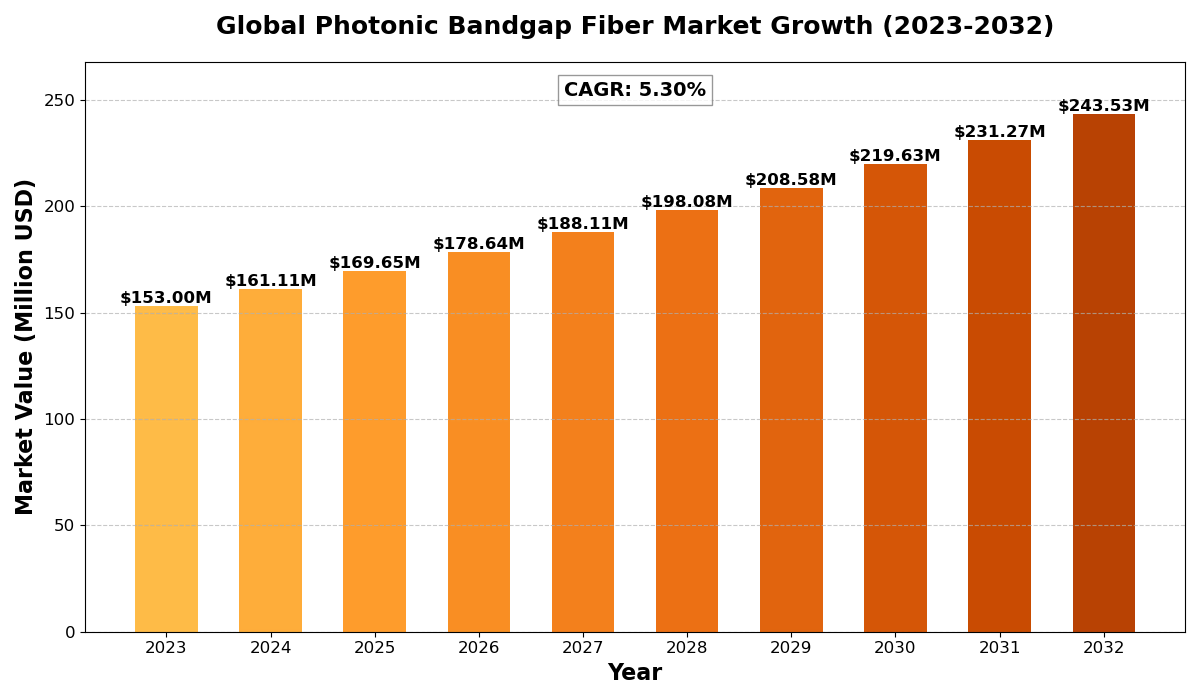
Photonic Bandgap Fiber Market Analysis:

The Global Photonic Bandgap Fiber Market size was estimated at USD 153 million in 2023 and is projected to reach USD 243.53 million by 2032, exhibiting a CAGR of 5.30% during the forecast period.

North America Photonic Bandgap Fiber market size was estimated at USD 43.57 million in 2023, at a CAGR of 4.54% during the forecast period of 2025 through 2032.

Photonic Bandgap Fiber Key Market Trends  :

  1. Increasing Adoption in Sensing Applications
    Photonic bandgap fibers are increasingly being used in high-precision sensing applications, such as environmental monitoring and biomedical sensing.
  2. Advancements in Hollow-Core Fiber Technology
    Innovations in hollow-core photonic bandgap fibers are improving light transmission efficiency and reducing optical losses, expanding their use in telecommunications.
  3. Growing Demand in Medical Imaging
    The use of photonic bandgap fibers in advanced medical imaging techniques is increasing due to their high sensitivity and precision.
  4. Expanding Use in Ultrafast Lasers
    The rise of ultrafast pulse applications in industries like manufacturing and defense is driving demand for photonic bandgap fibers.
  5. Increasing Investments in R&D
    Market players are heavily investing in research and development to enhance fiber performance, durability, and cost-effectiveness.

Photonic Bandgap Fiber Market Regional Analysis :

semi insight

  • North America:

    Strong demand driven by EVs, 5G infrastructure, and renewable energy, with the U.S. leading the market.

  • Europe:

    Growth fueled by automotive electrification, renewable energy, and strong regulatory support, with Germany as a key player.

  • Asia-Pacific:

    Dominates the market due to large-scale manufacturing in China and Japan, with growing demand from EVs, 5G, and semiconductors.

  • South America:

    Emerging market, driven by renewable energy and EV adoption, with Brazil leading growth.

  • Middle East & Africa:

    Gradual growth, mainly due to investments in renewable energy and EV infrastructure, with Saudi Arabia and UAE as key contributors.

Photonic Bandgap Fiber Market Segmentation :

The research report includes specific segments by region (country), manufacturers, Type, and Application. Market segmentation creates subsets of a market based on product type, end-user or application, Geographic, and other factors. By understanding the market segments, the decision-maker can leverage this targeting in the product, sales, and marketing strategies. Market segments can power your product development cycles by informing how you create product offerings for different segments.
Key Company

  • NKT Photonics
  • iXblue
  • Thorlabs

Market Segmentation (by Type)

  • Hollow Core
  • Solid Core

Market Segmentation (by Application)

  • Sensing
  • Imaging
  • Ultrashort Pulse Applications
  • Others

Market Drivers

  • Rising Demand for High-Speed Data Transmission
    The increasing need for faster and more reliable data transmission is boosting the adoption of photonic bandgap fibers in telecommunications.
  • Growth in Biomedical and Industrial Applications
    Expanding use in medical imaging, fiber-optic sensing, and industrial lasers is fueling market growth.
  • Advancements in Optical Fiber Technologies
    Continuous research and technological improvements are enhancing the performance and efficiency of photonic bandgap fibers.

Market Restraints

  • High Manufacturing Costs
    The complex production process of photonic bandgap fibers leads to higher costs, limiting their adoption.
  • Limited Wavelength Range
    The guiding mechanism works only within specific wavelength regions, restricting broader applications.
  • Lack of Standardization
    The absence of uniform standards in photonic bandgap fiber production creates challenges in mass adoption.

Market Opportunities

  • Expansion in 5G and High-Speed Networks
    The rollout of 5G networks presents new growth opportunities for photonic bandgap fiber applications.
  • Growing Demand for Precision Optics in Healthcare
    Increasing use in biomedical applications is opening new avenues for market expansion.
  • Integration with AI and IoT Technologies
    The combination of photonic fibers with AI and IoT-based solutions is expected to drive innovation in various industries.

Market Challenges

  • Complex Fabrication Process
    The intricate design and manufacturing process pose challenges for scalability and mass production.
  • Competition from Conventional Optical Fibers
    Traditional optical fibers with cost-effective solutions compete with photonic bandgap fibers, slowing market adoption.
  • Limited Awareness and Adoption
    Many industries are still unaware of the full potential of photonic bandgap fibers, affecting market penetration.

Key Benefits of This Market Research:

  • Industry drivers, restraints, and opportunities covered in the study
  • Neutral perspective on the market performance
  • Recent industry trends and developments
  • Competitive landscape & strategies of key players
  • Potential & niche segments and regions exhibiting promising growth covered
  • Historical, current, and projected market size, in terms of value
  • In-depth analysis of the Photonic Bandgap Fiber Market
  • Overview of the regional outlook of the Photonic Bandgap Fiber Market:

Key Reasons to Buy this Report:

  • Access to date statistics compiled by our researchers. These provide you with historical and forecast data, which is analyzed to tell you why your market is set to change
  • This enables you to anticipate market changes to remain ahead of your competitors
  • You will be able to copy data from the Excel spreadsheet straight into your marketing plans, business presentations, or other strategic documents
  • The concise analysis, clear graph, and table format will enable you to pinpoint the information you require quickly
  • Provision of market value data for each segment and sub-segment
  • Indicates the region and segment that is expected to witness the fastest growth as well as to dominate the market
  • Provides insight into the market through Value Chain
  • Market dynamics scenario, along with growth opportunities of the market in the years to come
  • 6-month post-sales analyst support

Customization of the Report
In case of any queries or customization requirements, please connect with our sales team, who will ensure that your requirements are met.


FAQs


Q: What are the key driving factors and opportunities in the Photonic Bandgap Fiber market?
A: The market is driven by increasing demand for high-speed data transmission, growth in biomedical and industrial applications, and advancements in fiber technology. Opportunities include 5G expansion, precision optics in healthcare, and integration with AI and IoT.


Q: Which region is projected to have the largest market share?
A: North America is expected to dominate the market, with a projected CAGR of 4.54% from 2025 to 2032, driven by high investments in telecommunications and medical imaging.


Q: Who are the top players in the global Photonic Bandgap Fiber market?
A: Leading companies in the market include NKT Photonics, iXblue, and Thorlabs, which are investing in advanced fiber technologies and expanding their market presence.


Q: What are the latest technological advancements in the industry?
A: Innovations include improvements in hollow-core fiber technology, better light transmission efficiency, and enhanced performance for ultrafast laser applications.


Q: What is the current size of the global Photonic Bandgap Fiber market?
A: The global market was valued at USD 153 million in 2023 and is projected to reach USD 243.53 million by 2032, growing at a CAGR of 5.30% during the forecast period.

Global Photonic Bandgap Fiber Market, Size, Trends, Business Strategies 2025-2032

Get Sample Report PDF for Exclusive Insights

Report Sample Includes

  • Table of Contents
  • List of Tables & Figures
  • Charts, Research Methodology, and more...
PDF Icon Download Sample Report PDF

Download Sample Report

Table of Content

Table of Contents
1 Research Methodology and Statistical Scope
1.1 Market Definition and Statistical Scope of Photonic Bandgap Fiber
1.2 Key Market Segments
1.2.1 Photonic Bandgap Fiber Segment by Type
1.2.2 Photonic Bandgap Fiber Segment by Application
1.3 Methodology & Sources of Information
1.3.1 Research Methodology
1.3.2 Research Process
1.3.3 Market Breakdown and Data Triangulation
1.3.4 Base Year
1.3.5 Report Assumptions & Caveats
2 Photonic Bandgap Fiber Market Overview
2.1 Global Market Overview
2.1.1 Global Photonic Bandgap Fiber Market Size (M USD) Estimates and Forecasts (2019-2032)
2.1.2 Global Photonic Bandgap Fiber Sales Estimates and Forecasts (2019-2032)
2.2 Market Segment Executive Summary
2.3 Global Market Size by Region
3 Photonic Bandgap Fiber Market Competitive Landscape
3.1 Global Photonic Bandgap Fiber Sales by Manufacturers (2019-2025)
3.2 Global Photonic Bandgap Fiber Revenue Market Share by Manufacturers (2019-2025)
3.3 Photonic Bandgap Fiber Market Share by Company Type (Tier 1, Tier 2, and Tier 3)
3.4 Global Photonic Bandgap Fiber Average Price by Manufacturers (2019-2025)
3.5 Manufacturers Photonic Bandgap Fiber Sales Sites, Area Served, Product Type
3.6 Photonic Bandgap Fiber Market Competitive Situation and Trends
3.6.1 Photonic Bandgap Fiber Market Concentration Rate
3.6.2 Global 5 and 10 Largest Photonic Bandgap Fiber Players Market Share by Revenue
3.6.3 Mergers & Acquisitions, Expansion
4 Photonic Bandgap Fiber Industry Chain Analysis
4.1 Photonic Bandgap Fiber Industry Chain Analysis
4.2 Market Overview of Key Raw Materials
4.3 Midstream Market Analysis
4.4 Downstream Customer Analysis
5 The Development and Dynamics of Photonic Bandgap Fiber Market
5.1 Key Development Trends
5.2 Driving Factors
5.3 Market Challenges
5.4 Market Restraints
5.5 Industry News
5.5.1 New Product Developments
5.5.2 Mergers & Acquisitions
5.5.3 Expansions
5.5.4 Collaboration/Supply Contracts
5.6 Industry Policies
6 Photonic Bandgap Fiber Market Segmentation by Type
6.1 Evaluation Matrix of Segment Market Development Potential (Type)
6.2 Global Photonic Bandgap Fiber Sales Market Share by Type (2019-2025)
6.3 Global Photonic Bandgap Fiber Market Size Market Share by Type (2019-2025)
6.4 Global Photonic Bandgap Fiber Price by Type (2019-2025)
7 Photonic Bandgap Fiber Market Segmentation by Application
7.1 Evaluation Matrix of Segment Market Development Potential (Application)
7.2 Global Photonic Bandgap Fiber Market Sales by Application (2019-2025)
7.3 Global Photonic Bandgap Fiber Market Size (M USD) by Application (2019-2025)
7.4 Global Photonic Bandgap Fiber Sales Growth Rate by Application (2019-2025)
8 Photonic Bandgap Fiber Market Consumption by Region
8.1 Global Photonic Bandgap Fiber Sales by Region
8.1.1 Global Photonic Bandgap Fiber Sales by Region
8.1.2 Global Photonic Bandgap Fiber Sales Market Share by Region
8.2 North America
8.2.1 North America Photonic Bandgap Fiber Sales by Country
8.2.2 U.S.
8.2.3 Canada
8.2.4 Mexico
8.3 Europe
8.3.1 Europe Photonic Bandgap Fiber Sales by Country
8.3.2 Germany
8.3.3 France
8.3.4 U.K.
8.3.5 Italy
8.3.6 Russia
8.4 Asia Pacific
8.4.1 Asia Pacific Photonic Bandgap Fiber Sales by Region
8.4.2 China
8.4.3 Japan
8.4.4 South Korea
8.4.5 India
8.4.6 Southeast Asia
8.5 South America
8.5.1 South America Photonic Bandgap Fiber Sales by Country
8.5.2 Brazil
8.5.3 Argentina
8.5.4 Columbia
8.6 Middle East and Africa
8.6.1 Middle East and Africa Photonic Bandgap Fiber Sales by Region
8.6.2 Saudi Arabia
8.6.3 UAE
8.6.4 Egypt
8.6.5 Nigeria
8.6.6 South Africa
9 Photonic Bandgap Fiber Market Production by Region
9.1 Global Production of Photonic Bandgap Fiber by Region (2019-2025)
9.2 Global Photonic Bandgap Fiber Revenue Market Share by Region (2019-2025)
9.3 Global Photonic Bandgap Fiber Production, Revenue, Price and Gross Margin (2019-2025)
9.4 North America Photonic Bandgap Fiber Production
9.4.1 North America Photonic Bandgap Fiber Production Growth Rate (2019-2025)
9.4.2 North America Photonic Bandgap Fiber Production, Revenue, Price and Gross Margin (2019-2025)
9.5 Europe Photonic Bandgap Fiber Production
9.5.1 Europe Photonic Bandgap Fiber Production Growth Rate (2019-2025)
9.5.2 Europe Photonic Bandgap Fiber Production, Revenue, Price and Gross Margin (2019-2025)
9.6 Japan Photonic Bandgap Fiber Production (2019-2025)
9.6.1 Japan Photonic Bandgap Fiber Production Growth Rate (2019-2025)
9.6.2 Japan Photonic Bandgap Fiber Production, Revenue, Price and Gross Margin (2019-2025)
9.7 China Photonic Bandgap Fiber Production (2019-2025)
9.7.1 China Photonic Bandgap Fiber Production Growth Rate (2019-2025)
9.7.2 China Photonic Bandgap Fiber Production, Revenue, Price and Gross Margin (2019-2025)
10 Key Companies Profile
10.1 NKT Photonics
10.1.1 NKT Photonics Photonic Bandgap Fiber Basic Information
10.1.2 NKT Photonics Photonic Bandgap Fiber Product Overview
10.1.3 NKT Photonics Photonic Bandgap Fiber Product Market Performance
10.1.4 NKT Photonics Business Overview
10.1.5 NKT Photonics Photonic Bandgap Fiber SWOT Analysis
10.1.6 NKT Photonics Recent Developments
10.2 iXblue
10.2.1 iXblue Photonic Bandgap Fiber Basic Information
10.2.2 iXblue Photonic Bandgap Fiber Product Overview
10.2.3 iXblue Photonic Bandgap Fiber Product Market Performance
10.2.4 iXblue Business Overview
10.2.5 iXblue Photonic Bandgap Fiber SWOT Analysis
10.2.6 iXblue Recent Developments
10.3 Thorlabs
10.3.1 Thorlabs Photonic Bandgap Fiber Basic Information
10.3.2 Thorlabs Photonic Bandgap Fiber Product Overview
10.3.3 Thorlabs Photonic Bandgap Fiber Product Market Performance
10.3.4 Thorlabs Photonic Bandgap Fiber SWOT Analysis
10.3.5 Thorlabs Business Overview
10.3.6 Thorlabs Recent Developments
11 Photonic Bandgap Fiber Market Forecast by Region
11.1 Global Photonic Bandgap Fiber Market Size Forecast
11.2 Global Photonic Bandgap Fiber Market Forecast by Region
11.2.1 North America Market Size Forecast by Country
11.2.2 Europe Photonic Bandgap Fiber Market Size Forecast by Country
11.2.3 Asia Pacific Photonic Bandgap Fiber Market Size Forecast by Region
11.2.4 South America Photonic Bandgap Fiber Market Size Forecast by Country
11.2.5 Middle East and Africa Forecasted Consumption of Photonic Bandgap Fiber by Country
12 Forecast Market by Type and by Application (2025-2032)
12.1 Global Photonic Bandgap Fiber Market Forecast by Type (2025-2032)
12.1.1 Global Forecasted Sales of Photonic Bandgap Fiber by Type (2025-2032)
12.1.2 Global Photonic Bandgap Fiber Market Size Forecast by Type (2025-2032)
12.1.3 Global Forecasted Price of Photonic Bandgap Fiber by Type (2025-2032)
12.2 Global Photonic Bandgap Fiber Market Forecast by Application (2025-2032)
12.2.1 Global Photonic Bandgap Fiber Sales (K Units) Forecast by Application
12.2.2 Global Photonic Bandgap Fiber Market Size (M USD) Forecast by Application (2025-2032)
13 Conclusion and Key FindingsList of Tables
Table 1. Introduction of the Type
Table 2. Introduction of the Application
Table 3. Market Size (M USD) Segment Executive Summary
Table 4. Photonic Bandgap Fiber Market Size Comparison by Region (M USD)
Table 5. Global Photonic Bandgap Fiber Sales (K Units) by Manufacturers (2019-2025)
Table 6. Global Photonic Bandgap Fiber Sales Market Share by Manufacturers (2019-2025)
Table 7. Global Photonic Bandgap Fiber Revenue (M USD) by Manufacturers (2019-2025)
Table 8. Global Photonic Bandgap Fiber Revenue Share by Manufacturers (2019-2025)
Table 9. Company Type (Tier 1, Tier 2, and Tier 3) & (based on the Revenue in Photonic Bandgap Fiber as of 2022)
Table 10. Global Market Photonic Bandgap Fiber Average Price (USD/Unit) of Key Manufacturers (2019-2025)
Table 11. Manufacturers Photonic Bandgap Fiber Sales Sites and Area Served
Table 12. Manufacturers Photonic Bandgap Fiber Product Type
Table 13. Global Photonic Bandgap Fiber Manufacturers Market Concentration Ratio (CR5 and HHI)
Table 14. Mergers & Acquisitions, Expansion Plans
Table 15. Industry Chain Map of Photonic Bandgap Fiber
Table 16. Market Overview of Key Raw Materials
Table 17. Midstream Market Analysis
Table 18. Downstream Customer Analysis
Table 19. Key Development Trends
Table 20. Driving Factors
Table 21. Photonic Bandgap Fiber Market Challenges
Table 22. Global Photonic Bandgap Fiber Sales by Type (K Units)
Table 23. Global Photonic Bandgap Fiber Market Size by Type (M USD)
Table 24. Global Photonic Bandgap Fiber Sales (K Units) by Type (2019-2025)
Table 25. Global Photonic Bandgap Fiber Sales Market Share by Type (2019-2025)
Table 26. Global Photonic Bandgap Fiber Market Size (M USD) by Type (2019-2025)
Table 27. Global Photonic Bandgap Fiber Market Size Share by Type (2019-2025)
Table 28. Global Photonic Bandgap Fiber Price (USD/Unit) by Type (2019-2025)
Table 29. Global Photonic Bandgap Fiber Sales (K Units) by Application
Table 30. Global Photonic Bandgap Fiber Market Size by Application
Table 31. Global Photonic Bandgap Fiber Sales by Application (2019-2025) & (K Units)
Table 32. Global Photonic Bandgap Fiber Sales Market Share by Application (2019-2025)
Table 33. Global Photonic Bandgap Fiber Sales by Application (2019-2025) & (M USD)
Table 34. Global Photonic Bandgap Fiber Market Share by Application (2019-2025)
Table 35. Global Photonic Bandgap Fiber Sales Growth Rate by Application (2019-2025)
Table 36. Global Photonic Bandgap Fiber Sales by Region (2019-2025) & (K Units)
Table 37. Global Photonic Bandgap Fiber Sales Market Share by Region (2019-2025)
Table 38. North America Photonic Bandgap Fiber Sales by Country (2019-2025) & (K Units)
Table 39. Europe Photonic Bandgap Fiber Sales by Country (2019-2025) & (K Units)
Table 40. Asia Pacific Photonic Bandgap Fiber Sales by Region (2019-2025) & (K Units)
Table 41. South America Photonic Bandgap Fiber Sales by Country (2019-2025) & (K Units)
Table 42. Middle East and Africa Photonic Bandgap Fiber Sales by Region (2019-2025) & (K Units)
Table 43. Global Photonic Bandgap Fiber Production (K Units) by Region (2019-2025)
Table 44. Global Photonic Bandgap Fiber Revenue (US$ Million) by Region (2019-2025)
Table 45. Global Photonic Bandgap Fiber Revenue Market Share by Region (2019-2025)
Table 46. Global Photonic Bandgap Fiber Production (K Units), Revenue (US$ Million), Price (USD/Unit) and Gross Margin (2019-2025)
Table 47. North America Photonic Bandgap Fiber Production (K Units), Revenue (US$ Million), Price (USD/Unit) and Gross Margin (2019-2025)
Table 48. Europe Photonic Bandgap Fiber Production (K Units), Revenue (US$ Million), Price (USD/Unit) and Gross Margin (2019-2025)
Table 49. Japan Photonic Bandgap Fiber Production (K Units), Revenue (US$ Million), Price (USD/Unit) and Gross Margin (2019-2025)
Table 50. China Photonic Bandgap Fiber Production (K Units), Revenue (US$ Million), Price (USD/Unit) and Gross Margin (2019-2025)
Table 51. NKT Photonics Photonic Bandgap Fiber Basic Information
Table 52. NKT Photonics Photonic Bandgap Fiber Product Overview
Table 53. NKT Photonics Photonic Bandgap Fiber Sales (K Units), Revenue (M USD), Price (USD/Unit) and Gross Margin (2019-2025)
Table 54. NKT Photonics Business Overview
Table 55. NKT Photonics Photonic Bandgap Fiber SWOT Analysis
Table 56. NKT Photonics Recent Developments
Table 57. iXblue Photonic Bandgap Fiber Basic Information
Table 58. iXblue Photonic Bandgap Fiber Product Overview
Table 59. iXblue Photonic Bandgap Fiber Sales (K Units), Revenue (M USD), Price (USD/Unit) and Gross Margin (2019-2025)
Table 60. iXblue Business Overview
Table 61. iXblue Photonic Bandgap Fiber SWOT Analysis
Table 62. iXblue Recent Developments
Table 63. Thorlabs Photonic Bandgap Fiber Basic Information
Table 64. Thorlabs Photonic Bandgap Fiber Product Overview
Table 65. Thorlabs Photonic Bandgap Fiber Sales (K Units), Revenue (M USD), Price (USD/Unit) and Gross Margin (2019-2025)
Table 66. Thorlabs Photonic Bandgap Fiber SWOT Analysis
Table 67. Thorlabs Business Overview
Table 68. Thorlabs Recent Developments
Table 69. Global Photonic Bandgap Fiber Sales Forecast by Region (2025-2032) & (K Units)
Table 70. Global Photonic Bandgap Fiber Market Size Forecast by Region (2025-2032) & (M USD)
Table 71. North America Photonic Bandgap Fiber Sales Forecast by Country (2025-2032) & (K Units)
Table 72. North America Photonic Bandgap Fiber Market Size Forecast by Country (2025-2032) & (M USD)
Table 73. Europe Photonic Bandgap Fiber Sales Forecast by Country (2025-2032) & (K Units)
Table 74. Europe Photonic Bandgap Fiber Market Size Forecast by Country (2025-2032) & (M USD)
Table 75. Asia Pacific Photonic Bandgap Fiber Sales Forecast by Region (2025-2032) & (K Units)
Table 76. Asia Pacific Photonic Bandgap Fiber Market Size Forecast by Region (2025-2032) & (M USD)
Table 77. South America Photonic Bandgap Fiber Sales Forecast by Country (2025-2032) & (K Units)
Table 78. South America Photonic Bandgap Fiber Market Size Forecast by Country (2025-2032) & (M USD)
Table 79. Middle East and Africa Photonic Bandgap Fiber Consumption Forecast by Country (2025-2032) & (Units)
Table 80. Middle East and Africa Photonic Bandgap Fiber Market Size Forecast by Country (2025-2032) & (M USD)
Table 81. Global Photonic Bandgap Fiber Sales Forecast by Type (2025-2032) & (K Units)
Table 82. Global Photonic Bandgap Fiber Market Size Forecast by Type (2025-2032) & (M USD)
Table 83. Global Photonic Bandgap Fiber Price Forecast by Type (2025-2032) & (USD/Unit)
Table 84. Global Photonic Bandgap Fiber Sales (K Units) Forecast by Application (2025-2032)
Table 85. Global Photonic Bandgap Fiber Market Size Forecast by Application (2025-2032) & (M USD)
List of Figures
Figure 1. Product Picture of Photonic Bandgap Fiber
Figure 2. Data Triangulation
Figure 3. Key Caveats
Figure 4. Global Photonic Bandgap Fiber Market Size (M USD), 2019-2032
Figure 5. Global Photonic Bandgap Fiber Market Size (M USD) (2019-2032)
Figure 6. Global Photonic Bandgap Fiber Sales (K Units) & (2019-2032)
Figure 7. Evaluation Matrix of Segment Market Development Potential (Type)
Figure 8. Evaluation Matrix of Segment Market Development Potential (Application)
Figure 9. Evaluation Matrix of Regional Market Development Potential
Figure 10. Photonic Bandgap Fiber Market Size by Country (M USD)
Figure 11. Photonic Bandgap Fiber Sales Share by Manufacturers in 2023
Figure 12. Global Photonic Bandgap Fiber Revenue Share by Manufacturers in 2023
Figure 13. Photonic Bandgap Fiber Market Share by Company Type (Tier 1, Tier 2 and Tier 3): 2023
Figure 14. Global Market Photonic Bandgap Fiber Average Price (USD/Unit) of Key Manufacturers in 2023
Figure 15. The Global 5 and 10 Largest Players: Market Share by Photonic Bandgap Fiber Revenue in 2023
Figure 16. Evaluation Matrix of Segment Market Development Potential (Type)
Figure 17. Global Photonic Bandgap Fiber Market Share by Type
Figure 18. Sales Market Share of Photonic Bandgap Fiber by Type (2019-2025)
Figure 19. Sales Market Share of Photonic Bandgap Fiber by Type in 2023
Figure 20. Market Size Share of Photonic Bandgap Fiber by Type (2019-2025)
Figure 21. Market Size Market Share of Photonic Bandgap Fiber by Type in 2023
Figure 22. Evaluation Matrix of Segment Market Development Potential (Application)
Figure 23. Global Photonic Bandgap Fiber Market Share by Application
Figure 24. Global Photonic Bandgap Fiber Sales Market Share by Application (2019-2025)
Figure 25. Global Photonic Bandgap Fiber Sales Market Share by Application in 2023
Figure 26. Global Photonic Bandgap Fiber Market Share by Application (2019-2025)
Figure 27. Global Photonic Bandgap Fiber Market Share by Application in 2023
Figure 28. Global Photonic Bandgap Fiber Sales Growth Rate by Application (2019-2025)
Figure 29. Global Photonic Bandgap Fiber Sales Market Share by Region (2019-2025)
Figure 30. North America Photonic Bandgap Fiber Sales and Growth Rate (2019-2025) & (K Units)
Figure 31. North America Photonic Bandgap Fiber Sales Market Share by Country in 2023
Figure 32. U.S. Photonic Bandgap Fiber Sales and Growth Rate (2019-2025) & (K Units)
Figure 33. Canada Photonic Bandgap Fiber Sales (K Units) and Growth Rate (2019-2025)
Figure 34. Mexico Photonic Bandgap Fiber Sales (Units) and Growth Rate (2019-2025)
Figure 35. Europe Photonic Bandgap Fiber Sales and Growth Rate (2019-2025) & (K Units)
Figure 36. Europe Photonic Bandgap Fiber Sales Market Share by Country in 2023
Figure 37. Germany Photonic Bandgap Fiber Sales and Growth Rate (2019-2025) & (K Units)
Figure 38. France Photonic Bandgap Fiber Sales and Growth Rate (2019-2025) & (K Units)
Figure 39. U.K. Photonic Bandgap Fiber Sales and Growth Rate (2019-2025) & (K Units)
Figure 40. Italy Photonic Bandgap Fiber Sales and Growth Rate (2019-2025) & (K Units)
Figure 41. Russia Photonic Bandgap Fiber Sales and Growth Rate (2019-2025) & (K Units)
Figure 42. Asia Pacific Photonic Bandgap Fiber Sales and Growth Rate (K Units)
Figure 43. Asia Pacific Photonic Bandgap Fiber Sales Market Share by Region in 2023
Figure 44. China Photonic Bandgap Fiber Sales and Growth Rate (2019-2025) & (K Units)
Figure 45. Japan Photonic Bandgap Fiber Sales and Growth Rate (2019-2025) & (K Units)
Figure 46. South Korea Photonic Bandgap Fiber Sales and Growth Rate (2019-2025) & (K Units)
Figure 47. India Photonic Bandgap Fiber Sales and Growth Rate (2019-2025) & (K Units)
Figure 48. Southeast Asia Photonic Bandgap Fiber Sales and Growth Rate (2019-2025) & (K Units)
Figure 49. South America Photonic Bandgap Fiber Sales and Growth Rate (K Units)
Figure 50. South America Photonic Bandgap Fiber Sales Market Share by Country in 2023
Figure 51. Brazil Photonic Bandgap Fiber Sales and Growth Rate (2019-2025) & (K Units)
Figure 52. Argentina Photonic Bandgap Fiber Sales and Growth Rate (2019-2025) & (K Units)
Figure 53. Columbia Photonic Bandgap Fiber Sales and Growth Rate (2019-2025) & (K Units)
Figure 54. Middle East and Africa Photonic Bandgap Fiber Sales and Growth Rate (K Units)
Figure 55. Middle East and Africa Photonic Bandgap Fiber Sales Market Share by Region in 2023
Figure 56. Saudi Arabia Photonic Bandgap Fiber Sales and Growth Rate (2019-2025) & (K Units)
Figure 57. UAE Photonic Bandgap Fiber Sales and Growth Rate (2019-2025) & (K Units)
Figure 58. Egypt Photonic Bandgap Fiber Sales and Growth Rate (2019-2025) & (K Units)
Figure 59. Nigeria Photonic Bandgap Fiber Sales and Growth Rate (2019-2025) & (K Units)
Figure 60. South Africa Photonic Bandgap Fiber Sales and Growth Rate (2019-2025) & (K Units)
Figure 61. Global Photonic Bandgap Fiber Production Market Share by Region (2019-2025)
Figure 62. North America Photonic Bandgap Fiber Production (K Units) Growth Rate (2019-2025)
Figure 63. Europe Photonic Bandgap Fiber Production (K Units) Growth Rate (2019-2025)
Figure 64. Japan Photonic Bandgap Fiber Production (K Units) Growth Rate (2019-2025)
Figure 65. China Photonic Bandgap Fiber Production (K Units) Growth Rate (2019-2025)
Figure 66. Global Photonic Bandgap Fiber Sales Forecast by Volume (2019-2032) & (K Units)
Figure 67. Global Photonic Bandgap Fiber Market Size Forecast by Value (2019-2032) & (M USD)
Figure 68. Global Photonic Bandgap Fiber Sales Market Share Forecast by Type (2025-2032)
Figure 69. Global Photonic Bandgap Fiber Market Share Forecast by Type (2025-2032)
Figure 70. Global Photonic Bandgap Fiber Sales Forecast by Application (2025-2032)
Figure 71. Global Photonic Bandgap Fiber Market Share Forecast by Application (2025-2032)