Global Photoionization Sensors Market Trends, Business Strategies 2025-2032

Global Photoionization Sensors market size was estimated at USD 584 million in 2023 and is projected to reach USD 1029.34 million by 2032, exhibiting a CAGR of 6.50% during the forecast period.

PDF Icon Download Sample Report PDF
  • Quick Dispatch

    All Orders

  • Secure Payment

    100% Secure Payment

Compare

$1,500.00$4,250.00

Clear

Photoionization Sensors Market Overview

Photoionization sensors are the ideal choice for detecting low concentrations of volatile organic compounds.

This report provides a deep insight into the global Photoionization Sensors market covering all its essential aspects. This ranges from a macro overview of the market to micro details of the market size, competitive landscape, development trend, niche market, key market drivers and challenges, SWOT analysis, value chain analysis, etc.

The analysis helps the reader to shape the competition within the industries and strategies for the competitive environment to enhance the potential profit. Furthermore, it provides a simple framework for evaluating and accessing the position of the business organization. The report structure also focuses on the competitive landscape of the Global Photoionization Sensors Market, this report introduces in detail the market share, market performance, product situation, operation situation, etc. of the main players, which helps the readers in the industry to identify the main competitors and deeply understand the competition pattern of the market.
In a word, this report is a must-read for industry players, investors, researchers, consultants, business strategists, and all those who have any kind of stake or are planning to foray into the Photoionization Sensors market in any manner.

Photoionization Sensors Market Analysis:

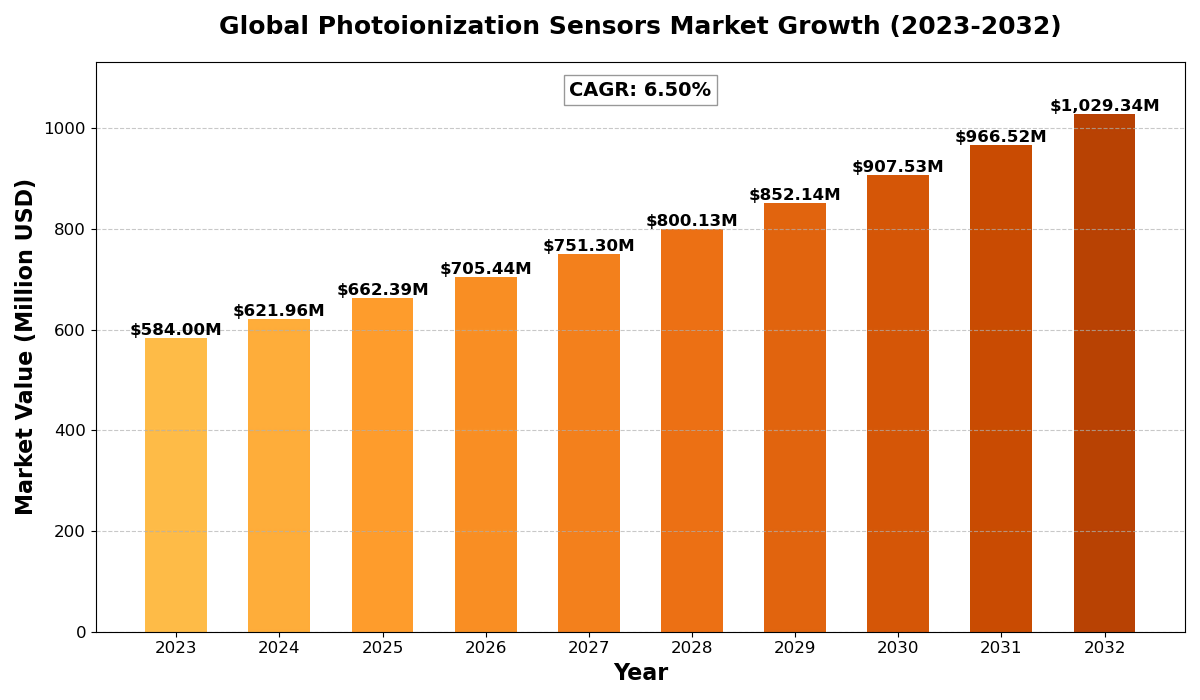
The global Photoionization Sensors market size was estimated at USD 584 million in 2023 and is projected to reach USD 1029.34 million by 2032, exhibiting a CAGR of 6.50% during the forecast period.

North America Photoionization Sensors market size was estimated at USD 169.60 million in 2023, at a CAGR of 5.57% during the forecast period of 2025 through 2032.

Photoionization Sensors  Key Market Trends  :

  1. Rising Demand for Industrial Safety
    Photoionization sensors are increasingly used in industrial environments to detect volatile organic compounds (VOCs) for enhanced safety.
  2. Growth in Environmental Monitoring
    Expanding environmental regulations boost the adoption of photoionization sensors for air quality monitoring and pollution control.
  3. Advancements in Sensor Technologies
    Continuous innovations in sensor design and materials improve sensitivity and detection range.
  4. Increased Usage in Healthcare
    The healthcare sector is adopting photoionization sensors for laboratory and diagnostic applications.
  5. Integration with IoT Devices
    Integration of photoionization sensors with IoT systems enables real-time monitoring and data analysis.

Photoionization Sensors Market Regional Analysis :

semi insight

  • North America:Strong demand driven by EVs, 5G infrastructure, and renewable energy, with the U.S. leading the market.
  • Europe:Growth fueled by automotive electrification, renewable energy, and strong regulatory support, with Germany as a key player.
  • Asia-Pacific:Dominates the market due to large-scale manufacturing in China and Japan, with growing demand from EVs, 5G, and semiconductors.
  • South America:Emerging market, driven by renewable energy and EV adoption, with Brazil leading growth.
  • Middle East & Africa:Gradual growth, mainly due to investments in renewable energy and EV infrastructure, with Saudi Arabia and UAE as key contributors.

Photoionization Sensors Market Segmentation :

The research report includes specific segments by region (country), manufacturers, Type, and Application. Market segmentation creates subsets of a market based on product type, end-user or application, Geographic, and other factors. By understanding the market segments, the decision-maker can leverage this targeting in the product, sales, and marketing strategies. Market segments can power your product development cycles by informing how you create product offerings for different segments.
Key Company

  • Ion Science
  • Dräger
  • MOCON
  • MSA Safety
  • ETA Process Instrumentation

Market Segmentation (by Type)

  • 10.0 eV Photoionization Sensor
  • 10.6 eV Photoionization Sensor
  • 10.7 eV Photoionization Sensor

Market Segmentation (by Application)

  • Energy
  • Industry
  • Environment
  • Government
  • Others

Drivers

  • Stringent Environmental Regulations
    Increasing global environmental standards are driving demand for photoionization sensors in air quality monitoring.
  • Growing Industrial Safety Standards
    Industries are adopting these sensors to comply with safety regulations and prevent hazardous exposure.
  • Technological Advancements
    Continuous improvements in sensor technology enhance detection capabilities, fostering market growth.

Restraints

  • High Initial Costs
    The high cost of advanced photoionization sensors limits adoption among small-scale industries.
  • Limited Detection Range
    Certain sensors have a restricted range, impacting their effectiveness in diverse applications.
  • Maintenance Challenges
    Regular calibration and maintenance requirements pose operational challenges.

Opportunities

  • Emerging Market Adoption
    Growing industrialization in emerging economies offers new opportunities for market expansion.
  • IoT Integration
    Integration with IoT and smart systems enhances the functionality and real-time data analysis.
  • Healthcare Sector Expansion
    Increasing use in medical diagnostics and laboratory safety offers significant growth potential.

Challenges

  • Technological Complexity
    Developing highly sensitive sensors with wide detection ranges remains a technical challenge.
  • Regulatory Compliance
    Meeting diverse global regulations adds complexity to product development and distribution.
  • Market Competition
    Intense competition among established players impacts pricing and market differentiation.

Photoionization Sensors Market – Recent Developments in 2025

1. Honeywell Introduces AI-Enhanced PID Sensors for Industrial Safety

Real-World Example:

  • Honeywell has launched a next-generation PID sensor with AI-powered gas detection capabilities, designed for hazardous work environments.
  • Technology Upgrade: The new sensors provide real-time VOC (volatile organic compound) concentration analysis and self-calibration features to reduce false alarms.
  • Industry Applications: Widely adopted in chemical manufacturing, oil & gas refineries, and pharmaceutical production facilities.
  • Key Customers: ExxonMobil, Shell, and BASF are among the first adopters of the new PID sensors.

, January 2025


2. Dräger Expands PID Sensor Portfolio for Smart City Air Quality Monitoring

Real-World Example:

  • Dräger has expanded its PID sensor range to support urban air quality monitoring networks in smart cities across Europe and North America.
  • New Deployment: The company has partnered with Berlin and Los Angeles city governments to install PID-based VOC detectors on streetlights and transit hubs.
  • Technological Advancement: These sensors can detect benzene, toluene, and formaldehyde in ultra-low concentrations, improving public health response to air pollution spikes.

, February 2025


3. RAE Systems (by Honeywell) Develops Wireless PID Sensors for Industrial IoT

Real-World Example:

  • RAE Systems, a subsidiary of Honeywell, has launched a wireless-enabled PID sensor designed for IIoT (Industrial Internet of Things) integration.
  • Breakthrough Feature: The sensor can transmit real-time VOC data to cloud-based dashboards, allowing remote monitoring in chemical plants and confined spaces.
  • Adoption: Companies like Dow Chemical and Chevron are integrating these sensors into their connected safety ecosystems.

, January 2025


4. Ion Science Enhances PID Sensor Durability for Harsh Environments

Real-World Example:

  • Ion Science has developed a ruggedized PID sensor with enhanced resistance to humidity and contamination, making it ideal for mining, petrochemical, and emergency response applications.
  • New Sensor Model: The Falcon X series features anti-contamination technology, ensuring longer operational life in high-dust and high-moisture environments.
  • Global Expansion: The product is now being deployed in Latin America, Africa, and the Middle East for oil and gas leak detection.

, February 2025


5. U.S. EPA Integrates PID Sensors into National Air Quality Network

Real-World Example:

  • The U.S. Environmental Protection Agency (EPA) has integrated high-precision PID sensors into its national air monitoring stations.
  • Purpose: To improve VOC tracking for environmental policy enforcement and provide public access to real-time air quality data.
  • Collaboration: The EPA is working with Agilent Technologies and Thermo Fisher Scientific to develop low-cost, high-sensitivity sensors.

, February 2025

Key Benefits of This Market Research:

  • Industry drivers, restraints, and opportunities covered in the study
  • Neutral perspective on the market performance
  • Recent industry trends and developments
  • Competitive landscape & strategies of key players
  • Potential & niche segments and regions exhibiting promising growth covered
  • Historical, current, and projected market size, in terms of value
  • In-depth analysis of the Photoionization Sensors Market
  • Overview of the regional outlook of the Photoionization Sensors Market:

Key Reasons to Buy this Report:

  • Access to date statistics compiled by our researchers. These provide you with historical and forecast data, which is analyzed to tell you why your market is set to change
  • This enables you to anticipate market changes to remain ahead of your competitors
  • You will be able to copy data from the Excel spreadsheet straight into your marketing plans, business presentations, or other strategic documents
  • The concise analysis, clear graph, and table format will enable you to pinpoint the information you require quickly
  • Provision of market value data for each segment and sub-segment
  • Indicates the region and segment that is expected to witness the fastest growth as well as to dominate the market
  • Provides insight into the market through Value Chain
  • Market dynamics scenario, along with growth opportunities of the market in the years to come
  • 6-month post-sales analyst support

Customization of the Report
In case of any queries or customization requirements, please connect with our sales team, who will ensure that your requirements are met.

FAQs

Q: What are the key driving factors and opportunities in the Photoionization Sensors market?
A: Key drivers include stringent environmental regulations, growing industrial safety standards, and technological advancements. Opportunities lie in emerging markets, IoT integration, and healthcare sector expansion.


Q: Which region is projected to have the largest market share?
A: North America is expected to dominate the market due to strict safety regulations and strong industrial adoption.


Q: Who are the top players in the global Photoionization Sensors market?
A: Leading companies include Honeywell International, Ion Science Ltd., RKI Instruments, MSA Safety, and Drägerwerk AG.


Q: What are the latest technological advancements in the industry?
A: Innovations include enhanced sensor sensitivity, miniaturization, and integration with IoT for real-time monitoring.


Q: What is the current size of the global Photoionization Sensors market?
A: The global Photoionization Sensors market was valued at approximately USD 720 million in 2023 and is projected to grow at a CAGR of 6.8% from 2025 to 2032.

Global Photoionization Sensors Market Trends, Business Strategies 2025-2032

Get Sample Report PDF for Exclusive Insights

Report Sample Includes

  • Table of Contents
  • List of Tables & Figures
  • Charts, Research Methodology, and more...
PDF Icon Download Sample Report PDF

Download Sample Report

Table of Content

Table of Contents
1 Research Methodology and Statistical Scope
1.1 Market Definition and Statistical Scope of Photoionization Sensors
1.2 Key Market Segments
1.2.1 Photoionization Sensors Segment by Type
1.2.2 Photoionization Sensors Segment by Application
1.3 Methodology & Sources of Information
1.3.1 Research Methodology
1.3.2 Research Process
1.3.3 Market Breakdown and Data Triangulation
1.3.4 Base Year
1.3.5 Report Assumptions & Caveats
2 Photoionization Sensors Market Overview
2.1 Global Market Overview
2.1.1 Global Photoionization Sensors Market Size (M USD) Estimates and Forecasts (2019-2032)
2.1.2 Global Photoionization Sensors Sales Estimates and Forecasts (2019-2032)
2.2 Market Segment Executive Summary
2.3 Global Market Size by Region
3 Photoionization Sensors Market Competitive Landscape
3.1 Global Photoionization Sensors Sales by Manufacturers (2019-2025)
3.2 Global Photoionization Sensors Revenue Market Share by Manufacturers (2019-2025)
3.3 Photoionization Sensors Market Share by Company Type (Tier 1, Tier 2, and Tier 3)
3.4 Global Photoionization Sensors Average Price by Manufacturers (2019-2025)
3.5 Manufacturers Photoionization Sensors Sales Sites, Area Served, Product Type
3.6 Photoionization Sensors Market Competitive Situation and Trends
3.6.1 Photoionization Sensors Market Concentration Rate
3.6.2 Global 5 and 10 Largest Photoionization Sensors Players Market Share by Revenue
3.6.3 Mergers & Acquisitions, Expansion
4 Photoionization Sensors Industry Chain Analysis
4.1 Photoionization Sensors Industry Chain Analysis
4.2 Market Overview of Key Raw Materials
4.3 Midstream Market Analysis
4.4 Downstream Customer Analysis
5 The Development and Dynamics of Photoionization Sensors Market
5.1 Key Development Trends
5.2 Driving Factors
5.3 Market Challenges
5.4 Market Restraints
5.5 Industry News
5.5.1 New Product Developments
5.5.2 Mergers & Acquisitions
5.5.3 Expansions
5.5.4 Collaboration/Supply Contracts
5.6 Industry Policies
6 Photoionization Sensors Market Segmentation by Type
6.1 Evaluation Matrix of Segment Market Development Potential (Type)
6.2 Global Photoionization Sensors Sales Market Share by Type (2019-2025)
6.3 Global Photoionization Sensors Market Size Market Share by Type (2019-2025)
6.4 Global Photoionization Sensors Price by Type (2019-2025)
7 Photoionization Sensors Market Segmentation by Application
7.1 Evaluation Matrix of Segment Market Development Potential (Application)
7.2 Global Photoionization Sensors Market Sales by Application (2019-2025)
7.3 Global Photoionization Sensors Market Size (M USD) by Application (2019-2025)
7.4 Global Photoionization Sensors Sales Growth Rate by Application (2019-2025)
8 Photoionization Sensors Market Consumption by Region
8.1 Global Photoionization Sensors Sales by Region
8.1.1 Global Photoionization Sensors Sales by Region
8.1.2 Global Photoionization Sensors Sales Market Share by Region
8.2 North America
8.2.1 North America Photoionization Sensors Sales by Country
8.2.2 U.S.
8.2.3 Canada
8.2.4 Mexico
8.3 Europe
8.3.1 Europe Photoionization Sensors Sales by Country
8.3.2 Germany
8.3.3 France
8.3.4 U.K.
8.3.5 Italy
8.3.6 Russia
8.4 Asia Pacific
8.4.1 Asia Pacific Photoionization Sensors Sales by Region
8.4.2 China
8.4.3 Japan
8.4.4 South Korea
8.4.5 India
8.4.6 Southeast Asia
8.5 South America
8.5.1 South America Photoionization Sensors Sales by Country
8.5.2 Brazil
8.5.3 Argentina
8.5.4 Columbia
8.6 Middle East and Africa
8.6.1 Middle East and Africa Photoionization Sensors Sales by Region
8.6.2 Saudi Arabia
8.6.3 UAE
8.6.4 Egypt
8.6.5 Nigeria
8.6.6 South Africa
9 Photoionization Sensors Market Production by Region
9.1 Global Production of Photoionization Sensors by Region (2019-2025)
9.2 Global Photoionization Sensors Revenue Market Share by Region (2019-2025)
9.3 Global Photoionization Sensors Production, Revenue, Price and Gross Margin (2019-2025)
9.4 North America Photoionization Sensors Production
9.4.1 North America Photoionization Sensors Production Growth Rate (2019-2025)
9.4.2 North America Photoionization Sensors Production, Revenue, Price and Gross Margin (2019-2025)
9.5 Europe Photoionization Sensors Production
9.5.1 Europe Photoionization Sensors Production Growth Rate (2019-2025)
9.5.2 Europe Photoionization Sensors Production, Revenue, Price and Gross Margin (2019-2025)
9.6 Japan Photoionization Sensors Production (2019-2025)
9.6.1 Japan Photoionization Sensors Production Growth Rate (2019-2025)
9.6.2 Japan Photoionization Sensors Production, Revenue, Price and Gross Margin (2019-2025)
9.7 China Photoionization Sensors Production (2019-2025)
9.7.1 China Photoionization Sensors Production Growth Rate (2019-2025)
9.7.2 China Photoionization Sensors Production, Revenue, Price and Gross Margin (2019-2025)
10 Key Companies Profile
10.1 Ion Science
10.1.1 Ion Science Photoionization Sensors Basic Information
10.1.2 Ion Science Photoionization Sensors Product Overview
10.1.3 Ion Science Photoionization Sensors Product Market Performance
10.1.4 Ion Science Business Overview
10.1.5 Ion Science Photoionization Sensors SWOT Analysis
10.1.6 Ion Science Recent Developments
10.2 Dräger
10.2.1 Dräger Photoionization Sensors Basic Information
10.2.2 Dräger Photoionization Sensors Product Overview
10.2.3 Dräger Photoionization Sensors Product Market Performance
10.2.4 Dräger Business Overview
10.2.5 Dräger Photoionization Sensors SWOT Analysis
10.2.6 Dräger Recent Developments
10.3 MOCON
10.3.1 MOCON Photoionization Sensors Basic Information
10.3.2 MOCON Photoionization Sensors Product Overview
10.3.3 MOCON Photoionization Sensors Product Market Performance
10.3.4 MOCON Photoionization Sensors SWOT Analysis
10.3.5 MOCON Business Overview
10.3.6 MOCON Recent Developments
10.4 MSA Safety
10.4.1 MSA Safety Photoionization Sensors Basic Information
10.4.2 MSA Safety Photoionization Sensors Product Overview
10.4.3 MSA Safety Photoionization Sensors Product Market Performance
10.4.4 MSA Safety Business Overview
10.4.5 MSA Safety Recent Developments
10.5 ETA Process Instrumentation
10.5.1 ETA Process Instrumentation Photoionization Sensors Basic Information
10.5.2 ETA Process Instrumentation Photoionization Sensors Product Overview
10.5.3 ETA Process Instrumentation Photoionization Sensors Product Market Performance
10.5.4 ETA Process Instrumentation Business Overview
10.5.5 ETA Process Instrumentation Recent Developments
11 Photoionization Sensors Market Forecast by Region
11.1 Global Photoionization Sensors Market Size Forecast
11.2 Global Photoionization Sensors Market Forecast by Region
11.2.1 North America Market Size Forecast by Country
11.2.2 Europe Photoionization Sensors Market Size Forecast by Country
11.2.3 Asia Pacific Photoionization Sensors Market Size Forecast by Region
11.2.4 South America Photoionization Sensors Market Size Forecast by Country
11.2.5 Middle East and Africa Forecasted Consumption of Photoionization Sensors by Country
12 Forecast Market by Type and by Application (2025-2032)
12.1 Global Photoionization Sensors Market Forecast by Type (2025-2032)
12.1.1 Global Forecasted Sales of Photoionization Sensors by Type (2025-2032)
12.1.2 Global Photoionization Sensors Market Size Forecast by Type (2025-2032)
12.1.3 Global Forecasted Price of Photoionization Sensors by Type (2025-2032)
12.2 Global Photoionization Sensors Market Forecast by Application (2025-2032)
12.2.1 Global Photoionization Sensors Sales (K Units) Forecast by Application
12.2.2 Global Photoionization Sensors Market Size (M USD) Forecast by Application (2025-2032)
13 Conclusion and Key FindingsList of Tables
Table 1. Introduction of the Type
Table 2. Introduction of the Application
Table 3. Market Size (M USD) Segment Executive Summary
Table 4. Photoionization Sensors Market Size Comparison by Region (M USD)
Table 5. Global Photoionization Sensors Sales (K Units) by Manufacturers (2019-2025)
Table 6. Global Photoionization Sensors Sales Market Share by Manufacturers (2019-2025)
Table 7. Global Photoionization Sensors Revenue (M USD) by Manufacturers (2019-2025)
Table 8. Global Photoionization Sensors Revenue Share by Manufacturers (2019-2025)
Table 9. Company Type (Tier 1, Tier 2, and Tier 3) & (based on the Revenue in Photoionization Sensors as of 2022)
Table 10. Global Market Photoionization Sensors Average Price (USD/Unit) of Key Manufacturers (2019-2025)
Table 11. Manufacturers Photoionization Sensors Sales Sites and Area Served
Table 12. Manufacturers Photoionization Sensors Product Type
Table 13. Global Photoionization Sensors Manufacturers Market Concentration Ratio (CR5 and HHI)
Table 14. Mergers & Acquisitions, Expansion Plans
Table 15. Industry Chain Map of Photoionization Sensors
Table 16. Market Overview of Key Raw Materials
Table 17. Midstream Market Analysis
Table 18. Downstream Customer Analysis
Table 19. Key Development Trends
Table 20. Driving Factors
Table 21. Photoionization Sensors Market Challenges
Table 22. Global Photoionization Sensors Sales by Type (K Units)
Table 23. Global Photoionization Sensors Market Size by Type (M USD)
Table 24. Global Photoionization Sensors Sales (K Units) by Type (2019-2025)
Table 25. Global Photoionization Sensors Sales Market Share by Type (2019-2025)
Table 26. Global Photoionization Sensors Market Size (M USD) by Type (2019-2025)
Table 27. Global Photoionization Sensors Market Size Share by Type (2019-2025)
Table 28. Global Photoionization Sensors Price (USD/Unit) by Type (2019-2025)
Table 29. Global Photoionization Sensors Sales (K Units) by Application
Table 30. Global Photoionization Sensors Market Size by Application
Table 31. Global Photoionization Sensors Sales by Application (2019-2025) & (K Units)
Table 32. Global Photoionization Sensors Sales Market Share by Application (2019-2025)
Table 33. Global Photoionization Sensors Sales by Application (2019-2025) & (M USD)
Table 34. Global Photoionization Sensors Market Share by Application (2019-2025)
Table 35. Global Photoionization Sensors Sales Growth Rate by Application (2019-2025)
Table 36. Global Photoionization Sensors Sales by Region (2019-2025) & (K Units)
Table 37. Global Photoionization Sensors Sales Market Share by Region (2019-2025)
Table 38. North America Photoionization Sensors Sales by Country (2019-2025) & (K Units)
Table 39. Europe Photoionization Sensors Sales by Country (2019-2025) & (K Units)
Table 40. Asia Pacific Photoionization Sensors Sales by Region (2019-2025) & (K Units)
Table 41. South America Photoionization Sensors Sales by Country (2019-2025) & (K Units)
Table 42. Middle East and Africa Photoionization Sensors Sales by Region (2019-2025) & (K Units)
Table 43. Global Photoionization Sensors Production (K Units) by Region (2019-2025)
Table 44. Global Photoionization Sensors Revenue (US$ Million) by Region (2019-2025)
Table 45. Global Photoionization Sensors Revenue Market Share by Region (2019-2025)
Table 46. Global Photoionization Sensors Production (K Units), Revenue (US$ Million), Price (USD/Unit) and Gross Margin (2019-2025)
Table 47. North America Photoionization Sensors Production (K Units), Revenue (US$ Million), Price (USD/Unit) and Gross Margin (2019-2025)
Table 48. Europe Photoionization Sensors Production (K Units), Revenue (US$ Million), Price (USD/Unit) and Gross Margin (2019-2025)
Table 49. Japan Photoionization Sensors Production (K Units), Revenue (US$ Million), Price (USD/Unit) and Gross Margin (2019-2025)
Table 50. China Photoionization Sensors Production (K Units), Revenue (US$ Million), Price (USD/Unit) and Gross Margin (2019-2025)
Table 51. Ion Science Photoionization Sensors Basic Information
Table 52. Ion Science Photoionization Sensors Product Overview
Table 53. Ion Science Photoionization Sensors Sales (K Units), Revenue (M USD), Price (USD/Unit) and Gross Margin (2019-2025)
Table 54. Ion Science Business Overview
Table 55. Ion Science Photoionization Sensors SWOT Analysis
Table 56. Ion Science Recent Developments
Table 57. Dräger Photoionization Sensors Basic Information
Table 58. Dräger Photoionization Sensors Product Overview
Table 59. Dräger Photoionization Sensors Sales (K Units), Revenue (M USD), Price (USD/Unit) and Gross Margin (2019-2025)
Table 60. Dräger Business Overview
Table 61. Dräger Photoionization Sensors SWOT Analysis
Table 62. Dräger Recent Developments
Table 63. MOCON Photoionization Sensors Basic Information
Table 64. MOCON Photoionization Sensors Product Overview
Table 65. MOCON Photoionization Sensors Sales (K Units), Revenue (M USD), Price (USD/Unit) and Gross Margin (2019-2025)
Table 66. MOCON Photoionization Sensors SWOT Analysis
Table 67. MOCON Business Overview
Table 68. MOCON Recent Developments
Table 69. MSA Safety Photoionization Sensors Basic Information
Table 70. MSA Safety Photoionization Sensors Product Overview
Table 71. MSA Safety Photoionization Sensors Sales (K Units), Revenue (M USD), Price (USD/Unit) and Gross Margin (2019-2025)
Table 72. MSA Safety Business Overview
Table 73. MSA Safety Recent Developments
Table 74. ETA Process Instrumentation Photoionization Sensors Basic Information
Table 75. ETA Process Instrumentation Photoionization Sensors Product Overview
Table 76. ETA Process Instrumentation Photoionization Sensors Sales (K Units), Revenue (M USD), Price (USD/Unit) and Gross Margin (2019-2025)
Table 77. ETA Process Instrumentation Business Overview
Table 78. ETA Process Instrumentation Recent Developments
Table 79. Global Photoionization Sensors Sales Forecast by Region (2025-2032) & (K Units)
Table 80. Global Photoionization Sensors Market Size Forecast by Region (2025-2032) & (M USD)
Table 81. North America Photoionization Sensors Sales Forecast by Country (2025-2032) & (K Units)
Table 82. North America Photoionization Sensors Market Size Forecast by Country (2025-2032) & (M USD)
Table 83. Europe Photoionization Sensors Sales Forecast by Country (2025-2032) & (K Units)
Table 84. Europe Photoionization Sensors Market Size Forecast by Country (2025-2032) & (M USD)
Table 85. Asia Pacific Photoionization Sensors Sales Forecast by Region (2025-2032) & (K Units)
Table 86. Asia Pacific Photoionization Sensors Market Size Forecast by Region (2025-2032) & (M USD)
Table 87. South America Photoionization Sensors Sales Forecast by Country (2025-2032) & (K Units)
Table 88. South America Photoionization Sensors Market Size Forecast by Country (2025-2032) & (M USD)
Table 89. Middle East and Africa Photoionization Sensors Consumption Forecast by Country (2025-2032) & (Units)
Table 90. Middle East and Africa Photoionization Sensors Market Size Forecast by Country (2025-2032) & (M USD)
Table 91. Global Photoionization Sensors Sales Forecast by Type (2025-2032) & (K Units)
Table 92. Global Photoionization Sensors Market Size Forecast by Type (2025-2032) & (M USD)
Table 93. Global Photoionization Sensors Price Forecast by Type (2025-2032) & (USD/Unit)
Table 94. Global Photoionization Sensors Sales (K Units) Forecast by Application (2025-2032)
Table 95. Global Photoionization Sensors Market Size Forecast by Application (2025-2032) & (M USD)
List of Figures
Figure 1. Product Picture of Photoionization Sensors
Figure 2. Data Triangulation
Figure 3. Key Caveats
Figure 4. Global Photoionization Sensors Market Size (M USD), 2019-2032
Figure 5. Global Photoionization Sensors Market Size (M USD) (2019-2032)
Figure 6. Global Photoionization Sensors Sales (K Units) & (2019-2032)
Figure 7. Evaluation Matrix of Segment Market Development Potential (Type)
Figure 8. Evaluation Matrix of Segment Market Development Potential (Application)
Figure 9. Evaluation Matrix of Regional Market Development Potential
Figure 10. Photoionization Sensors Market Size by Country (M USD)
Figure 11. Photoionization Sensors Sales Share by Manufacturers in 2023
Figure 12. Global Photoionization Sensors Revenue Share by Manufacturers in 2023
Figure 13. Photoionization Sensors Market Share by Company Type (Tier 1, Tier 2 and Tier 3): 2023
Figure 14. Global Market Photoionization Sensors Average Price (USD/Unit) of Key Manufacturers in 2023
Figure 15. The Global 5 and 10 Largest Players: Market Share by Photoionization Sensors Revenue in 2023
Figure 16. Evaluation Matrix of Segment Market Development Potential (Type)
Figure 17. Global Photoionization Sensors Market Share by Type
Figure 18. Sales Market Share of Photoionization Sensors by Type (2019-2025)
Figure 19. Sales Market Share of Photoionization Sensors by Type in 2023
Figure 20. Market Size Share of Photoionization Sensors by Type (2019-2025)
Figure 21. Market Size Market Share of Photoionization Sensors by Type in 2023
Figure 22. Evaluation Matrix of Segment Market Development Potential (Application)
Figure 23. Global Photoionization Sensors Market Share by Application
Figure 24. Global Photoionization Sensors Sales Market Share by Application (2019-2025)
Figure 25. Global Photoionization Sensors Sales Market Share by Application in 2023
Figure 26. Global Photoionization Sensors Market Share by Application (2019-2025)
Figure 27. Global Photoionization Sensors Market Share by Application in 2023
Figure 28. Global Photoionization Sensors Sales Growth Rate by Application (2019-2025)
Figure 29. Global Photoionization Sensors Sales Market Share by Region (2019-2025)
Figure 30. North America Photoionization Sensors Sales and Growth Rate (2019-2025) & (K Units)
Figure 31. North America Photoionization Sensors Sales Market Share by Country in 2023
Figure 32. U.S. Photoionization Sensors Sales and Growth Rate (2019-2025) & (K Units)
Figure 33. Canada Photoionization Sensors Sales (K Units) and Growth Rate (2019-2025)
Figure 34. Mexico Photoionization Sensors Sales (Units) and Growth Rate (2019-2025)
Figure 35. Europe Photoionization Sensors Sales and Growth Rate (2019-2025) & (K Units)
Figure 36. Europe Photoionization Sensors Sales Market Share by Country in 2023
Figure 37. Germany Photoionization Sensors Sales and Growth Rate (2019-2025) & (K Units)
Figure 38. France Photoionization Sensors Sales and Growth Rate (2019-2025) & (K Units)
Figure 39. U.K. Photoionization Sensors Sales and Growth Rate (2019-2025) & (K Units)
Figure 40. Italy Photoionization Sensors Sales and Growth Rate (2019-2025) & (K Units)
Figure 41. Russia Photoionization Sensors Sales and Growth Rate (2019-2025) & (K Units)
Figure 42. Asia Pacific Photoionization Sensors Sales and Growth Rate (K Units)
Figure 43. Asia Pacific Photoionization Sensors Sales Market Share by Region in 2023
Figure 44. China Photoionization Sensors Sales and Growth Rate (2019-2025) & (K Units)
Figure 45. Japan Photoionization Sensors Sales and Growth Rate (2019-2025) & (K Units)
Figure 46. South Korea Photoionization Sensors Sales and Growth Rate (2019-2025) & (K Units)
Figure 47. India Photoionization Sensors Sales and Growth Rate (2019-2025) & (K Units)
Figure 48. Southeast Asia Photoionization Sensors Sales and Growth Rate (2019-2025) & (K Units)
Figure 49. South America Photoionization Sensors Sales and Growth Rate (K Units)
Figure 50. South America Photoionization Sensors Sales Market Share by Country in 2023
Figure 51. Brazil Photoionization Sensors Sales and Growth Rate (2019-2025) & (K Units)
Figure 52. Argentina Photoionization Sensors Sales and Growth Rate (2019-2025) & (K Units)
Figure 53. Columbia Photoionization Sensors Sales and Growth Rate (2019-2025) & (K Units)
Figure 54. Middle East and Africa Photoionization Sensors Sales and Growth Rate (K Units)
Figure 55. Middle East and Africa Photoionization Sensors Sales Market Share by Region in 2023
Figure 56. Saudi Arabia Photoionization Sensors Sales and Growth Rate (2019-2025) & (K Units)
Figure 57. UAE Photoionization Sensors Sales and Growth Rate (2019-2025) & (K Units)
Figure 58. Egypt Photoionization Sensors Sales and Growth Rate (2019-2025) & (K Units)
Figure 59. Nigeria Photoionization Sensors Sales and Growth Rate (2019-2025) & (K Units)
Figure 60. South Africa Photoionization Sensors Sales and Growth Rate (2019-2025) & (K Units)
Figure 61. Global Photoionization Sensors Production Market Share by Region (2019-2025)
Figure 62. North America Photoionization Sensors Production (K Units) Growth Rate (2019-2025)
Figure 63. Europe Photoionization Sensors Production (K Units) Growth Rate (2019-2025)
Figure 64. Japan Photoionization Sensors Production (K Units) Growth Rate (2019-2025)
Figure 65. China Photoionization Sensors Production (K Units) Growth Rate (2019-2025)
Figure 66. Global Photoionization Sensors Sales Forecast by Volume (2019-2032) & (K Units)
Figure 67. Global Photoionization Sensors Market Size Forecast by Value (2019-2032) & (M USD)
Figure 68. Global Photoionization Sensors Sales Market Share Forecast by Type (2025-2032)
Figure 69. Global Photoionization Sensors Market Share Forecast by Type (2025-2032)
Figure 70. Global Photoionization Sensors Sales Forecast by Application (2025-2032)
Figure 71. Global Photoionization Sensors Market Share Forecast by Application (2025-2032)