Passive OLED Display Market Overview
OLEDs enable luminous, bright, thin, flexible and efficient displays.
This report provides a deep insight into the global Passive OLED Display market covering all its essential aspects. This ranges from a macro overview of the market to micro details of the market size, competitive landscape, development trend, niche market, key market drivers and challenges, SWOT analysis, value chain analysis, etc.
The analysis helps the reader to shape the competition within the industries and strategies for the competitive environment to enhance the potential profit. Furthermore, it provides a simple framework for evaluating and accessing the position of the business organization. The report structure also focuses on the competitive landscape of the Global Passive OLED Display Market, this report introduces in detail the market share, market performance, product situation, operation situation, etc. of the main players, which helps the readers in the industry to identify the main competitors and deeply understand the competition pattern of the market.
In a word, this report is a must-read for industry players, investors, researchers, consultants, business strategists, and all those who have any kind of stake or are planning to foray into the Passive OLED Display market in any manner.
Passive OLED Display Market Analysis:
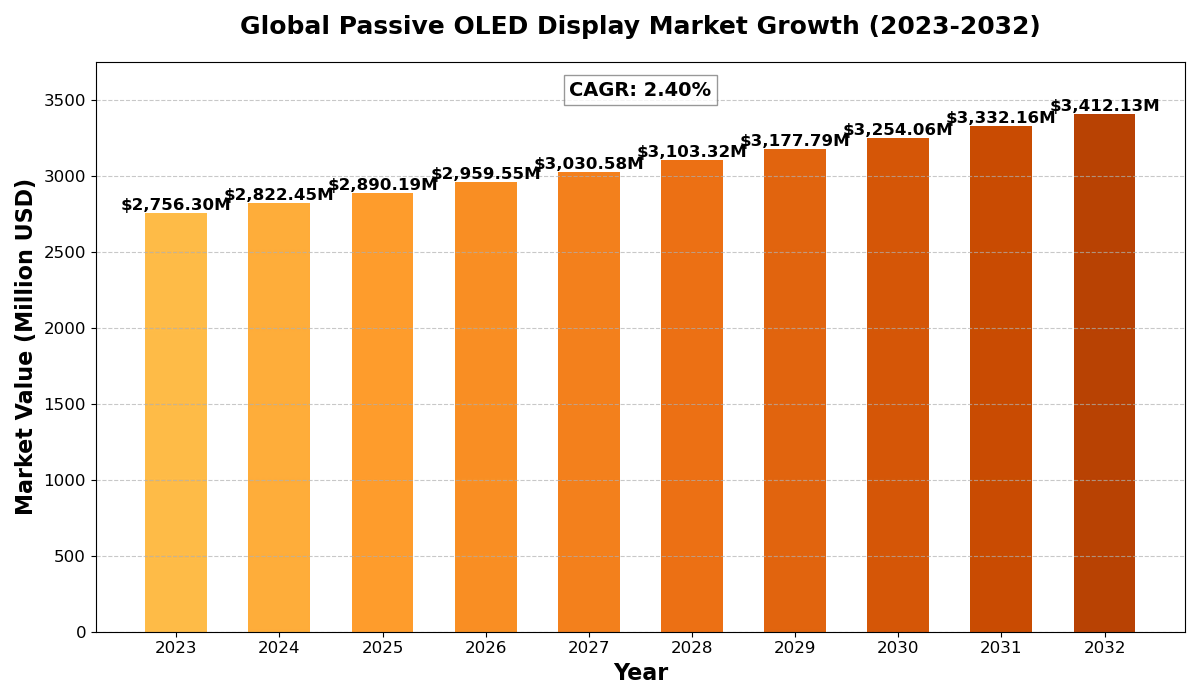
The Global Passive OLED Display Market size was estimated at USD 2756.30 million in 2023 and is projected to reach USD 3412.13 million by 2032, exhibiting a CAGR of 2.40% during the forecast period.
North America Passive OLED Display market size was estimated at USD 748.07 million in 2023, at a CAGR of 2.06% during the forecast period of 2025 through 2032.
Passive OLED Display Key Market Trends :
Rising Demand for Flexible Displays
The increasing need for flexible, thin, and lightweight display technologies is driving the adoption of Passive OLED displays. This trend is particularly prevalent in the consumer electronics sector, such as smartphones, wearables, and foldable devices.Integration in Automotive Applications
OLED displays are increasingly being integrated into automotive dashboards and infotainment systems, offering high-quality, energy-efficient displays for navigation, controls, and entertainment.Growth in OLED Lighting Solutions
Passive OLED technology is gaining traction in the lighting sector due to its energy efficiency and versatility in design. OLED lighting offers uniform, soft, and ambient lighting solutions for various applications.Improved Display Performance and Quality
Innovations in OLED technology have led to enhanced resolution, contrast ratios, and color accuracy. Passive OLED displays are offering a better viewing experience across multiple applications, from mobile devices to televisions.Focus on Sustainable and Energy-Efficient Solutions
As consumers and industries shift toward sustainability, OLED technology offers energy-efficient alternatives to traditional display technologies. Passive OLED displays consume less power, making them environmentally friendly.
Passive OLED Display Market Regional Analysis :

North America:
Strong demand driven by EVs, 5G infrastructure, and renewable energy, with the U.S. leading the market.
Europe:
Growth fueled by automotive electrification, renewable energy, and strong regulatory support, with Germany as a key player.
Asia-Pacific:
Dominates the market due to large-scale manufacturing in China and Japan, with growing demand from EVs, 5G, and semiconductors.
South America:
Emerging market, driven by renewable energy and EV adoption, with Brazil leading growth.
Middle East & Africa:
Gradual growth, mainly due to investments in renewable energy and EV infrastructure, with Saudi Arabia and UAE as key contributors.
Passive OLED Display Market Segmentation :
The research report includes specific segments by region (country), manufacturers, Type, and Application. Market segmentation creates subsets of a market based on product type, end-user or application, Geographic, and other factors. By understanding the market segments, the decision-maker can leverage this targeting in the product, sales, and marketing strategies. Market segments can power your product development cycles by informing how you create product offerings for different segments.
Key Company
- LG
- Beijing Oriental Electronics
- US Micro Produets
- Samsung
- Neoview Kolon
- Planar
- Hisense
- Sichuan CCO Display Technology
- SMD
- Visionox
Market Segmentation (by Type)
- Passive Matrix (PMOLED)
- Active Matrix (AMOLED)
Market Segmentation (by Application)
- Display Field
- Lighting Field
- Optical Medical Field
- Others
Market Drivers
Technological Advancements in OLED Manufacturing
Innovations in OLED manufacturing processes are reducing production costs and improving performance. These advancements make Passive OLED displays more affordable and accessible for various industries.Rising Demand in Consumer Electronics
The increasing demand for smartphones, smartwatches, and other electronic devices with high-quality, energy-efficient displays is driving the growth of the Passive OLED Display market.Advancement in Automotive Applications
With automotive companies seeking to enhance in-car experiences, Passive OLED displays are becoming increasingly popular for dashboards, infotainment systems, and digital instrument clusters.
Market Restraints
High Production Costs
While OLED technology is growing, the high manufacturing costs of Passive OLED displays remain a significant barrier to widespread adoption, particularly in cost-sensitive markets.Limited Lifespan of Passive OLED Displays
Compared to other display technologies, Passive OLED displays can degrade over time, particularly in terms of brightness and color consistency, which can deter long-term use in certain applications.Intense Competition from Other Display Technologies
Passive OLED displays face stiff competition from other display technologies like LCD and AMOLED, which offer comparable or superior performance at lower costs.
Market Opportunities
Expansion in Emerging Markets
As economies grow in regions like Asia-Pacific and South America, there is an increasing opportunity for Passive OLED displays to penetrate new markets, especially in consumer electronics and automotive sectors.Increased Use in Healthcare Applications
Passive OLED displays have significant potential in medical devices, including diagnostic equipment and wearable health tech, offering clear, energy-efficient displays for healthcare applications.Rising Demand for Wearables and Smart Devices
The surge in popularity of wearables and smart gadgets presents an opportunity for Passive OLED displays to become the standard display technology due to their thin, flexible, and low-power characteristics.
Market Challenges
Shortage of Raw Materials
The production of OLED displays depends on rare materials, such as indium and rare earth elements, whose limited availability can affect production capabilities and drive up costs.Consumer Perception of OLED Durability
Some consumers remain hesitant about adopting Passive OLED technology due to concerns over the longevity and durability of the displays, which can be affected by burn-in issues.Need for Further Research and Development
Continued research and development are essential to overcome technical challenges, improve display lifespan, and reduce production costs to increase competitiveness in the market.
Key Benefits of This Market Research:
- Industry drivers, restraints, and opportunities covered in the study
- Neutral perspective on the market performance
- Recent industry trends and developments
- Competitive landscape & strategies of key players
- Potential & niche segments and regions exhibiting promising growth covered
- Historical, current, and projected market size, in terms of value
- In-depth analysis of the Passive OLED Display Market
- Overview of the regional outlook of the Passive OLED Display Market:
Key Reasons to Buy this Report:
- Access to date statistics compiled by our researchers. These provide you with historical and forecast data, which is analyzed to tell you why your market is set to change
- This enables you to anticipate market changes to remain ahead of your competitors
- You will be able to copy data from the Excel spreadsheet straight into your marketing plans, business presentations, or other strategic documents
- The concise analysis, clear graph, and table format will enable you to pinpoint the information you require quickly
- Provision of market value data for each segment and sub-segment
- Indicates the region and segment that is expected to witness the fastest growth as well as to dominate the market
- Provides insight into the market through Value Chain
- Market dynamics scenario, along with growth opportunities of the market in the years to come
- 6-month post-sales analyst support
Customization of the Report
In case of any queries or customization requirements, please connect with our sales team, who will ensure that your requirements are met.
FAQs
Q: What are the key driving factors and opportunities in the Passive OLED Display market?
A: The key drivers include advancements in OLED manufacturing, the rising demand for flexible displays, and increased adoption in consumer electronics. Opportunities lie in expanding into emerging markets and the growing use of OLED displays in automotive and healthcare applications.
Q: Which region is projected to have the largest market share?
A: North America is projected to hold the largest market share, with the Passive OLED Display market in this region expected to reach USD 748.07 million in 2023, growing at a CAGR of 2.06% during the forecast period.
Q: Who are the top players in the global Passive OLED Display market?
A: The leading companies in the global Passive OLED Display market include LG, Beijing Oriental Electronics, Samsung, Neoview Kolon, and Hisense.
Q: What are the latest technological advancements in the industry?
A: Recent advancements include improvements in OLED manufacturing processes, enhancing display resolution, and the development of more flexible and energy-efficient OLED panels for a variety of applications.
Q: What is the current size of the global Passive OLED Display market?
A: The global Passive OLED Display market was valued at USD 2756.30 million in 2023 and is projected to reach USD 3412.13 million by 2032, growing at a CAGR of 2.40% during the forecast period.
Get Sample Report PDF for Exclusive Insights
Report Sample Includes
- Table of Contents
- List of Tables & Figures
- Charts, Research Methodology, and more...