nvSRAM Market Overview
Nonvolatile SRAM, shortly known as nvSRAM offers similar functionality as static RAM, but provides faster access times. Unlike battery backed SRAM, it enables data retrieval without a need for a battery making nvSRAM a suitable option for aerospace, networking and medical applications.
This report provides a deep insight into the global nvSRAM market covering all its essential aspects. This ranges from a macro overview of the market to micro details of the market size, competitive landscape, development trend, niche market, key market drivers and challenges, SWOT analysis, value chain analysis, etc.
The analysis helps the reader to shape the competition within the industries and strategies for the competitive environment to enhance the potential profit. Furthermore, it provides a simple framework for evaluating and accessing the position of the business organization. The report structure also focuses on the competitive landscape of the Global nvSRAM Market, this report introduces in detail the market share, market performance, product situation, operation situation, etc. of the main players, which helps the readers in the industry to identify the main competitors and deeply understand the competition pattern of the market.
In a word, this report is a must-read for industry players, investors, researchers, consultants, business strategists, and all those who have any kind of stake or are planning to foray into the nvSRAM market in any manner.
nvSRAM Market Analysis:
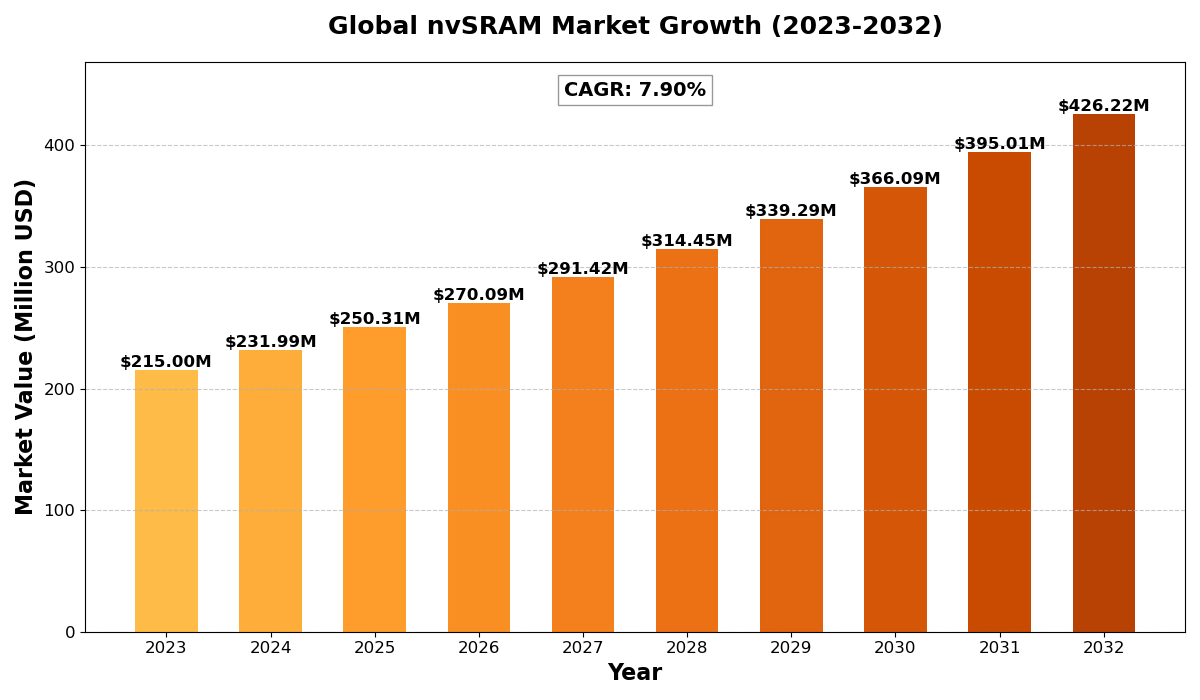
The Global nvSRAM Market size was estimated at USD 215 million in 2023 and is projected to reach USD 426.22 million by 2032, exhibiting a CAGR of 7.90% during the forecast period.
North America nvSRAM market size was estimated at USD 63.87 million in 2023, at a CAGR of 6.77% during the forecast period of 2025 through 2032.
nvSRAM Key Market Trends :
- Rising Demand in Aerospace and Defense
The increasing need for secure and reliable memory solutions in aerospace and defense applications is driving the adoption of nvSRAM. - Integration with AI and IoT Technologies
The demand for faster data storage in AI-driven and IoT applications is accelerating the adoption of nvSRAM for real-time processing. - Advancements in Automotive Electronics
The rising implementation of advanced driver-assistance systems (ADAS) and autonomous vehicles is propelling the demand for high-speed, nonvolatile memory. - Emerging Use in Medical Devices
nvSRAM’s ability to store critical medical data without power dependency is increasing its adoption in life-saving healthcare devices. - Market Consolidation and Strategic Alliances
Leading companies are focusing on mergers, acquisitions, and collaborations to enhance market presence and expand product portfolios.
nvSRAM Market Regional Analysis :

North America:
Strong demand driven by EVs, 5G infrastructure, and renewable energy, with the U.S. leading the market.
Europe:
Growth fueled by automotive electrification, renewable energy, and strong regulatory support, with Germany as a key player.
Asia-Pacific:
Dominates the market due to large-scale manufacturing in China and Japan, with growing demand from EVs, 5G, and semiconductors.
South America:
Emerging market, driven by renewable energy and EV adoption, with Brazil leading growth.
Middle East & Africa:
Gradual growth, mainly due to investments in renewable energy and EV infrastructure, with Saudi Arabia and UAE as key contributors.
nvSRAM Market Segmentation :
The research report includes specific segments by region (country), manufacturers, Type, and Application. Market segmentation creates subsets of a market based on product type, end-user or application, Geographic, and other factors. By understanding the market segments, the decision-maker can leverage this targeting in the product, sales, and marketing strategies. Market segments can power your product development cycles by informing how you create product offerings for different segments.
Key Company
- Cypress
- Infineon
- Fujitsu
- Texas Instruments
- IBM
- GSI
- Everspin Technologies
- Maxim
Market Segmentation (by Type)
- Serial Memory
- Parallel Memory
- Others
Market Segmentation (by Application)
- Networking
- Aerospace
- Medical
- Automotive Electronics
- Consumer Electronics
- Others
Market Drivers
- Growing Need for High-Performance Memory Solutions
The increasing demand for reliable, high-speed, and low-power memory in critical industries such as aerospace, defense, and healthcare is driving market growth. - Expanding IoT and AI Applications
The integration of nvSRAM with IoT and AI-based systems is fostering market expansion, particularly in real-time processing applications. - Rising Demand for Data Security and Retention
As data integrity becomes a major concern, the ability of nvSRAM to retain data without power makes it an attractive option for various industries.
Market Restraints
- High Manufacturing Costs
The complex fabrication process and high production costs pose a challenge to market adoption, particularly in price-sensitive industries. - Limited Awareness and Adoption
Many industries still rely on traditional SRAM or battery-backed memory solutions due to limited awareness of nvSRAM’s benefits. - Competition from Alternative Memory Technologies
Technologies like MRAM and FRAM offer similar benefits, creating competition in the nonvolatile memory market.
Market Opportunities
- Growing Adoption in Automotive Electronics
The automotive industry’s increasing focus on high-speed, nonvolatile memory for autonomous and connected vehicles presents significant growth opportunities. - Expansion in Emerging Economies
Rapid industrialization in regions like Asia-Pacific and the Middle East provides potential for increased nvSRAM adoption. - Innovation in Storage Technologies
Continuous R&D efforts are driving innovations that enhance the performance and efficiency of nvSRAM solutions.
Market Challenges
- Technical Limitations in High-Density Applications
While nvSRAM offers high speed, its capacity limitations restrict its use in high-density storage applications. - Complex Manufacturing Processes
The intricate design and fabrication processes make mass production and cost reduction challenging. - Intense Market Competition
The presence of well-established memory technologies creates a highly competitive market, requiring continuous innovation.
Key Benefits of This Market Research:
- Industry drivers, restraints, and opportunities covered in the study
- Neutral perspective on the market performance
- Recent industry trends and developments
- Competitive landscape & strategies of key players
- Potential & niche segments and regions exhibiting promising growth covered
- Historical, current, and projected market size, in terms of value
- In-depth analysis of the nvSRAM Market
- Overview of the regional outlook of the nvSRAM Market:
Key Reasons to Buy this Report:
- Access to date statistics compiled by our researchers. These provide you with historical and forecast data, which is analyzed to tell you why your market is set to change
- This enables you to anticipate market changes to remain ahead of your competitors
- You will be able to copy data from the Excel spreadsheet straight into your marketing plans, business presentations, or other strategic documents
- The concise analysis, clear graph, and table format will enable you to pinpoint the information you require quickly
- Provision of market value data for each segment and sub-segment
- Indicates the region and segment that is expected to witness the fastest growth as well as to dominate the market
- Provides insight into the market through Value Chain
- Market dynamics scenario, along with growth opportunities of the market in the years to come
- 6-month post-sales analyst support
Customization of the Report
In case of any queries or customization requirements, please connect with our sales team, who will ensure that your requirements are met.
FAQs
Q: What are the key driving factors and opportunities in the nvSRAM market?
A: The key driving factors include the rising demand for high-speed, nonvolatile memory in aerospace, medical, and automotive sectors. Opportunities exist in expanding IoT applications, AI-driven processing, and growing adoption in autonomous vehicles.
Q: Which region is projected to have the largest market share?
A: North America is expected to dominate the nvSRAM market due to its advanced aerospace, defense, and semiconductor industries, followed closely by the Asia-Pacific region, which is experiencing rapid technological advancements.
Q: Who are the top players in the global nvSRAM market?
A: Leading companies include Cypress (Infineon), Fujitsu, Texas Instruments, IBM, GSI, Everspin Technologies, and Maxim, all of which contribute to market growth through innovation and strategic collaborations.
Q: What are the latest technological advancements in the industry?
A: Recent advancements include the integration of nvSRAM with AI and IoT applications, improved power efficiency, and enhanced memory architectures to support high-speed data retention and processing.
Q: What is the current size of the global nvSRAM market?
A: The global nvSRAM market was valued at USD 215 million in 2023 and is projected to reach USD 426.22 million by 2032, with a CAGR of 7.90% during the forecast period.
Get Sample Report PDF for Exclusive Insights
Report Sample Includes
- Table of Contents
- List of Tables & Figures
- Charts, Research Methodology, and more...

