Global Niobium Superconducting Cavity Market, Trends, Business Strategies 2025-2032

Global Niobium Superconducting Cavity market size was estimated at USD 33 million in 2023 and is projected to reach USD 68.20 million by 2032, exhibiting a CAGR of 8.40% during the forecast period

PDF Icon Download Sample Report PDF
  • Quick Dispatch

    All Orders

  • Secure Payment

    100% Secure Payment

Compare

$1,500.00$4,250.00

Clear

Niobium Superconducting Cavity Market Overview

Niobium is the favorite metal for the fabrication of superconducting accelerating cavities. While the majority of these cavities are formed from niobium sheet material a large number of copper cavities have been made with a thin niobium film on the inner surface produced by sputter coating.

This report provides a deep insight into the global Niobium Superconducting Cavity market covering all its essential aspects. This ranges from a macro overview of the market to micro details of the market size, competitive landscape, development trend, niche market, key market drivers and challenges, SWOT analysis, value chain analysis, etc.

The analysis helps the reader to shape the competition within the industries and strategies for the competitive environment to enhance the potential profit. Furthermore, it provides a simple framework for evaluating and accessing the position of the business organization. The report structure also focuses on the competitive landscape of the Global Niobium Superconducting Cavity Market, this report introduces in detail the market share, market performance, product situation, operation situation, etc. of the main players, which helps the readers in the industry to identify the main competitors and deeply understand the competition pattern of the market.
In a word, this report is a must-read for industry players, investors, researchers, consultants, business strategists, and all those who have any kind of stake or are planning to foray into the Niobium Superconducting Cavity market in any manner.

Niobium Superconducting Cavity Market Analysis:

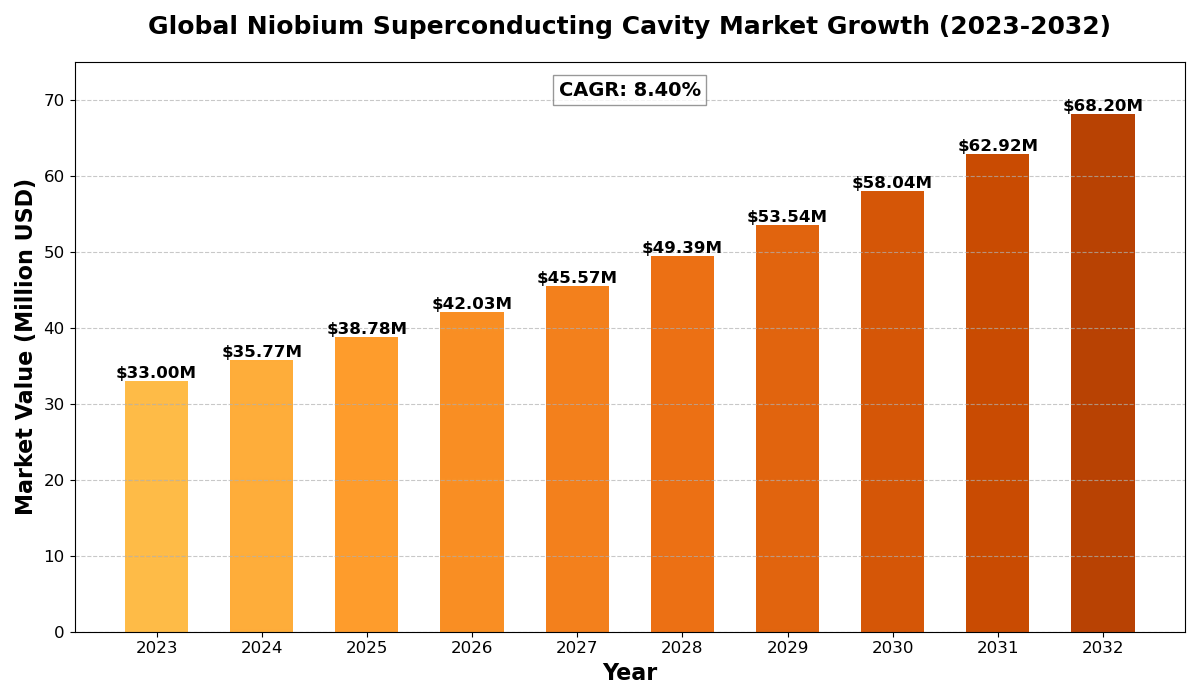
The Global Niobium Superconducting Cavity Market size was estimated at USD 33 million in 2023 and is projected to reach USD 68.20 million by 2032, exhibiting a CAGR of 8.40% during the forecast period.

North America Niobium Superconducting Cavity market size was estimated at USD 9.88 million in 2023, at a CAGR of 7.20% during the forecast period of 2025 through 2032.


Niobium Superconducting Cavity Key Market Trends  

  1. Growing Adoption in Particle Accelerators
    The rising investments in high-energy physics research are boosting demand for niobium superconducting cavities. These cavities are crucial for enhancing particle accelerator performance, making them a key part of modern physics experiments.

  2. Advancements in Superconducting Technology
    Innovations in material purity and fabrication techniques are driving improvements in cavity efficiency and performance. This results in more reliable and efficient systems for various applications.

  3. Expansion of Quantum Computing Applications
    As interest in quantum computing rises, niobium superconducting cavities are increasingly being used in quantum technology. These cavities play a significant role in supporting the stability and performance of quantum processors.

  4. Growing Demand in Energy Storage Systems
    Niobium superconducting cavities are finding applications in energy storage systems, such as superconducting magnetic energy storage (SMES). This trend is being fueled by the growing need for efficient energy solutions.

  5. Increased Use in Telecommunication Infrastructure
    Niobium-based superconducting cavities are gaining popularity in advanced telecommunication systems, especially in 5G networks. These technologies benefit from niobium’s superconducting properties, which help improve transmission efficiency.

Niobium Superconducting Cavity Market Regional Analysis :

semi insight

  • North America:Strong demand driven by EVs, 5G infrastructure, and renewable energy, with the U.S. leading the market.
  • Europe:Growth fueled by automotive electrification, renewable energy, and strong regulatory support, with Germany as a key player.
  • Asia-Pacific:Dominates the market due to large-scale manufacturing in China and Japan, with growing demand from EVs, 5G, and semiconductors.
  • South America:Emerging market, driven by renewable energy and EV adoption, with Brazil leading growth.
  • Middle East & Africa:Gradual growth, mainly due to investments in renewable energy and EV infrastructure, with Saudi Arabia and UAE as key contributors.

Niobium Superconducting Cavity Market Segmentation

The research report includes specific segments by region (country), manufacturers, Type, and Application. Market segmentation creates subsets of a market based on product type, end-user or application, Geographic, and other factors. By understanding the market segments, the decision-maker can leverage this targeting in the product, sales, and marketing strategies. Market segments can power your product development cycles by informing how you create product offerings for different segments.
Key Company

  • RI Research Instruments GmbH
  • Ningxia Orient Tantalum Industry Co.,Ltd
  • Zanon Research & Innovation Srl

Market Segmentation (by Type)

  • Pure Niobium Superconducting Cavity
  • Niobium Tritin Superconducting Cavity

Market Segmentation (by Application)

  • Particle Accelerator
  • Science Research

Drivers

  • Rising Government Funding for Scientific Research – Governments worldwide are investing in large-scale research projects, including accelerator-based studies.
  • Advancements in High-Energy Physics Experiments – The development of next-generation particle colliders is boosting the need for high-quality superconducting cavities.
  • Growing Demand for Medical and Industrial Applications – Superconducting radio-frequency (SRF) cavities are being increasingly used in medical imaging and industrial processing.

Restraints

  • High Production and Processing Costs – The complex fabrication and ultra-high purity requirements make niobium superconducting cavities expensive.
  • Technical Challenges in Cryogenic Cooling – Maintaining ultra-low temperatures for superconductivity remains a significant operational challenge.
  • Limited Commercial Adoption Beyond Research – Most applications are restricted to research institutions and specialized industries, limiting widespread market penetration.

Opportunities

  • Integration with Quantum Computing Technologies – Advancements in superconducting qubit research present new market opportunities for niobium cavities.
  • Expansion into Medical Imaging and Treatment – Emerging applications in MRI machines and proton therapy for cancer treatment can drive future demand.
  • Collaborations Between Research Institutions and Industry Players – Increased partnerships for technology development can accelerate commercialization efforts.

Challenges

  • Material Supply Chain Constraints – Limited sources of high-purity niobium may impact production scalability.
  • Competition from Alternative Superconducting Materials – Research into other superconducting materials could pose a challenge to niobium-based solutions.
  • Complex Manufacturing Processes – Achieving defect-free superconducting cavities requires precision engineering, which can be time-consuming and costly.

Key Benefits of This Market Research:

  • Industry drivers, restraints, and opportunities covered in the study
  • Neutral perspective on the market performance
  • Recent industry trends and developments
  • Competitive landscape & strategies of key players
  • Potential & niche segments and regions exhibiting promising growth covered
  • Historical, current, and projected market size, in terms of value
  • In-depth analysis of the Niobium Superconducting Cavity Market
  • Overview of the regional outlook of the Niobium Superconducting Cavity Market:

Key Reasons to Buy this Report:

  • Access to date statistics compiled by our researchers. These provide you with historical and forecast data, which is analyzed to tell you why your market is set to change
  • This enables you to anticipate market changes to remain ahead of your competitors
  • You will be able to copy data from the Excel spreadsheet straight into your marketing plans, business presentations, or other strategic documents
  • The concise analysis, clear graph, and table format will enable you to pinpoint the information you require quickly
  • Provision of market value data for each segment and sub-segment
  • Indicates the region and segment that is expected to witness the fastest growth as well as to dominate the market
  • Provides insight into the market through Value Chain
  • Market dynamics scenario, along with growth opportunities of the market in the years to come
  • 6-month post-sales analyst support

Customization of the Report
In case of any queries or customization requirements, please connect with our sales team, who will ensure that your requirements are met.


FAQs


Q1: What are the key driving factors and opportunities in the Niobium Superconducting Cavity market?
A1: Key driving factors include advancements in research & development, growing need for energy efficiency, and the rising demand for quantum computing. Opportunities include expansion in emerging markets, collaboration with the quantum computing industry, and integration into renewable energy solutions.


Q2: Which region is projected to have the largest market share in the Niobium Superconducting Cavity market?
A2: North America is expected to hold the largest market share due to strong demand from industries like particle accelerators, energy storage, and quantum computing, with the U.S. leading the market.


Q3: Who are the top players in the global Niobium Superconducting Cavity market?
A3: Key players in the market include RI Research Instruments GmbH, Ningxia Orient Tantalum Industry Co., Ltd, and Zanon Research & Innovation Srl, which are major contributors to the development of niobium superconducting cavity technologies.


Q4: What are the latest technological advancements in the Niobium Superconducting Cavity market?
A4: Recent advancements include improvements in material purity, innovative fabrication techniques, and better cavity efficiency. These innovations are enhancing performance in applications like particle accelerators and quantum computing.


Q5: What is the current size of the global Niobium Superconducting Cavity market?
A5: The global Niobium Superconducting Cavity market size was valued at USD 33 million in 2023 and is projected to reach USD 68.20 million by 2032, with a CAGR of 8.40% during the forecast period.

Global Niobium Superconducting Cavity Market, Trends, Business Strategies 2025-2032

Get Sample Report PDF for Exclusive Insights

Report Sample Includes

  • Table of Contents
  • List of Tables & Figures
  • Charts, Research Methodology, and more...
PDF Icon Download Sample Report PDF

Download Sample Report

Table of Content

Table of Contents
1 Research Methodology and Statistical Scope
1.1 Market Definition and Statistical Scope of Niobium Superconducting Cavity
1.2 Key Market Segments
1.2.1 Niobium Superconducting Cavity Segment by Type
1.2.2 Niobium Superconducting Cavity Segment by Application
1.3 Methodology & Sources of Information
1.3.1 Research Methodology
1.3.2 Research Process
1.3.3 Market Breakdown and Data Triangulation
1.3.4 Base Year
1.3.5 Report Assumptions & Caveats
2 Niobium Superconducting Cavity Market Overview
2.1 Global Market Overview
2.1.1 Global Niobium Superconducting Cavity Market Size (M USD) Estimates and Forecasts (2019-2032)
2.1.2 Global Niobium Superconducting Cavity Sales Estimates and Forecasts (2019-2032)
2.2 Market Segment Executive Summary
2.3 Global Market Size by Region
3 Niobium Superconducting Cavity Market Competitive Landscape
3.1 Global Niobium Superconducting Cavity Sales by Manufacturers (2019-2025)
3.2 Global Niobium Superconducting Cavity Revenue Market Share by Manufacturers (2019-2025)
3.3 Niobium Superconducting Cavity Market Share by Company Type (Tier 1, Tier 2, and Tier 3)
3.4 Global Niobium Superconducting Cavity Average Price by Manufacturers (2019-2025)
3.5 Manufacturers Niobium Superconducting Cavity Sales Sites, Area Served, Product Type
3.6 Niobium Superconducting Cavity Market Competitive Situation and Trends
3.6.1 Niobium Superconducting Cavity Market Concentration Rate
3.6.2 Global 5 and 10 Largest Niobium Superconducting Cavity Players Market Share by Revenue
3.6.3 Mergers & Acquisitions, Expansion
4 Niobium Superconducting Cavity Industry Chain Analysis
4.1 Niobium Superconducting Cavity Industry Chain Analysis
4.2 Market Overview of Key Raw Materials
4.3 Midstream Market Analysis
4.4 Downstream Customer Analysis
5 The Development and Dynamics of Niobium Superconducting Cavity Market
5.1 Key Development Trends
5.2 Driving Factors
5.3 Market Challenges
5.4 Market Restraints
5.5 Industry News
5.5.1 New Product Developments
5.5.2 Mergers & Acquisitions
5.5.3 Expansions
5.5.4 Collaboration/Supply Contracts
5.6 Industry Policies
6 Niobium Superconducting Cavity Market Segmentation by Type
6.1 Evaluation Matrix of Segment Market Development Potential (Type)
6.2 Global Niobium Superconducting Cavity Sales Market Share by Type (2019-2025)
6.3 Global Niobium Superconducting Cavity Market Size Market Share by Type (2019-2025)
6.4 Global Niobium Superconducting Cavity Price by Type (2019-2025)
7 Niobium Superconducting Cavity Market Segmentation by Application
7.1 Evaluation Matrix of Segment Market Development Potential (Application)
7.2 Global Niobium Superconducting Cavity Market Sales by Application (2019-2025)
7.3 Global Niobium Superconducting Cavity Market Size (M USD) by Application (2019-2025)
7.4 Global Niobium Superconducting Cavity Sales Growth Rate by Application (2019-2025)
8 Niobium Superconducting Cavity Market Consumption by Region
8.1 Global Niobium Superconducting Cavity Sales by Region
8.1.1 Global Niobium Superconducting Cavity Sales by Region
8.1.2 Global Niobium Superconducting Cavity Sales Market Share by Region
8.2 North America
8.2.1 North America Niobium Superconducting Cavity Sales by Country
8.2.2 U.S.
8.2.3 Canada
8.2.4 Mexico
8.3 Europe
8.3.1 Europe Niobium Superconducting Cavity Sales by Country
8.3.2 Germany
8.3.3 France
8.3.4 U.K.
8.3.5 Italy
8.3.6 Russia
8.4 Asia Pacific
8.4.1 Asia Pacific Niobium Superconducting Cavity Sales by Region
8.4.2 China
8.4.3 Japan
8.4.4 South Korea
8.4.5 India
8.4.6 Southeast Asia
8.5 South America
8.5.1 South America Niobium Superconducting Cavity Sales by Country
8.5.2 Brazil
8.5.3 Argentina
8.5.4 Columbia
8.6 Middle East and Africa
8.6.1 Middle East and Africa Niobium Superconducting Cavity Sales by Region
8.6.2 Saudi Arabia
8.6.3 UAE
8.6.4 Egypt
8.6.5 Nigeria
8.6.6 South Africa
9 Niobium Superconducting Cavity Market Production by Region
9.1 Global Production of Niobium Superconducting Cavity by Region (2019-2025)
9.2 Global Niobium Superconducting Cavity Revenue Market Share by Region (2019-2025)
9.3 Global Niobium Superconducting Cavity Production, Revenue, Price and Gross Margin (2019-2025)
9.4 North America Niobium Superconducting Cavity Production
9.4.1 North America Niobium Superconducting Cavity Production Growth Rate (2019-2025)
9.4.2 North America Niobium Superconducting Cavity Production, Revenue, Price and Gross Margin (2019-2025)
9.5 Europe Niobium Superconducting Cavity Production
9.5.1 Europe Niobium Superconducting Cavity Production Growth Rate (2019-2025)
9.5.2 Europe Niobium Superconducting Cavity Production, Revenue, Price and Gross Margin (2019-2025)
9.6 Japan Niobium Superconducting Cavity Production (2019-2025)
9.6.1 Japan Niobium Superconducting Cavity Production Growth Rate (2019-2025)
9.6.2 Japan Niobium Superconducting Cavity Production, Revenue, Price and Gross Margin (2019-2025)
9.7 China Niobium Superconducting Cavity Production (2019-2025)
9.7.1 China Niobium Superconducting Cavity Production Growth Rate (2019-2025)
9.7.2 China Niobium Superconducting Cavity Production, Revenue, Price and Gross Margin (2019-2025)
10 Key Companies Profile
10.1 RI Research Instruments GmbH
10.1.1 RI Research Instruments GmbH Niobium Superconducting Cavity Basic Information
10.1.2 RI Research Instruments GmbH Niobium Superconducting Cavity Product Overview
10.1.3 RI Research Instruments GmbH Niobium Superconducting Cavity Product Market Performance
10.1.4 RI Research Instruments GmbH Business Overview
10.1.5 RI Research Instruments GmbH Niobium Superconducting Cavity SWOT Analysis
10.1.6 RI Research Instruments GmbH Recent Developments
10.2 Ningxia Orient Tantalum Industry Co.,Ltd
10.2.1 Ningxia Orient Tantalum Industry Co.,Ltd Niobium Superconducting Cavity Basic Information
10.2.2 Ningxia Orient Tantalum Industry Co.,Ltd Niobium Superconducting Cavity Product Overview
10.2.3 Ningxia Orient Tantalum Industry Co.,Ltd Niobium Superconducting Cavity Product Market Performance
10.2.4 Ningxia Orient Tantalum Industry Co.,Ltd Business Overview
10.2.5 Ningxia Orient Tantalum Industry Co.,Ltd Niobium Superconducting Cavity SWOT Analysis
10.2.6 Ningxia Orient Tantalum Industry Co.,Ltd Recent Developments
10.3 Zanon Research and Innovation Srl
10.3.1 Zanon Research and Innovation Srl Niobium Superconducting Cavity Basic Information
10.3.2 Zanon Research and Innovation Srl Niobium Superconducting Cavity Product Overview
10.3.3 Zanon Research and Innovation Srl Niobium Superconducting Cavity Product Market Performance
10.3.4 Zanon Research and Innovation Srl Niobium Superconducting Cavity SWOT Analysis
10.3.5 Zanon Research and Innovation Srl Business Overview
10.3.6 Zanon Research and Innovation Srl Recent Developments
11 Niobium Superconducting Cavity Market Forecast by Region
11.1 Global Niobium Superconducting Cavity Market Size Forecast
11.2 Global Niobium Superconducting Cavity Market Forecast by Region
11.2.1 North America Market Size Forecast by Country
11.2.2 Europe Niobium Superconducting Cavity Market Size Forecast by Country
11.2.3 Asia Pacific Niobium Superconducting Cavity Market Size Forecast by Region
11.2.4 South America Niobium Superconducting Cavity Market Size Forecast by Country
11.2.5 Middle East and Africa Forecasted Consumption of Niobium Superconducting Cavity by Country
12 Forecast Market by Type and by Application (2025-2032)
12.1 Global Niobium Superconducting Cavity Market Forecast by Type (2025-2032)
12.1.1 Global Forecasted Sales of Niobium Superconducting Cavity by Type (2025-2032)
12.1.2 Global Niobium Superconducting Cavity Market Size Forecast by Type (2025-2032)
12.1.3 Global Forecasted Price of Niobium Superconducting Cavity by Type (2025-2032)
12.2 Global Niobium Superconducting Cavity Market Forecast by Application (2025-2032)
12.2.1 Global Niobium Superconducting Cavity Sales (K Units) Forecast by Application
12.2.2 Global Niobium Superconducting Cavity Market Size (M USD) Forecast by Application (2025-2032)
13 Conclusion and Key FindingsList of Tables
Table 1. Introduction of the Type
Table 2. Introduction of the Application
Table 3. Market Size (M USD) Segment Executive Summary
Table 4. Niobium Superconducting Cavity Market Size Comparison by Region (M USD)
Table 5. Global Niobium Superconducting Cavity Sales (K Units) by Manufacturers (2019-2025)
Table 6. Global Niobium Superconducting Cavity Sales Market Share by Manufacturers (2019-2025)
Table 7. Global Niobium Superconducting Cavity Revenue (M USD) by Manufacturers (2019-2025)
Table 8. Global Niobium Superconducting Cavity Revenue Share by Manufacturers (2019-2025)
Table 9. Company Type (Tier 1, Tier 2, and Tier 3) & (based on the Revenue in Niobium Superconducting Cavity as of 2022)
Table 10. Global Market Niobium Superconducting Cavity Average Price (USD/Unit) of Key Manufacturers (2019-2025)
Table 11. Manufacturers Niobium Superconducting Cavity Sales Sites and Area Served
Table 12. Manufacturers Niobium Superconducting Cavity Product Type
Table 13. Global Niobium Superconducting Cavity Manufacturers Market Concentration Ratio (CR5 and HHI)
Table 14. Mergers & Acquisitions, Expansion Plans
Table 15. Industry Chain Map of Niobium Superconducting Cavity
Table 16. Market Overview of Key Raw Materials
Table 17. Midstream Market Analysis
Table 18. Downstream Customer Analysis
Table 19. Key Development Trends
Table 20. Driving Factors
Table 21. Niobium Superconducting Cavity Market Challenges
Table 22. Global Niobium Superconducting Cavity Sales by Type (K Units)
Table 23. Global Niobium Superconducting Cavity Market Size by Type (M USD)
Table 24. Global Niobium Superconducting Cavity Sales (K Units) by Type (2019-2025)
Table 25. Global Niobium Superconducting Cavity Sales Market Share by Type (2019-2025)
Table 26. Global Niobium Superconducting Cavity Market Size (M USD) by Type (2019-2025)
Table 27. Global Niobium Superconducting Cavity Market Size Share by Type (2019-2025)
Table 28. Global Niobium Superconducting Cavity Price (USD/Unit) by Type (2019-2025)
Table 29. Global Niobium Superconducting Cavity Sales (K Units) by Application
Table 30. Global Niobium Superconducting Cavity Market Size by Application
Table 31. Global Niobium Superconducting Cavity Sales by Application (2019-2025) & (K Units)
Table 32. Global Niobium Superconducting Cavity Sales Market Share by Application (2019-2025)
Table 33. Global Niobium Superconducting Cavity Sales by Application (2019-2025) & (M USD)
Table 34. Global Niobium Superconducting Cavity Market Share by Application (2019-2025)
Table 35. Global Niobium Superconducting Cavity Sales Growth Rate by Application (2019-2025)
Table 36. Global Niobium Superconducting Cavity Sales by Region (2019-2025) & (K Units)
Table 37. Global Niobium Superconducting Cavity Sales Market Share by Region (2019-2025)
Table 38. North America Niobium Superconducting Cavity Sales by Country (2019-2025) & (K Units)
Table 39. Europe Niobium Superconducting Cavity Sales by Country (2019-2025) & (K Units)
Table 40. Asia Pacific Niobium Superconducting Cavity Sales by Region (2019-2025) & (K Units)
Table 41. South America Niobium Superconducting Cavity Sales by Country (2019-2025) & (K Units)
Table 42. Middle East and Africa Niobium Superconducting Cavity Sales by Region (2019-2025) & (K Units)
Table 43. Global Niobium Superconducting Cavity Production (K Units) by Region (2019-2025)
Table 44. Global Niobium Superconducting Cavity Revenue (US$ Million) by Region (2019-2025)
Table 45. Global Niobium Superconducting Cavity Revenue Market Share by Region (2019-2025)
Table 46. Global Niobium Superconducting Cavity Production (K Units), Revenue (US$ Million), Price (USD/Unit) and Gross Margin (2019-2025)
Table 47. North America Niobium Superconducting Cavity Production (K Units), Revenue (US$ Million), Price (USD/Unit) and Gross Margin (2019-2025)
Table 48. Europe Niobium Superconducting Cavity Production (K Units), Revenue (US$ Million), Price (USD/Unit) and Gross Margin (2019-2025)
Table 49. Japan Niobium Superconducting Cavity Production (K Units), Revenue (US$ Million), Price (USD/Unit) and Gross Margin (2019-2025)
Table 50. China Niobium Superconducting Cavity Production (K Units), Revenue (US$ Million), Price (USD/Unit) and Gross Margin (2019-2025)
Table 51. RI Research Instruments GmbH Niobium Superconducting Cavity Basic Information
Table 52. RI Research Instruments GmbH Niobium Superconducting Cavity Product Overview
Table 53. RI Research Instruments GmbH Niobium Superconducting Cavity Sales (K Units), Revenue (M USD), Price (USD/Unit) and Gross Margin (2019-2025)
Table 54. RI Research Instruments GmbH Business Overview
Table 55. RI Research Instruments GmbH Niobium Superconducting Cavity SWOT Analysis
Table 56. RI Research Instruments GmbH Recent Developments
Table 57. Ningxia Orient Tantalum Industry Co.,Ltd Niobium Superconducting Cavity Basic Information
Table 58. Ningxia Orient Tantalum Industry Co.,Ltd Niobium Superconducting Cavity Product Overview
Table 59. Ningxia Orient Tantalum Industry Co.,Ltd Niobium Superconducting Cavity Sales (K Units), Revenue (M USD), Price (USD/Unit) and Gross Margin (2019-2025)
Table 60. Ningxia Orient Tantalum Industry Co.,Ltd Business Overview
Table 61. Ningxia Orient Tantalum Industry Co.,Ltd Niobium Superconducting Cavity SWOT Analysis
Table 62. Ningxia Orient Tantalum Industry Co.,Ltd Recent Developments
Table 63. Zanon Research and Innovation Srl Niobium Superconducting Cavity Basic Information
Table 64. Zanon Research and Innovation Srl Niobium Superconducting Cavity Product Overview
Table 65. Zanon Research and Innovation Srl Niobium Superconducting Cavity Sales (K Units), Revenue (M USD), Price (USD/Unit) and Gross Margin (2019-2025)
Table 66. Zanon Research and Innovation Srl Niobium Superconducting Cavity SWOT Analysis
Table 67. Zanon Research and Innovation Srl Business Overview
Table 68. Zanon Research and Innovation Srl Recent Developments
Table 69. Global Niobium Superconducting Cavity Sales Forecast by Region (2025-2032) & (K Units)
Table 70. Global Niobium Superconducting Cavity Market Size Forecast by Region (2025-2032) & (M USD)
Table 71. North America Niobium Superconducting Cavity Sales Forecast by Country (2025-2032) & (K Units)
Table 72. North America Niobium Superconducting Cavity Market Size Forecast by Country (2025-2032) & (M USD)
Table 73. Europe Niobium Superconducting Cavity Sales Forecast by Country (2025-2032) & (K Units)
Table 74. Europe Niobium Superconducting Cavity Market Size Forecast by Country (2025-2032) & (M USD)
Table 75. Asia Pacific Niobium Superconducting Cavity Sales Forecast by Region (2025-2032) & (K Units)
Table 76. Asia Pacific Niobium Superconducting Cavity Market Size Forecast by Region (2025-2032) & (M USD)
Table 77. South America Niobium Superconducting Cavity Sales Forecast by Country (2025-2032) & (K Units)
Table 78. South America Niobium Superconducting Cavity Market Size Forecast by Country (2025-2032) & (M USD)
Table 79. Middle East and Africa Niobium Superconducting Cavity Consumption Forecast by Country (2025-2032) & (Units)
Table 80. Middle East and Africa Niobium Superconducting Cavity Market Size Forecast by Country (2025-2032) & (M USD)
Table 81. Global Niobium Superconducting Cavity Sales Forecast by Type (2025-2032) & (K Units)
Table 82. Global Niobium Superconducting Cavity Market Size Forecast by Type (2025-2032) & (M USD)
Table 83. Global Niobium Superconducting Cavity Price Forecast by Type (2025-2032) & (USD/Unit)
Table 84. Global Niobium Superconducting Cavity Sales (K Units) Forecast by Application (2025-2032)
Table 85. Global Niobium Superconducting Cavity Market Size Forecast by Application (2025-2032) & (M USD)
List of Figures
Figure 1. Product Picture of Niobium Superconducting Cavity
Figure 2. Data Triangulation
Figure 3. Key Caveats
Figure 4. Global Niobium Superconducting Cavity Market Size (M USD), 2019-2032
Figure 5. Global Niobium Superconducting Cavity Market Size (M USD) (2019-2032)
Figure 6. Global Niobium Superconducting Cavity Sales (K Units) & (2019-2032)
Figure 7. Evaluation Matrix of Segment Market Development Potential (Type)
Figure 8. Evaluation Matrix of Segment Market Development Potential (Application)
Figure 9. Evaluation Matrix of Regional Market Development Potential
Figure 10. Niobium Superconducting Cavity Market Size by Country (M USD)
Figure 11. Niobium Superconducting Cavity Sales Share by Manufacturers in 2023
Figure 12. Global Niobium Superconducting Cavity Revenue Share by Manufacturers in 2023
Figure 13. Niobium Superconducting Cavity Market Share by Company Type (Tier 1, Tier 2 and Tier 3): 2023
Figure 14. Global Market Niobium Superconducting Cavity Average Price (USD/Unit) of Key Manufacturers in 2023
Figure 15. The Global 5 and 10 Largest Players: Market Share by Niobium Superconducting Cavity Revenue in 2023
Figure 16. Evaluation Matrix of Segment Market Development Potential (Type)
Figure 17. Global Niobium Superconducting Cavity Market Share by Type
Figure 18. Sales Market Share of Niobium Superconducting Cavity by Type (2019-2025)
Figure 19. Sales Market Share of Niobium Superconducting Cavity by Type in 2023
Figure 20. Market Size Share of Niobium Superconducting Cavity by Type (2019-2025)
Figure 21. Market Size Market Share of Niobium Superconducting Cavity by Type in 2023
Figure 22. Evaluation Matrix of Segment Market Development Potential (Application)
Figure 23. Global Niobium Superconducting Cavity Market Share by Application
Figure 24. Global Niobium Superconducting Cavity Sales Market Share by Application (2019-2025)
Figure 25. Global Niobium Superconducting Cavity Sales Market Share by Application in 2023
Figure 26. Global Niobium Superconducting Cavity Market Share by Application (2019-2025)
Figure 27. Global Niobium Superconducting Cavity Market Share by Application in 2023
Figure 28. Global Niobium Superconducting Cavity Sales Growth Rate by Application (2019-2025)
Figure 29. Global Niobium Superconducting Cavity Sales Market Share by Region (2019-2025)
Figure 30. North America Niobium Superconducting Cavity Sales and Growth Rate (2019-2025) & (K Units)
Figure 31. North America Niobium Superconducting Cavity Sales Market Share by Country in 2023
Figure 32. U.S. Niobium Superconducting Cavity Sales and Growth Rate (2019-2025) & (K Units)
Figure 33. Canada Niobium Superconducting Cavity Sales (K Units) and Growth Rate (2019-2025)
Figure 34. Mexico Niobium Superconducting Cavity Sales (Units) and Growth Rate (2019-2025)
Figure 35. Europe Niobium Superconducting Cavity Sales and Growth Rate (2019-2025) & (K Units)
Figure 36. Europe Niobium Superconducting Cavity Sales Market Share by Country in 2023
Figure 37. Germany Niobium Superconducting Cavity Sales and Growth Rate (2019-2025) & (K Units)
Figure 38. France Niobium Superconducting Cavity Sales and Growth Rate (2019-2025) & (K Units)
Figure 39. U.K. Niobium Superconducting Cavity Sales and Growth Rate (2019-2025) & (K Units)
Figure 40. Italy Niobium Superconducting Cavity Sales and Growth Rate (2019-2025) & (K Units)
Figure 41. Russia Niobium Superconducting Cavity Sales and Growth Rate (2019-2025) & (K Units)
Figure 42. Asia Pacific Niobium Superconducting Cavity Sales and Growth Rate (K Units)
Figure 43. Asia Pacific Niobium Superconducting Cavity Sales Market Share by Region in 2023
Figure 44. China Niobium Superconducting Cavity Sales and Growth Rate (2019-2025) & (K Units)
Figure 45. Japan Niobium Superconducting Cavity Sales and Growth Rate (2019-2025) & (K Units)
Figure 46. South Korea Niobium Superconducting Cavity Sales and Growth Rate (2019-2025) & (K Units)
Figure 47. India Niobium Superconducting Cavity Sales and Growth Rate (2019-2025) & (K Units)
Figure 48. Southeast Asia Niobium Superconducting Cavity Sales and Growth Rate (2019-2025) & (K Units)
Figure 49. South America Niobium Superconducting Cavity Sales and Growth Rate (K Units)
Figure 50. South America Niobium Superconducting Cavity Sales Market Share by Country in 2023
Figure 51. Brazil Niobium Superconducting Cavity Sales and Growth Rate (2019-2025) & (K Units)
Figure 52. Argentina Niobium Superconducting Cavity Sales and Growth Rate (2019-2025) & (K Units)
Figure 53. Columbia Niobium Superconducting Cavity Sales and Growth Rate (2019-2025) & (K Units)
Figure 54. Middle East and Africa Niobium Superconducting Cavity Sales and Growth Rate (K Units)
Figure 55. Middle East and Africa Niobium Superconducting Cavity Sales Market Share by Region in 2023
Figure 56. Saudi Arabia Niobium Superconducting Cavity Sales and Growth Rate (2019-2025) & (K Units)
Figure 57. UAE Niobium Superconducting Cavity Sales and Growth Rate (2019-2025) & (K Units)
Figure 58. Egypt Niobium Superconducting Cavity Sales and Growth Rate (2019-2025) & (K Units)
Figure 59. Nigeria Niobium Superconducting Cavity Sales and Growth Rate (2019-2025) & (K Units)
Figure 60. South Africa Niobium Superconducting Cavity Sales and Growth Rate (2019-2025) & (K Units)
Figure 61. Global Niobium Superconducting Cavity Production Market Share by Region (2019-2025)
Figure 62. North America Niobium Superconducting Cavity Production (K Units) Growth Rate (2019-2025)
Figure 63. Europe Niobium Superconducting Cavity Production (K Units) Growth Rate (2019-2025)
Figure 64. Japan Niobium Superconducting Cavity Production (K Units) Growth Rate (2019-2025)
Figure 65. China Niobium Superconducting Cavity Production (K Units) Growth Rate (2019-2025)
Figure 66. Global Niobium Superconducting Cavity Sales Forecast by Volume (2019-2032) & (K Units)
Figure 67. Global Niobium Superconducting Cavity Market Size Forecast by Value (2019-2032) & (M USD)
Figure 68. Global Niobium Superconducting Cavity Sales Market Share Forecast by Type (2025-2032)
Figure 69. Global Niobium Superconducting Cavity Market Share Forecast by Type (2025-2032)
Figure 70. Global Niobium Superconducting Cavity Sales Forecast by Application (2025-2032)
Figure 71. Global Niobium Superconducting Cavity Market Share Forecast by Application (2025-2032)