Key Statistics
Key Takeaways
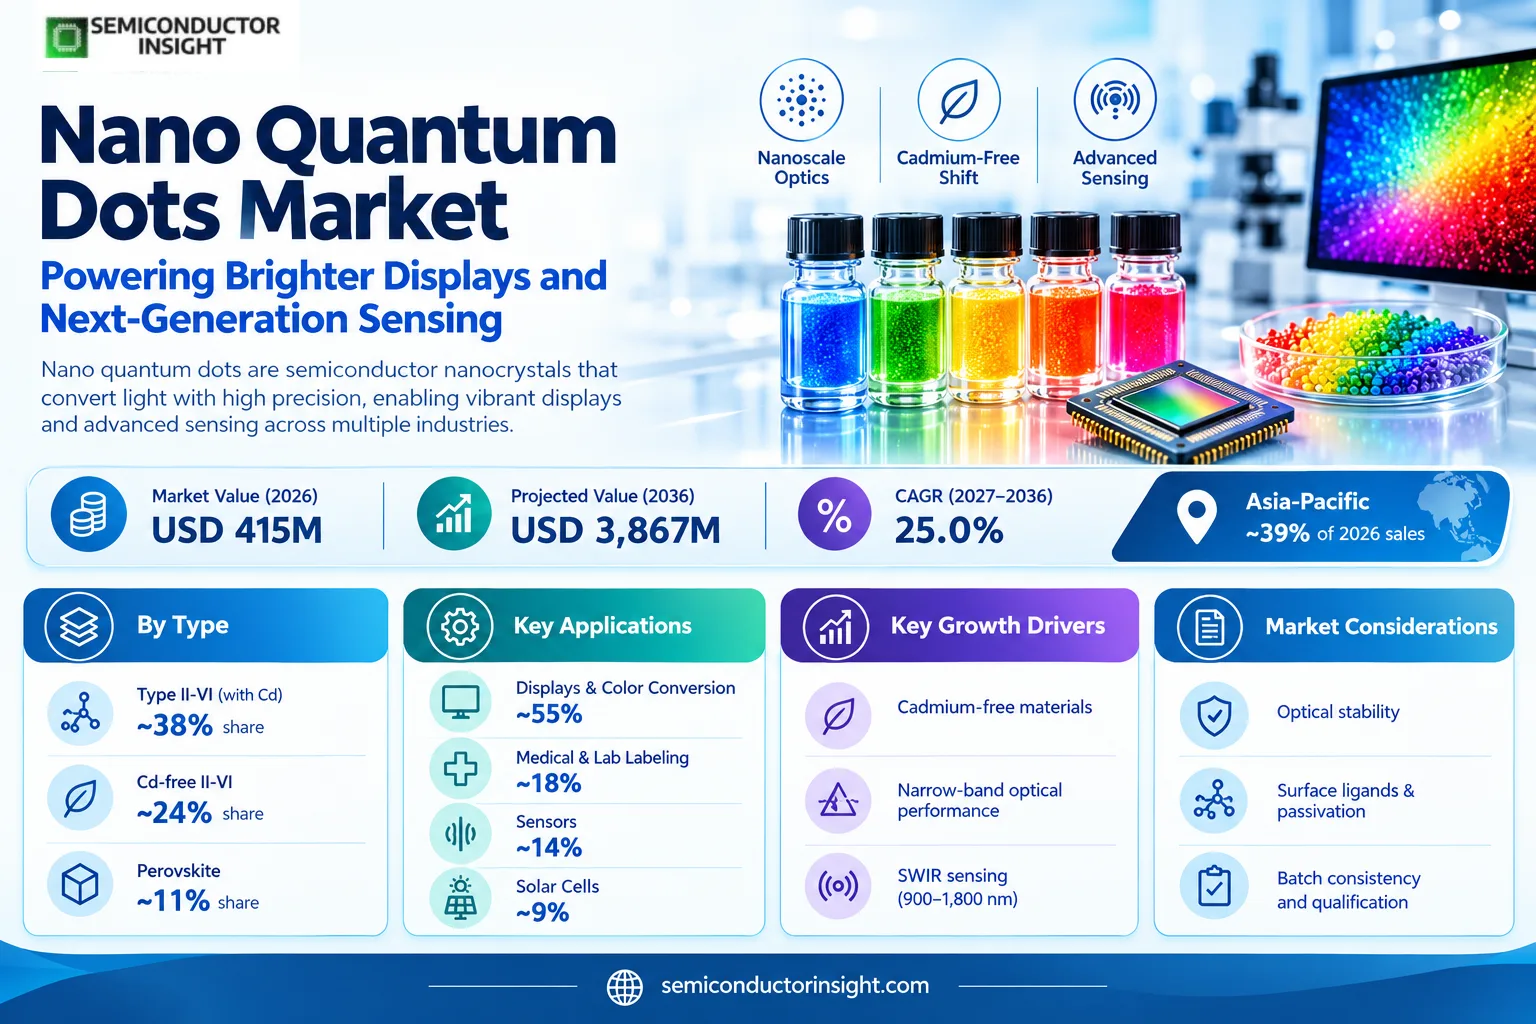
- Market value: the nano quantum dots market reaches USD 415 million in 2026 and is projected to expand to USD 3,867 million in 2036, implying a 25.0% compound annual rate across the 2027–2036 outlook. Materials for optical conversion, fluorescent labeling and short-wave infrared detection account for distinct purchasing routes.
- Largest and fastest chemistries: Type II-VI with cadmium is the largest chemistry at an estimated ~38% of 2026 material revenue, reflecting established colloidal synthesis; perovskite dots have an estimated ~11% starting share and the fastest modeled ~33.3% CAGR as stability and scale-up improve.
- Application mix: Displays lead with an estimated ~55% of 2026 nanocrystal revenue because optical conversion is already integrated into consumer displays, while sensors represent an estimated ~14% and show a faster modeled ~29.0% CAGR as SWIR imaging designs mature.
- Regional position: Asia-Pacific holds the largest estimated 2026 share at ~39% and has a modeled ~26.5% CAGR, reflecting panel-manufacturing concentration and chemistry supply chains; Europe follows at ~25%, with material specialists supporting qualification and industrial imaging.
- Commercial restraint: Nanocrystal uniformity, encapsulation stability, restricted heavy metals, solvent handling and qualification cycles constrain conversion from laboratory lots to electronics-grade volume orders. The difference between nanoparticle sales and the value of finished displays or imaging devices remains central to procurement comparisons.
Global Nano Quantum Dots Market Overview
The Nano quantum dots market is valued at USD 415 million in 2026 and projected to reach USD 3,867 million by 2036, representing a CAGR of 25.0% over 2027–2036. Asia-Pacific is the largest estimated regional market at ~39% of 2026 material sales, reflecting its concentration of display integration and electronics production.
Nano quantum dots are semiconductor nanocrystals, commonly in the ~1–10 nm size range, whose electronic energy levels and light absorption or emission change with composition and particle dimensions. For display conversion, controlled red and green emissions are excited by blue illumination; for imaging, narrow-gap materials such as PbS or InAs respond in the 900–1,800 nm short-wave infrared range. Commercial performance depends on particle size dispersion, surface ligands, optical efficiency and the reliability of subsequent processing.
The revenue boundary covers quantum-dot nanocrystals, nanoparticle dispersions, electronic-grade inks and related materials supplied for use in displays, medical and laboratory labeling, solar cells and sensors. Finished televisions, display panels, cameras, diagnostic instruments, solar modules, photodiodes and downstream cloud services are excluded. Supplier formulations sold as films can inform material demand, but the complete finished-film or device selling price is not treated as pure nanoparticle revenue. This distinction avoids double counting between materials producers and downstream assemblers.
The supply architecture begins with precursor purity, controlled colloidal nucleation and particle-growth chemistry, followed by surface passivation, ligand exchange and solvent or polymer formulation. Quantum Solutions lists perovskite ABX3 materials emitting around 450–530 nm, while its InAs range covers absorption peaks from 900 to 1,800 nm. These distinct wavelength families serve different system designs, so a single price per gram cannot represent the entire 2026 market without separating chemistry, grade, yield and delivery form.
Display manufacturers purchase tight emission distributions and optical stability because color-conversion performance must survive light flux, temperature and humidity. Avantama describes perovskite conversion films achieving up to 93% Rec.2020 color coverage in its stated architecture, with its own comparative tests reporting higher brightness and lower power than selected reference films. Imaging buyers instead prioritize absorption response, defect passivation and compatibility with 200 mm wafer processes; Quantum Solutions details a PbS ink intended for repeatable coating of large substrates.
The material market is changing as customers seek cadmium-free display chemistries and solution-processable SWIR sensors rather than relying exclusively on older II-VI emitters. Samsung announced independent cadmium-free certification for its quantum-dot sheet in March 2025, and Nanoco described commercial PbS plus lead-free III-V SWIR options in August 2025. These developments support a differentiated product mix: proven emitters can retain share while qualification-sensitive newer materials win designs only after stability, compliance and device-level testing.
Segment Analysis: By Type
By chemistry, established cadmium-containing Type II-VI nanocrystals lead at an estimated ~38% of 2026 revenue, while perovskite products have an estimated ~11% starting share and the fastest modeled ~33.3% CAGR. The seven product classes differ materially in core composition, emission or absorption window, regulatory exposure and the level of manufacturing qualification required for electronics-grade supply.
| Type | Function | Market position |
|---|---|---|
| Type II-VI (with Cd) | CdSe and related II-VI semiconductor emitters offer a mature optical conversion baseline, with particle-size control enabling red and green emission. Established syntheses and high optical brightness are strengths, while cadmium content requires careful screening of electronics compliance, customer acceptance and application-specific exemptions. For Type II-VI (with Cd), qualification requires comparing at least 2 optical parameters, one formulation constraint and a documented 2026 sample-to-production transition plan before a customer can specify a repeat order. | The estimated ~38% share in 2026 makes this the largest chemistry family, but its modeled ~18.6% CAGR trails newer alternatives. Existing optical qualification and research catalogues support continued orders, although buyers increasingly require evidence on hazardous-substance content, encapsulation, waste management and the specific legal status of their final product. The 2026 estimate also depends on the mix of 2 distinct purchasing channels: application-development samples and qualified recurring material deliveries, which have different commercial prices and quality-control obligations. |
| Type II-VI (Cd-free) | Cadmium-free II-VI alternatives and alloyed structures are specified when customers need the optical behavior of colloidal semiconductor dots with different restricted-substance exposure. Formulators must validate emission width, quantum yield and long-term operation rather than assuming every replacement chemistry can drop into the same polymer matrix. For Type II-VI (Cd-free), qualification requires comparing at least 2 optical parameters, one formulation constraint and a documented 2026 sample-to-production transition plan before a customer can specify a repeat order. | An estimated ~24% of 2026 material revenue belongs to this group, with modeled ~28.1% CAGR as product qualification broadens. Samsung’s March 2025 independent no-cadmium film certification is evidence of downstream demand, not a measurement of the nanocrystal revenue share or a blanket certification for every supplier material. The 2026 estimate also depends on the mix of 2 distinct purchasing channels: application-development samples and qualified recurring material deliveries, which have different commercial prices and quality-control obligations. |
| Type III-V | III-V compounds include indium phosphide for visible emitters and indium arsenide for short-wave infrared absorption. Quantum Solutions lists InAs absorption peaks from 900 to 1,800 nm with particle dimensions roughly 3–9 nm, illustrating the tight relationship between nanocrystal size and wavelength specification in photodetector design. For Type III-V, qualification requires comparing at least 2 optical parameters, one formulation constraint and a documented 2026 sample-to-production transition plan before a customer can specify a repeat order. | The estimated ~12% share in 2026 and modeled ~27.3% CAGR reflect a smaller but increasingly important electronics-grade opportunity. Suppliers compete on low-defect synthesis, repeatable ligand exchange and integration into silicon sensor stacks, with lead-free positioning relevant to customers seeking alternatives to mature PbS-based infrared materials. The 2026 estimate also depends on the mix of 2 distinct purchasing channels: application-development samples and qualified recurring material deliveries, which have different commercial prices and quality-control obligations. |
| Perovskite | Perovskite ABX3 nanocrystals can deliver narrow visible emission and are supplied as colloidal dispersions or integrated optical-conversion formulations. Quantum Solutions specifies products with 450–530 nm emission and spectral widths below 20–25 nm; Avantama reports mass-production-scale perovskite film manufacturing for LCD and MiniLED applications. For Perovskite, qualification requires comparing at least 2 optical parameters, one formulation constraint and a documented 2026 sample-to-production transition plan before a customer can specify a repeat order. | Perovskite starts at an estimated ~11% of 2026 nanocrystal revenue and has the fastest modeled type growth, ~33.3% CAGR. Commercial adoption depends on environmental stability, solvent and ligand engineering, reproducibility under intense blue flux and credible device testing rather than on laboratory photoluminescence efficiency alone. The 2026 estimate also depends on the mix of 2 distinct purchasing channels: application-development samples and qualified recurring material deliveries, which have different commercial prices and quality-control obligations. |
| Silicon | Silicon quantum dots are investigated for optical and electronic properties while leveraging familiarity with silicon-based material systems. Their surface chemistry, emission performance and processing routes differ from II-VI and perovskite dots, which makes qualification specific to the target optical, sensing or research function. For Silicon, qualification requires comparing at least 2 optical parameters, one formulation constraint and a documented 2026 sample-to-production transition plan before a customer can specify a repeat order. | An estimated ~5% 2026 share and modeled ~20.4% CAGR describe a comparatively specialized revenue base. Buyers place value on reproducible size distributions and surface termination; research volumes and commercial device adoption must be distinguished because a promising demonstration does not establish a mass-production procurement program. The 2026 estimate also depends on the mix of 2 distinct purchasing channels: application-development samples and qualified recurring material deliveries, which have different commercial prices and quality-control obligations. |
| Carbon | Carbon dots offer another nanoscale photoluminescent material class for research, labeling and selected optical concepts. Commercial specifications emphasize synthesis consistency, surface functional groups, fluorescence response and dispersion stability; a carbon-dot catalogue item cannot be assumed equivalent to an electronic-grade indium phosphide emitter. For Carbon, qualification requires comparing at least 2 optical parameters, one formulation constraint and a documented 2026 sample-to-production transition plan before a customer can specify a repeat order. | An estimated ~6% of 2026 revenue and modeled ~21.2% CAGR indicate a niche that may benefit from accessible feedstocks and biomedical experimentation. Commercial uptake remains sensitive to purity, batch comparability and the extent to which customers can validate a repeatable application beyond exploratory sample purchases. The 2026 estimate also depends on the mix of 2 distinct purchasing channels: application-development samples and qualified recurring material deliveries, which have different commercial prices and quality-control obligations. |
| Others | Other quantum-dot chemistries include narrow-gap absorbers and emerging compound or alloy combinations developed for nonstandard optical windows. Product families can span materials for near-infrared sensing, specialty spectroscopy and experimental photovoltaic stacks, with substantial variation in ligands, hazardous-substance handling and available manufacturing quantities. For Others, qualification requires comparing at least 2 optical parameters, one formulation constraint and a documented 2026 sample-to-production transition plan before a customer can specify a repeat order. | The residual estimated ~4% share in 2026 has a modeled ~23.1% CAGR. This category is commercially fragmented: suppliers win specific wavelength or integration requirements rather than a common mass-market specification, and some candidates remain pre-commercial despite technically credible prototype results. The 2026 estimate also depends on the mix of 2 distinct purchasing channels: application-development samples and qualified recurring material deliveries, which have different commercial prices and quality-control obligations. |
Secondary product segmentation: optical function and delivery form
Optical-function segmentation distinguishes visible emitters used in color conversion from short-wave infrared absorbers used in sensors and from functionalized fluorescent probes used in laboratory imaging. A 450–530 nm emitter does not substitute for a 900–1,800 nm absorber, even when both are colloidal quantum dots. This distinction shapes raw-material selection, encapsulation design, measurement equipment and customer qualification programs across the 2026–2036 horizon.
| Axis | Members | Commercial role |
|---|---|---|
| Optical function | Visible emitters · SWIR absorbers · Fluorescent labels | Visible emitters represent the leading estimated ~55% application-linked material flow in 2026; wavelength and quantum-yield requirements determine which synthesis route can meet a specific customer design. |
| Delivery form | Dry powder · Colloidal dispersion · Ink · Surface-functionalized probe | Dispersions and inks support controlled coating and ligand exchange, while functionalized probes support biomolecule conjugation. Packaging, shelf life and quality release requirements differ by each commercial delivery form. |
Segment Analysis: By Application
Display conversion accounts for an estimated ~55% of 2026 nanocrystal revenue; medical and laboratory applications follow at ~18%, sensors at ~14%, solar cells at ~9%, and other uses at ~4%. Sensors have the fastest modeled application CAGR of ~29.0%, reflecting emerging SWIR designs, whereas display materials benefit from existing high-volume qualification processes.
| Application | Demand characteristics |
|---|---|
| Displays | Displays purchase visible-light conversion materials with narrow color emission, stable quantum yield and compatibility with films, resins or photoresists. The estimated ~55% share in 2026 makes this the leading application; its modeled ~24.0% CAGR reflects continuing material adoption rather than the sales value of finished televisions. Samsung’s 2025 no-cadmium certification and Avantama’s qualified perovskite films illustrate different routes to customer acceptance. Blue-flux aging, color uniformity and environmental compliance remain important supply conditions. |
| Medical Devices | Medical and laboratory users purchase functionalized quantum-dot labels for fluorescence microscopy, cytometry, biomolecule tagging and related research workflows. The estimated ~18% share in 2026 and modeled ~24.9% CAGR cover the supplied nanocrystal or probe material, not the selling price of clinical equipment. Thermo Fisher lists Qdot 705 carboxyl, Qdot 655 amino PEG and Qdot 605 streptavidin reagents; these products demonstrate conjugation choices, while research-use status must not be confused with approval for patient treatment. |
| Solar Cells | Solar-cell research uses nanocrystal absorbers and related coatings to explore wavelength harvesting, charge separation and solution-processable thin-film stacks. The estimated ~9% share in 2026 and modeled ~24.4% CAGR reflect material demand across research and selected development programs rather than revenue from complete photovoltaic modules. Commercial prospects depend on lifetime testing, encapsulation, power-conversion performance and whether coating methods can be transferred from small coupons to repeatable large-area manufacturing. |
| Sensors | Sensors use narrow-gap quantum-dot films to extend optical detection beyond visible wavelengths into short-wave infrared bands. The estimated ~14% 2026 share grows at a modeled ~29.0% CAGR, faster than the display category, as wafer-compatible materials become better defined. Quantum Solutions describes InAs absorption peaks from 900 to 1,800 nm and PbS ink applied on 200 mm wafers; these are material and process capabilities, not evidence that every imaging customer has completed commercial qualification. |
| Others | Other uses include specialty lighting, research spectroscopy, experimental optical components and functional materials that do not fit the main four application groups. The estimated ~4% share in 2026 and modeled ~23.7% CAGR are deliberately separated from displays, medical devices, solar cells and sensors to avoid counting the same nanocrystal order twice. Customers usually purchase small technical lots, custom ligands or a narrowly specified emission band before considering repeat manufacturing orders. |
Commercial channels are application-specific. Display suppliers typically negotiate multi-stage material qualification with film or panel integrators; sensing programs involve photodiode-stack developers, foundry partners and camera designers; and biomedical probes move through reagent catalogues and laboratory distribution. This diversity matters because a 2026 sample order, a 2027 pilot line and a 2036 production contract have different margins, validation costs and purchase volumes, even when the core particle chemistry is nominally similar.
Regional Analysis
Asia-Pacific leads the 2026 nano quantum dots material market with an estimated ~39% share and a modeled ~26.5% CAGR. Europe accounts for ~25% and North America for ~24%; South America and the Middle East & Africa represent ~7% and ~5%, respectively. The faster regional growth is associated with Asian display conversion and selective adoption of sensing materials, not with finished television revenue.
How do regional material supply chains shape the 2026–2036 outlook?
Regional purchasing patterns reflect different stages of the material value chain. Asia-Pacific combines display integration and chemistry sourcing, Europe emphasizes specialty formulation and hazardous-substance compliance, and North America brings SWIR sensor development and biomedical reagent channels. These positions are expressed as estimated shares of pure nanocrystal material sales in 2026; country-level device turnover is deliberately excluded to avoid inflating the material revenue object.
Growth assumptions vary by region because the underlying customer mix is not uniform. The modeled Asia-Pacific CAGR of ~26.5% reflects continued optical-conversion demand, while Europe at ~25.8% has a stronger materials-qualification and industrial-optics orientation. North America at ~21.4% is constrained by specialized sensor validation cycles; South America at ~25.2% and Middle East & Africa at ~24.1% begin from smaller material purchasing bases and remain sensitive to imports.
| Region | Position | Growth outlook | Demand profile | What decides supplier selection |
|---|---|---|---|---|
| Asia-Pacific | Asia-Pacific represents an estimated ~39% of 2026 pure-nanocrystal revenue. Its position reflects display-material qualification and panel integration, rather than the retail value of finished devices. The allocation is compatible with the five-region global material boundary and is intended for comparing purchasing environments across regions. It should be interpreted alongside the different maturity of display and sensing programs in each national market. | The modeled ~26.5% CAGR from the 2026 base to 2036 is shaped by display-material qualification and panel integration. This regional trajectory is an estimate, not a published supplier shipment series; conversion into recurring material orders depends on application-specific design wins, qualified production yield and a sustainable commercial supply chain. Changes in film formulation and device qualification can materially alter the timing of volume purchasing. | The most relevant customer profile centers on color-conversion films, inks and visible emitters. Regional buyers compare wavelength needs across 450–530 nm visible emitters and 900–1,800 nm infrared absorbers, but the same material grade cannot satisfy both optical functions. Procurement also differs between laboratory quantities and electronic-grade process lots. Market participants therefore distinguish sample-stage programs from repeat industrial contracts. | Panel suppliers require emission consistency, humidity and thermal endurance, cadmium-compliance documentation and repeatable lot-to-lot optical output before adopting new material formulations. Supplier selection also depends on whether a nanocrystal formulation survives 2026 qualification tests and can support future orders without significant changes to the emission spectrum, ligand package or process yield. |
| North America | North America represents an estimated ~24% of 2026 pure-nanocrystal revenue. Its position reflects SWIR imaging development and specialized research reagents, rather than the retail value of finished devices. The allocation is compatible with the five-region global material boundary and is intended for comparing purchasing environments across regions. It should be interpreted alongside the different maturity of display and sensing programs in each national market. | The modeled ~21.4% CAGR from the 2026 base to 2036 is shaped by SWIR imaging development and specialized research reagents. This regional trajectory is an estimate, not a published supplier shipment series; conversion into recurring material orders depends on application-specific design wins, qualified production yield and a sustainable commercial supply chain. | The most relevant customer profile centers on InAs and PbS sensor absorbers, functionalized probes. Regional buyers compare wavelength needs across 450–530 nm visible emitters and 900–1,800 nm infrared absorbers, but the same material grade cannot satisfy both optical functions. Procurement also differs between laboratory quantities and electronic-grade process lots. Market participants therefore distinguish sample-stage programs from repeat industrial contracts. | Engineering teams require spectral response, controlled defect density, 200 mm wafer compatibility, intellectual-property clarity and reliable handling of lead-containing or lead-free absorber chemistries. Supplier selection also depends on whether a nanocrystal formulation survives 2026 qualification tests and can support future orders without significant changes to the emission spectrum, ligand package or process yield. |
| Europe | Europe represents an estimated ~25% of 2026 pure-nanocrystal revenue. Its position reflects materials science, industrial optics and hazardous-substance compliance, rather than the retail value of finished devices. The allocation is compatible with the five-region global material boundary and is intended for comparing purchasing environments across regions. It should be interpreted alongside the different maturity of display and sensing programs in each national market. | The modeled ~25.8% CAGR from the 2026 base to 2036 is shaped by materials science, industrial optics and hazardous-substance compliance. This regional trajectory is an estimate, not a published supplier shipment series; conversion into recurring material orders depends on application-specific design wins, qualified production yield and a sustainable commercial supply chain. | The most relevant customer profile centers on lead-free sensing materials and compliant display emitters. Regional buyers compare wavelength needs across 450–530 nm visible emitters and 900–1,800 nm infrared absorbers, but the same material grade cannot satisfy both optical functions. Procurement also differs between laboratory quantities and electronic-grade process lots. Market participants therefore distinguish sample-stage programs from repeat industrial contracts. | European procurement teams compare the chemical composition, product-specific RoHS status, lifetime data and process consistency of nanocrystal batches before they are incorporated into industrial sensors or consumer display products. Supplier selection also depends on whether a nanocrystal formulation survives 2026 qualification tests and can support future orders without significant changes to the emission spectrum, ligand package or process yield. |
| South America | South America represents an estimated ~7% of 2026 pure-nanocrystal revenue. Its position reflects import-led electronics integration and university research demand, rather than the retail value of finished devices. The allocation is compatible with the five-region global material boundary and is intended for comparing purchasing environments across regions. It should be interpreted alongside the different maturity of display and sensing programs in each national market. | The modeled ~25.2% CAGR from the 2026 base to 2036 is shaped by import-led electronics integration and university research demand. This regional trajectory is an estimate, not a published supplier shipment series; conversion into recurring material orders depends on application-specific design wins, qualified production yield and a sustainable commercial supply chain. | The most relevant customer profile centers on research dispersions, display components and laboratory probes. Regional buyers compare wavelength needs across 450–530 nm visible emitters and 900–1,800 nm infrared absorbers, but the same material grade cannot satisfy both optical functions. Procurement also differs between laboratory quantities and electronic-grade process lots. Market participants therefore distinguish sample-stage programs from repeat industrial contracts. | Buyers weigh import documentation, transport conditions, solvent restrictions, technical support and the ability to reproduce optical specifications after shipment, particularly for small batches and specialty research reagents. Supplier selection also depends on whether a nanocrystal formulation survives 2026 qualification tests and can support future orders without significant changes to the emission spectrum, ligand package or process yield. |
| Middle East & Africa | Middle East & Africa represents an estimated ~5% of 2026 pure-nanocrystal revenue. Its position reflects research-led sensing, industrial monitoring and technology procurement, rather than the retail value of finished devices. The allocation is compatible with the five-region global material boundary and is intended for comparing purchasing environments across regions. It should be interpreted alongside the different maturity of display and sensing programs in each national market. | The modeled ~24.1% CAGR from the 2026 base to 2036 is shaped by research-led sensing, industrial monitoring and technology procurement. This regional trajectory is an estimate, not a published supplier shipment series; conversion into recurring material orders depends on application-specific design wins, qualified production yield and a sustainable commercial supply chain. | The most relevant customer profile centers on SWIR sensor materials and specialty research nanocrystals. Regional buyers compare wavelength needs across 450–530 nm visible emitters and 900–1,800 nm infrared absorbers, but the same material grade cannot satisfy both optical functions. Procurement also differs between laboratory quantities and electronic-grade process lots. Market participants therefore distinguish sample-stage programs from repeat industrial contracts. | A supplier must document thermal storage, solvent handling, reliable shipment and compatibility with selected imaging electronics; purchasing often hinges on a demonstrable sensor application rather than mass-market display volume. Supplier selection also depends on whether a nanocrystal formulation survives 2026 qualification tests and can support future orders without significant changes to the emission spectrum, ligand package or process yield. |
Competitive Landscape
Competition in nano quantum dots is divided among commercial nanocrystal material producers, electronics-integrated material suppliers, reagent catalogues and downstream device companies. In 2026, supplier differentiation rests on chemistry, surface functionalization, wavelength consistency, process scale and the ability to document compliance. A company selling finished televisions is not automatically a merchant supplier of pure nanocrystals.
Established material specialists such as Nanosys, Nanoco, Avantama and American Elements participate through different portfolios. Nanosys describes quantum dots for optical conversion and other applications; Nanoco emphasizes electronic-grade SWIR absorber materials; Avantama focuses on perovskite formulations and conversion films; American Elements offers multiple nanocrystal chemistries. These are not interchangeable product lines, and their disclosed technical capabilities should not be interpreted as equivalent annual revenue contributions.
Quantum Solutions lists colloidal InAs, PbS and perovskite product families, including visible emitters and infrared absorbers with explicit wavelength ranges. Its InAs product specifications span roughly 900–1,800 nm, while PbS n-type ink is intended for solution-coated photodiodes. This breadth supports sensor-development programs, but long-term purchasing depends on integration yield, electrical behavior and customer-specific qualification, not catalogue presence alone.
Thermo Fisher participates through fluorescent research probes, including Qdot 705 carboxyl, Qdot 655 amino PEG and Qdot 605 streptavidin formats. The business model differs from panel-integrated display materials: the purchasing unit is a functionalized reagent, and laboratory application validation is distinct from consumer electronics qualification. Medical-device claims should be limited to supported use cases rather than inferring regulatory clearance for clinical treatment.
The published company universe also contains Samsung Electronics, Hansol Chemical, Merck, BOHR, Suzhou Xingshuo Nanotech, Xingzi New Material, Najing Tech, Nantong Veeyeei, Huada Nano, Yang-Ming Quantum Tech and Wuhan Jiayuan. Their exact role may range from upstream chemicals to downstream integration; only firms with substantiated nanocrystal supply capability belong in the direct-material supplier tiers. Competitive benchmarking therefore separates merchant supply, specialist formulations and customer-facing devices.
Tier structure
| Tier | Companies | Basis of competition |
|---|---|---|
| Tier 1 — verified materials specialists | Nanosys; Nanoco; Avantama | These suppliers publish identifiable quantum-dot material or conversion-formulation portfolios, including visible emitters and infrared absorbers. Their technical differentiation is linked to repeatable nanocrystal synthesis, controlled surface chemistry and application qualification; a ranking by revenue cannot be inferred from the available catalogue disclosures. The tier designation concerns verified 2026 product scope, not an invented ranking of company sales; customers must confirm the specific chemistry and delivery form before comparing commercial suppliers. |
| Tier 2 — verified specialty and reagent supply | American Elements; Quantum Solutions; Thermo Fisher Scientific | Product catalogues document multiple chemistry families, electronic-grade inks and fluorescently functionalized probes. They serve distinct order sizes and customer segments; research reagent turnover and device-material revenue are not treated as identical commercial models or direct evidence of a shared market share. The tier designation concerns verified 2026 product scope, not an invented ranking of company sales; customers must confirm the specific chemistry and delivery form before comparing commercial suppliers. |
| Tier 3 — integrated or unverified direct supply | Samsung Electronics; Hansol Chemical; Merck; BOHR; Suzhou Xingshuo Nanotech; Xingzi New Material; Najing Tech; Nantong Veeyeei; Huada Nano; Yang-Ming Quantum Tech; Wuhan Jiayuan | The names remain in the profiled company universe, but direct merchant nanocrystal supply was not established for every company in the current evidence set. Downstream electronics integration, general chemicals participation and undisclosed commercial arrangements do not justify a Tier 1 or Tier 2 material supplier designation. The tier designation concerns verified 2026 product scope, not an invented ranking of company sales; customers must confirm the specific chemistry and delivery form before comparing commercial suppliers. |
Key companies profiled
- Samsung Electronics
- Hansol Chemical
- Merck
- BOHR
- Suzhou Xingshuo Nanotech
- Nanosys, Inc.
- American Elements
- Xingzi New Material
- Najing Tech
- Nantong Veeyeei
- Huada Nano
- Nanoco
- Yang-Ming Quantum Tech
- Avantama
- Wuhan Jiayuan
Production Capacity Analysis
Quantum-dot capacity is defined by qualified output of specific nanocrystal chemistries, not by the nominal volume of a finished display plant. For 2026 procurement, a supplier must control precursor quality, size distribution, ligand chemistry, solvent compatibility and release testing. Public evidence supports commercial-scale capabilities for selected products, while total worldwide electronic-grade output by chemistry is not established through a single comparable capacity measure.
Asia-Pacific is central to downstream panel and film integration, creating incentives for local materials handling and high-volume conversion-film supply. Avantama states that its perovskite quantum-dot and film manufacturing operates at mass-production scale and that Asian panel makers have qualified its films. That evidence demonstrates industrial readiness for a named architecture, but does not disclose a globally comparable number of kilograms of pure nanocrystals sold in 2026.
Commercial supply also includes smaller high-value product lots. Avantama describes customized nanoparticle proof-of-concept quantities up to 50 grams, while Quantum Solutions lists colloidal InAs and perovskite dispersions and Thermo Fisher supplies functionalized Qdot probes in microliter-scale reagent packs. A volume-only comparison would misrepresent their different purity requirements, functional value and unit economics. Revenue capacity therefore depends on application mix as well as synthesis throughput.
Upstream bottlenecks include specialty precursors, air-sensitive processing, ligand exchange, purification losses and batch qualification. Quantum Solutions describes InAs dispersions at 10 or 50 mg/mL and specific handling requirements, while Nanoco emphasizes uniformity and surface passivation for sensor performance. These parameters constrain usable electronic-grade yield more directly than reactor nameplate capacity. Suppliers that reduce defects and stabilize coating behavior can expand qualified output without simply increasing raw precursor input.
Market Dynamics
Material growth is driven by qualified optical performance and new device architectures, but the pace varies by chemistry. Visible emitters are tied to display conversion, SWIR absorbers to sensor stacks, and functionalized probes to laboratory workflows. The impact ranges below are directional modeled influences on the long-term growth outlook, not additive contributions to the headline CAGR.
MARKET DRIVERS
Drivers Impact Analysis*
| Driver | (~) % impact on CAGR forecast | Geographic relevance | Impact timeline |
|---|---|---|---|
| Cadmium-free display qualification | +3.0% | Asia-Pacific and Europe | 2026–2031 |
| SWIR sensor material adoption | +2.8% | North America and Europe | 2027–2036 |
| Perovskite coating scale-up | +2.2% | Asia-Pacific | 2026–2034 |
| Biomedical fluorescence reagents | +1.4% | North America and Europe | 2026–2032 |
| Expanded optical R&D | +1.1% | Global research clusters | 2026–2036 |
Display conversion requirements
Display customers seek narrow emission spectra, consistent color conversion and stable performance under blue illumination. Avantama describes a perovskite architecture reaching up to 93% Rec.2020 color coverage, while Samsung disclosed SGS verification of a no-cadmium quantum-dot sheet in 2025. These supplier and customer signals support demand for controlled nanocrystal materials, but the material market excludes the sales value of finished televisions and monitors.
SWIR integration with silicon electronics
Sensor developers are investigating solution-coated quantum-dot absorbers that can extend silicon camera response beyond visible light. Quantum Solutions lists InAs particles spanning approximately 3–9 nm and absorption peaks around 900–1,800 nm, and it describes PbS n-type ink for 200 mm wafer coating. Commercial value depends on electrical passivation, defect control and customer integration yield rather than optical absorption specifications alone.
Cadmium-free chemistry development
Restrictions on certain hazardous substances in electronic equipment increase interest in cadmium-free display materials and alternatives to lead-based infrared absorbers. Nanoco describes development of III-V InAs and InSb nanocrystals, while Nanosys emphasizes heavy-metal-free display quantum dots. Qualification remains application-specific: a chemistry marketed as lead-free or cadmium-free still requires device-level reliability, spectral and manufacturing assessments.
Specialized fluorescent labeling
Functionalized Qdot reagents address biomolecular detection and fluorescence imaging where emission brightness, photostability and conjugation chemistry are important. Thermo Fisher offers carboxyl, amino PEG and streptavidin-linked products, each designed for different labeling workflows. This commercial channel can generate high-value small-volume orders, although catalogue availability does not establish clearance for therapeutic or diagnostic patient use.
MARKET RESTRAINTS
Restraints Impact Analysis*
| Restraint | (~) % impact on CAGR forecast | Geographic relevance | Impact timeline |
|---|---|---|---|
| Humidity and blue-flux aging | −2.4% | Display qualification globally | 2026–2034 |
| Restricted-substance screening | −1.8% | Europe and export supply chains | 2026–2036 |
| Electronic-grade yield variability | −1.6% | All production regions | 2026–2032 |
| Long sensor validation cycles | −1.2% | North America and Europe | 2027–2036 |
Environmental and operating stability
Perovskite and other nanocrystal formulations must maintain spectral output when exposed to heat, moisture and high blue-light flux. Avantama explicitly identifies stability under elevated temperature, humidity and illumination as a commercial qualification requirement. A successful laboratory emission test is not equivalent to a validated 2026 production lot, so customers may extend approval cycles while evaluating encapsulation, film compatibility and long-term color shift.
Chemical and regulatory constraints
Cadmium and lead chemistry choices carry material-declaration, worker-handling and electronic-equipment compliance obligations. European RoHS rules include restricted substances and application-specific exemptions, making it inappropriate to apply one universal ban or exemption to every quantum-dot device. Suppliers must identify the intended end use and material composition before promising a compliant 2027 or 2036 product roadmap.
Uniformity and interface defects
SWIR photodiode performance depends on particle uniformity, ligand chemistry, dense absorber films and the control of surface defects. Nanoco emphasizes that poor passivation and uneven nanocrystal ensembles impede charge transport; Quantum Solutions likewise specifies processing and handling conditions for InAs. Defect-related yield losses can raise effective material cost even when the nominal synthesis batch is large.
Research-to-production conversion
Quantum dots appear in many research demonstrations, but production purchasing requires consistent specifications, traceable batches, suitable storage and a customer design that survives device testing. Functionalized biomedical probes, perovskite emitters and infrared absorber inks have different approval pathways. Forecast growth should not be interpreted as evidence that every 2026 research program will become a 2036 commercial manufacturing contract.
MARKET OPPORTUNITIES
Lead-free infrared material pathways
Nanoco describes III-V InAs and InSb quantum-dot development as a route toward sensors that avoid regulated heavy-metal systems. Quantum Solutions offers colloidal InAs with absorption peaks between 900 and 1,800 nm. The opportunity is to supply stable electronic-grade absorbers to device developers seeking CMOS-compatible SWIR stacks; actual volume depends on pixel-level performance and foundry qualification.
MiniLED conversion materials
Avantama reports mass-production-scale perovskite film capability and qualification by Asian panel makers, with architectures combining green perovskite dots and red KSF phosphor or InP dots. This gives nanocrystal formulators an opportunity to optimize color and power performance for premium LCD backlights. The opportunity is a material order within a display bill of materials, not the entire value of the finished panel.
Functionalized research reagents
Thermo Fisher’s Qdot carboxyl, amino PEG and streptavidin products illustrate how ligand and surface chemistry can create specialized fluorescence tools. Material producers can supply reproducible conjugation-ready probes for microscopy, cytometry and molecular labeling, where performance specifications are more important than tonnage. Commercial development should distinguish research-use materials from regulated clinical applications.
Custom nanocrystal formulations
Avantama describes customized nanoparticle synthesis across 5–50 nm sizes and proof-of-concept batches up to 50 grams, demonstrating a pathway for application-specific prototyping. Other suppliers can differentiate by tailored ligands, solvent systems, wavelength targets and quality documentation. Moving from sample revenue to recurring electronics-grade contracts requires an explicit manufacturing transfer plan and qualified repeatability.
Supply Chain Analysis
The nano quantum dots supply chain spans chemical precursors, nanocrystal synthesis, ligand and solvent formulation, electronics or reagent distribution, and integration into display, imaging or laboratory products. The 2026 revenue boundary is the sold nanocrystal material or formulation; later device assembly, camera integration and retail distribution add separate value that should not be counted as nanoparticle sales.
Upstream materials. Cadmium, indium, lead, sulfur, selenium and perovskite precursor systems require chemistry-specific purity and safe handling. A 2026 supplier may offer several nanocrystal families, but the precursor bill, process environment and disposal obligations differ. Electronic-grade procurement also requires documented solvent composition, particle-size distribution and batch traceability before customers can reproduce optical behavior.
Synthesis and formulation. Nanocrystal producers control size-dependent optical properties through nucleation and growth, then adjust surface ligands and solvent environments for the target coating or labeling process. Quantum Solutions specifies InAs formulations at 10 or 50 mg/mL, while Avantama describes customized dispersions. These details affect shelf life, film morphology, coating yield and the number of qualification iterations before a production purchase.
Sales and qualification. Display customers often work through conversion-film or panel integrators, whereas SWIR customers validate materials inside multilayer photodiode stacks. Research users can purchase Qdot probes through catalogues without establishing mass-volume manufacturing contracts. Contract economics therefore vary by application: sample support, analytical testing and custom formulation may represent a large portion of early 2026 supplier activity.
End-use integration. Finished TVs, cameras, diagnostic instruments and solar modules combine quantum-dot materials with optics, electronics, substrates and software. Samsung’s no-cadmium display certification is relevant downstream evidence, and Nanoco’s sensor material publications illustrate an upstream route to SWIR imaging. The commercial market here captures the quantum-dot material sold into those chains, preventing duplicate attribution of finished-device revenues.
Recent Developments in the Nano Quantum Dots Market
- 10 September 2026 Published
Nanoco published a technical introduction to quantum dots, describing how nanocrystal size changes absorption and emission and how red and green dots are excited in display systems. The publication explains a material-design principle that connects visible conversion and infrared sensing without treating them as identical product markets. It reinforces the importance of particle-size consistency for commercial synthesis and customer wavelength specifications. Source - 27 March 2026 Published
Samsung’s South Africa newsroom described independent verification of its quantum-dot display architecture and the role of cadmium-free materials in premium television performance. The communication is downstream evidence that material chemistry and certification remain visible purchasing attributes. It does not quantify pure nanocrystal revenue or indicate that the same material specification applies to SWIR sensors and laboratory probes. Source - 27 January 2026 Published
Nanoco listed HEATWAVE PbS quantum-dot products intended for SWIR sensing, with its material family spanning roughly 900–2,200 nm. The dated product listing illustrates that suppliers are presenting wavelength-defined absorber choices to device developers. Commercial adoption still depends on passivation, coating behavior and electronic-grade consistency; the listing itself is not evidence of a particular customer shipment volume. Source - 5 August 2025 Published
Nanoco explained the commercial maturity of PbS colloidal quantum dots and its work on lead-free InAs and InSb for SWIR image sensing. The discussion identifies particle uniformity and surface defects as important to photodetector performance, rather than treating absorption wavelength as the only selection criterion. It supports differentiation between mature PbS materials and newer III-V development routes. Source - 1 May 2025 Published
Nanoco discussed the broader adoption of quantum dots in display technologies and the importance of cadmium-free positioning. The supplier article is useful for identifying optical-conversion applications and market interest, but third-party numerical industry forecasts quoted within it are not used as independent material-market measurements. The commercial implication is continued pressure for verifiable QD content and reliable conversion performance. Source - 12 March 2025 Announced
Samsung announced that SGS had verified its quantum-dot sheet as cadmium-free and compliant with RoHS requirements. The certification is a concrete example of how downstream electronics customers can distinguish qualified material systems by chemical composition. It is not a certification of all cadmium-free dots sold worldwide, and it does not reveal the revenue earned by individual nanocrystal suppliers. Source
REPORT SCOPE & SEGMENTATION
| Attribute | Details |
|---|---|
| Study period | 2021–2036 |
| Historical period | 2021–2025 |
| Base year | 2026 |
| Estimated year | 2027 |
| Forecast period | 2027–2036 |
| 2026 market size | USD 415 million |
| 2027 estimated size | USD 519 million |
| 2036 projected size | USD 3,867 million |
| Growth rate | 25.0% |
| Revenue unit | USD million; sales of quantum-dot nanocrystals, dispersions, inks and related material formulations, excluding finished electronics |
| By Type | Type II-VI (with Cd) · Type II-VI (Cd-free) · Type III-V · Perovskite · Silicon · Carbon · Others |
| By Application | Displays · Medical Devices · Solar Cells · Sensors · Others |
| By Optical Function | Visible emitters · SWIR absorbers · Fluorescent labels |
| By Delivery Form | Powders · Colloidal dispersions · Electronic-grade inks · Functionalized probes |
| By Region | Five-region global coverage with 2026 modeled material revenue shares; country descriptions are commercial channels rather than separately quantified national totals. North AmericaUnited States · Canada · Mexico EuropeGermany · United Kingdom · France · Russia · Italy · Rest of Europe Asia-PacificChina · Japan · South Korea · India · Southeast Asia · Rest of Asia-Pacific South AmericaBrazil · Argentina · Colombia · Rest of South America Middle East & AfricaSaudi Arabia · UAE · Egypt · Nigeria · South Africa · Rest of MEA |
| Key Companies Profiled | Samsung Electronics · Hansol Chemical · Merck · BOHR · Suzhou Xingshuo Nanotech · Nanosys, Inc. · American Elements · Xingzi New Material · Najing Tech · Nantong Veeyeei · Huada Nano · Nanoco · Yang-Ming Quantum Tech · Avantama · Wuhan Jiayuan |
| Customization Scope | Material chemistry, product grade, regional application demand, supplier qualification and revenue boundary can be tailored for display conversion, sensing, biomedical labels or solar research without combining material and finished-device sales. |
Frequently Asked Questions
How large is the global nano quantum dots market in 2026?
The global market is valued at USD 415 million in 2026 and is projected to reach USD 3,867 million by 2036, representing a 25.0% compound annual rate during 2027–2036. This scope includes sold nanocrystal materials, dispersions, inks and functionalized probes. It excludes the full value of televisions, cameras, photovoltaic modules and other downstream devices, which incorporate many components beyond quantum dots.
Which quantum dot chemistry holds the largest market share?
Type II-VI with cadmium holds the largest estimated 2026 chemistry share at ~38%, supported by mature colloidal synthesis and established visible-light emission applications. Cadmium-free II-VI materials follow at ~24%, while III-V at ~12% and perovskites at ~11% serve different spectral and regulatory requirements. These are estimated material-revenue shares, not published unit shipment counts.
Which quantum dot chemistry is expected to grow fastest?
Perovskite nanocrystals have the fastest modeled chemistry CAGR at ~33.3% from the 2026 base to 2036, starting from an estimated ~11% material share. Suppliers describe narrow emission and perovskite conversion-film production capability, but customers still need evidence on moisture resistance, blue-flux stability, optical consistency and repeatable coating yield before placing large production orders.
What is the largest application for nano quantum dots?
Displays represent the largest estimated application at ~55% of 2026 nanocrystal revenue, followed by medical and laboratory materials at ~18%, sensors at ~14%, solar cells at ~9% and other uses at ~4%. Display demand focuses on red and green optical conversion, whereas sensors require infrared absorption and biomedical buyers specify functionalized fluorescent probes.
Which application has the fastest modeled growth?
Sensors have the fastest modeled application CAGR at ~29.0%, starting from an estimated ~14% of 2026 material revenue. Quantum Solutions lists InAs absorbers for 900–1,800 nm and PbS ink designed for 200 mm wafer coating. These product specifications indicate possible sensor integration routes, although individual customer qualifications and recurring orders remain separate commercial milestones.
Which region leads the nano quantum dots market?
Asia-Pacific leads with an estimated ~39% of 2026 pure-nanocrystal revenue and a modeled ~26.5% CAGR. Europe follows at ~25%, North America at ~24%, South America at ~7% and Middle East & Africa at ~5%. Asia-Pacific benefits from display integration and electronics manufacturing, while Europe and North America have substantial specialty materials and sensor development activity.
How does Europe compare with North America?
Europe has an estimated ~25% share of 2026 nanocrystal revenue and modeled ~25.8% CAGR, compared with North America at ~24% and ~21.4% CAGR. Europe’s commercial logic emphasizes specialty materials, industrial optics and chemical compliance, while North America includes sensor development and biomedical reagents. Neither region’s estimated share is a substitute for audited company shipments.
Why are cadmium-free quantum dots commercially important?
Cadmium-free chemistries can help electronics producers meet customer and legal requirements while retaining narrow-band optical conversion. Samsung announced SGS verification of a no-cadmium quantum-dot sheet in March 2025, illustrating downstream qualification. Individual suppliers must still demonstrate material-specific performance, complete composition declarations and compliance with the rules applicable to the final product and its intended use.
Are quantum dots used in medical devices and diagnostics?
Quantum dots are used as fluorescent materials in research and laboratory labeling workflows. Thermo Fisher lists Qdot 705 carboxyl, Qdot 655 amino PEG and Qdot 605 streptavidin formats for different conjugation approaches. These are examples of reagent materials; a research-use catalogue listing does not establish regulatory approval for patient diagnosis or treatment, nor does it measure the value of finished medical instruments.
What products and regions are included in the market scope?
The market includes pure quantum-dot nanocrystals, dispersions, inks and functionalized materials sold into displays, medical and laboratory applications, solar research, sensors and other optical uses. Chemistry segmentation covers II-VI, III-V, perovskite, silicon, carbon and residual materials. Geography spans Asia-Pacific, Europe, North America, South America, and Middle East & Africa; finished displays, cameras and complete modules are excluded.
Research Sources & Evidence Base

Get Sample Report PDF for Exclusive Insights
Report Sample Includes
- Table of Contents
- List of Tables & Figures
- Charts, Research Methodology, and more...
 Download Sample Report PDF