MWIR Hyperspectral Remote Sensing Market Overview
MWIR Hyperspectral Remote Sensing a very high-speed, high sensitivity MWIR array, imaging spectrometer, integrated scanning system and vector processor, the SOC750-HB can acquire and process spectral imagery at a rate of 11 cubes (256 x 240 pixels x 42 bands) per second at 14-bit resolution. Lower spatial resolution cubes can be acquired at higher speeds. The system’s spectral response is medium wave-infrared from 2-5 microns.
This report provides a deep insight into the global MWIR Hyperspectral Remote Sensing market covering all its essential aspects. This ranges from a macro overview of the market to micro details of the market size, competitive landscape, development trend, niche market, key market drivers and challenges, SWOT analysis, value chain analysis, etc.
The analysis helps the reader to shape the competition within the industries and strategies for the competitive environment to enhance the potential profit. Furthermore, it provides a simple framework for evaluating and accessing the position of the business organization. The report structure also focuses on the competitive landscape of the Global MWIR Hyperspectral Remote Sensing Market, this report introduces in detail the market share, market performance, product situation, operation situation, etc. of the main players, which helps the readers in the industry to identify the main competitors and deeply understand the competition pattern of the market.
In a word, this report is a must-read for industry players, investors, researchers, consultants, business strategists, and all those who have any kind of stake or are planning to foray into the MWIR Hyperspectral Remote Sensing market in any manner.
MWIR Hyperspectral Remote Sensing Market Analysis:
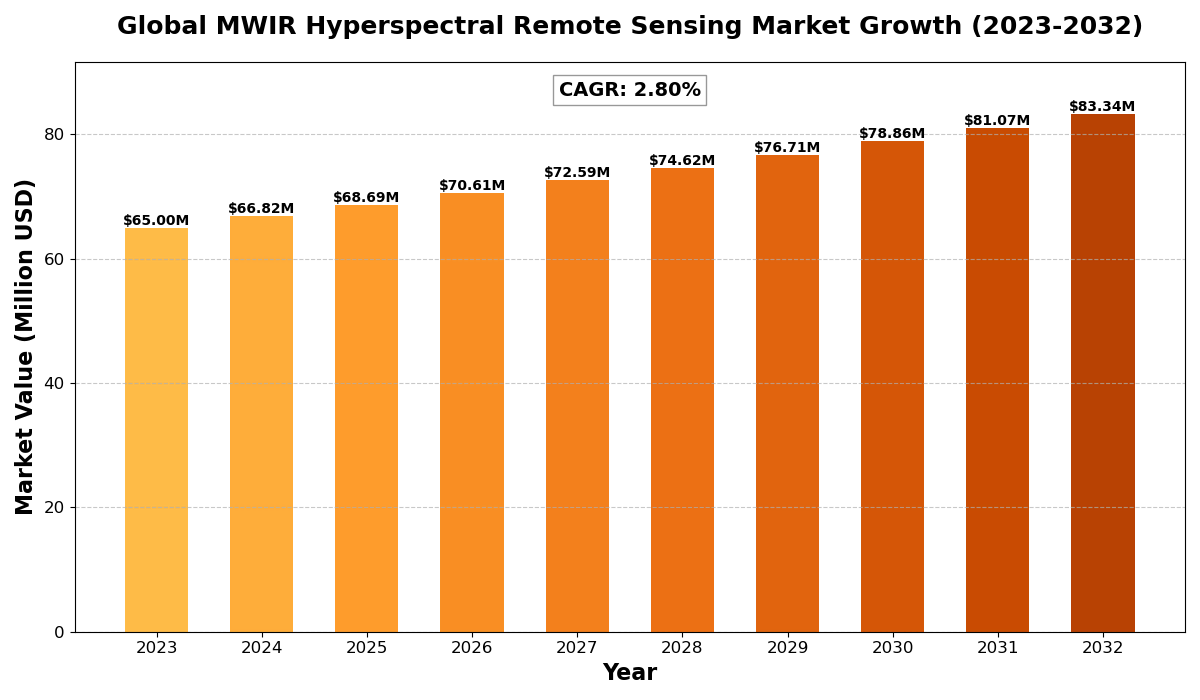
The Global MWIR Hyperspectral Remote Sensing Market size was estimated at USD 65 million in 2023 and is projected to reach USD 83.34 million by 2032, exhibiting a CAGR of 2.80% during the forecast period.
North America MWIR Hyperspectral Remote Sensing market size was estimated at USD 17.76 million in 2023, at a CAGR of 2.40% during the forecast period of 2025 through 2032.
MWIR Hyperspectral Remote Sensing Key Market Trends :
- Growing Demand in Defense and Security
Governments and defense organizations are increasingly adopting MWIR hyperspectral remote sensing for surveillance, reconnaissance, and threat detection, driving market growth. - Technological Advancements in Sensor Development
Continuous improvements in sensor resolution, data processing, and AI-driven analytics are enhancing the accuracy and efficiency of hyperspectral imaging. - Expanding Applications in Environmental Monitoring
Increased usage of MWIR hyperspectral remote sensing for climate change studies, disaster management, and pollution control is broadening market opportunities. - Rising Investments in Aerospace and Remote Sensing
Growing investments in satellite-based hyperspectral imaging and airborne remote sensing technologies are fueling market expansion. - Integration with AI and Big Data Analytics
The incorporation of artificial intelligence and big data analytics is revolutionizing hyperspectral data interpretation, improving decision-making in multiple industries.
MWIR Hyperspectral Remote Sensing Market Regional Analysis :

North America:
Strong demand driven by EVs, 5G infrastructure, and renewable energy, with the U.S. leading the market.
Europe:
Growth fueled by automotive electrification, renewable energy, and strong regulatory support, with Germany as a key player.
Asia-Pacific:
Dominates the market due to large-scale manufacturing in China and Japan, with growing demand from EVs, 5G, and semiconductors.
South America:
Emerging market, driven by renewable energy and EV adoption, with Brazil leading growth.
Middle East & Africa:
Gradual growth, mainly due to investments in renewable energy and EV infrastructure, with Saudi Arabia and UAE as key contributors.
MWIR Hyperspectral Remote Sensing Market Segmentation
The research report includes specific segments by region (country), manufacturers, Type, and Application. Market segmentation creates subsets of a market based on product type, end-user or application, Geographic, and other factors. By understanding the market segments, the decision-maker can leverage this targeting in the product, sales, and marketing strategies. Market segments can power your product development cycles by informing how you create product offerings for different segments.
Key Company
- Brimrose Corporation
- BaySpec
- XIMEA
- RIKOLA
- CI Systems
- Cubert GmbH
- Applied Infrared Sensing
- SPECIM
- Resonon
- Headwall
- Corning Incorporated
- ITRES
- Norsk Elektro Optikk
- Surface Optics Corp
- Telops
- Common Type
- Airborne Type
- Commercial Enterprises
- Defense Organizations
- Research Institutions
Drivers
- Increased Adoption in Military and Defense: The rising need for advanced surveillance, target detection, and border security solutions is propelling demand.
- Growing Use in Agriculture and Environmental Monitoring: MWIR hyperspectral imaging is gaining traction in precision agriculture, soil analysis, and forest monitoring.
- Advancements in Remote Sensing Technology: Innovations in spectral imaging, AI-driven analytics, and enhanced data processing capabilities are boosting market growth.
Restraints
- High Cost of Implementation: The initial investment and maintenance costs of MWIR hyperspectral remote sensing systems remain a significant challenge.
- Complexity in Data Processing and Interpretation: Handling vast amounts of hyperspectral data requires advanced expertise, posing operational difficulties.
- Limited Awareness and Adoption in Emerging Markets: Many developing regions lack awareness and infrastructure for MWIR hyperspectral imaging, restricting market penetration.
Opportunities
- Expanding Applications in Healthcare and Pharmaceuticals: MWIR hyperspectral imaging is finding new applications in medical diagnostics, tissue analysis, and drug development.
- Advancements in AI and Machine Learning: Integrating AI for faster and more accurate hyperspectral data analysis presents new growth opportunities.
- Increasing Government Investments in Space Research: Expanding satellite and space research projects using MWIR hyperspectral sensors create a lucrative market landscape.
Challenges
- Regulatory and Compliance Issues: Strict government regulations and compliance requirements can slow down market expansion.
- Technical Challenges in Miniaturization: The development of compact and lightweight MWIR hyperspectral sensors remains a significant hurdle.
- Data Security and Privacy Concerns: The collection and storage of hyperspectral data raise concerns about data protection and cybersecurity.
Key Benefits of This Market Research:
- Industry drivers, restraints, and opportunities covered in the study
- Neutral perspective on the market performance
- Recent industry trends and developments
- Competitive landscape & strategies of key players
- Potential & niche segments and regions exhibiting promising growth covered
- Historical, current, and projected market size, in terms of value
- In-depth analysis of the MWIR Hyperspectral Remote Sensing Market
- Overview of the regional outlook of the MWIR Hyperspectral Remote Sensing Market:
Key Reasons to Buy this Report:
- Access to date statistics compiled by our researchers. These provide you with historical and forecast data, which is analyzed to tell you why your market is set to change
- This enables you to anticipate market changes to remain ahead of your competitors
- You will be able to copy data from the Excel spreadsheet straight into your marketing plans, business presentations, or other strategic documents
- The concise analysis, clear graph, and table format will enable you to pinpoint the information you require quickly
- Provision of market value data for each segment and sub-segment
- Indicates the region and segment that is expected to witness the fastest growth as well as to dominate the market
- Provides insight into the market through Value Chain
- Market dynamics scenario, along with growth opportunities of the market in the years to come
- 6-month post-sales analyst support
Customization of the Report
In case of any queries or customization requirements, please connect with our sales team, who will ensure that your requirements are met.
FAQs
Q: What are the key driving factors and opportunities in the MWIR hyperspectral remote sensing market?
A: The key drivers include rising demand in defense, advancements in sensor technology, and expanding applications in environmental monitoring. Opportunities lie in AI integration, healthcare applications, and government investments in space research.
Q: Which region is projected to have the largest market share?
A: North America is expected to dominate the market due to strong defense investments, technological advancements, and a well-established aerospace industry.
Q: Who are the top players in the global MWIR hyperspectral remote sensing market?
A: Leading companies include Brimrose Corporation, BaySpec, XIMEA, Headwall, Corning Incorporated, SPECIM, and Telops.
Q: What are the latest technological advancements in the industry?
A: Innovations include AI-powered hyperspectral analysis, improved sensor resolution, real-time data processing, and miniaturized airborne hyperspectral imaging systems.
Q: What is the current size of the global MWIR hyperspectral remote sensing market?
A: The market was valued at USD 65 million in 2023 and is projected to reach USD 83.34 million by 2032, growing at a CAGR of 2.80%.

Get Sample Report PDF for Exclusive Insights
Report Sample Includes
- Table of Contents
- List of Tables & Figures
- Charts, Research Methodology, and more...