Global MTP Connectors Market, Trends, Business Strategies 2025-2032

Global MTP Connectors market size was estimated at USD 53 million in 2023 and is projected to reach USD 101.61 million by 2032, exhibiting a CAGR of 7.50% during the forecast period.

PDF Icon Download Sample Report PDF
  • Quick Dispatch

    All Orders

  • Secure Payment

    100% Secure Payment

Price range: $1,500.00 through $4,250.00

Clear

Multiaxial Optical Position Sensor Market Overview

MTP stands for Multi-fiber Termination Push-on connector. MTP connectors are engineered for high mechanical and optical specs.

This report provides a deep insight into the global MTP Connectors market covering all its essential aspects. This ranges from a macro overview of the market to micro details of the market size, competitive landscape, development trend, niche market, key market drivers and challenges, SWOT analysis, value chain analysis, etc.

The analysis helps the reader to shape the competition within the industries and strategies for the competitive environment to enhance the potential profit. Furthermore, it provides a simple framework for evaluating and accessing the position of the business organization. The report structure also focuses on the competitive landscape of the Global MTP Connectors Market, this report introduces in detail the market share, market performance, product situation, operation situation, etc. of the main players, which helps the readers in the industry to identify the main competitors and deeply understand the competition pattern of the market.
In a word, this report is a must-read for industry players, investors, researchers, consultants, business strategists, and all those who have any kind of stake or are planning to foray into the MTP Connectors market in any manner.

Multiaxial Optical Position Sensor Market Analysis:

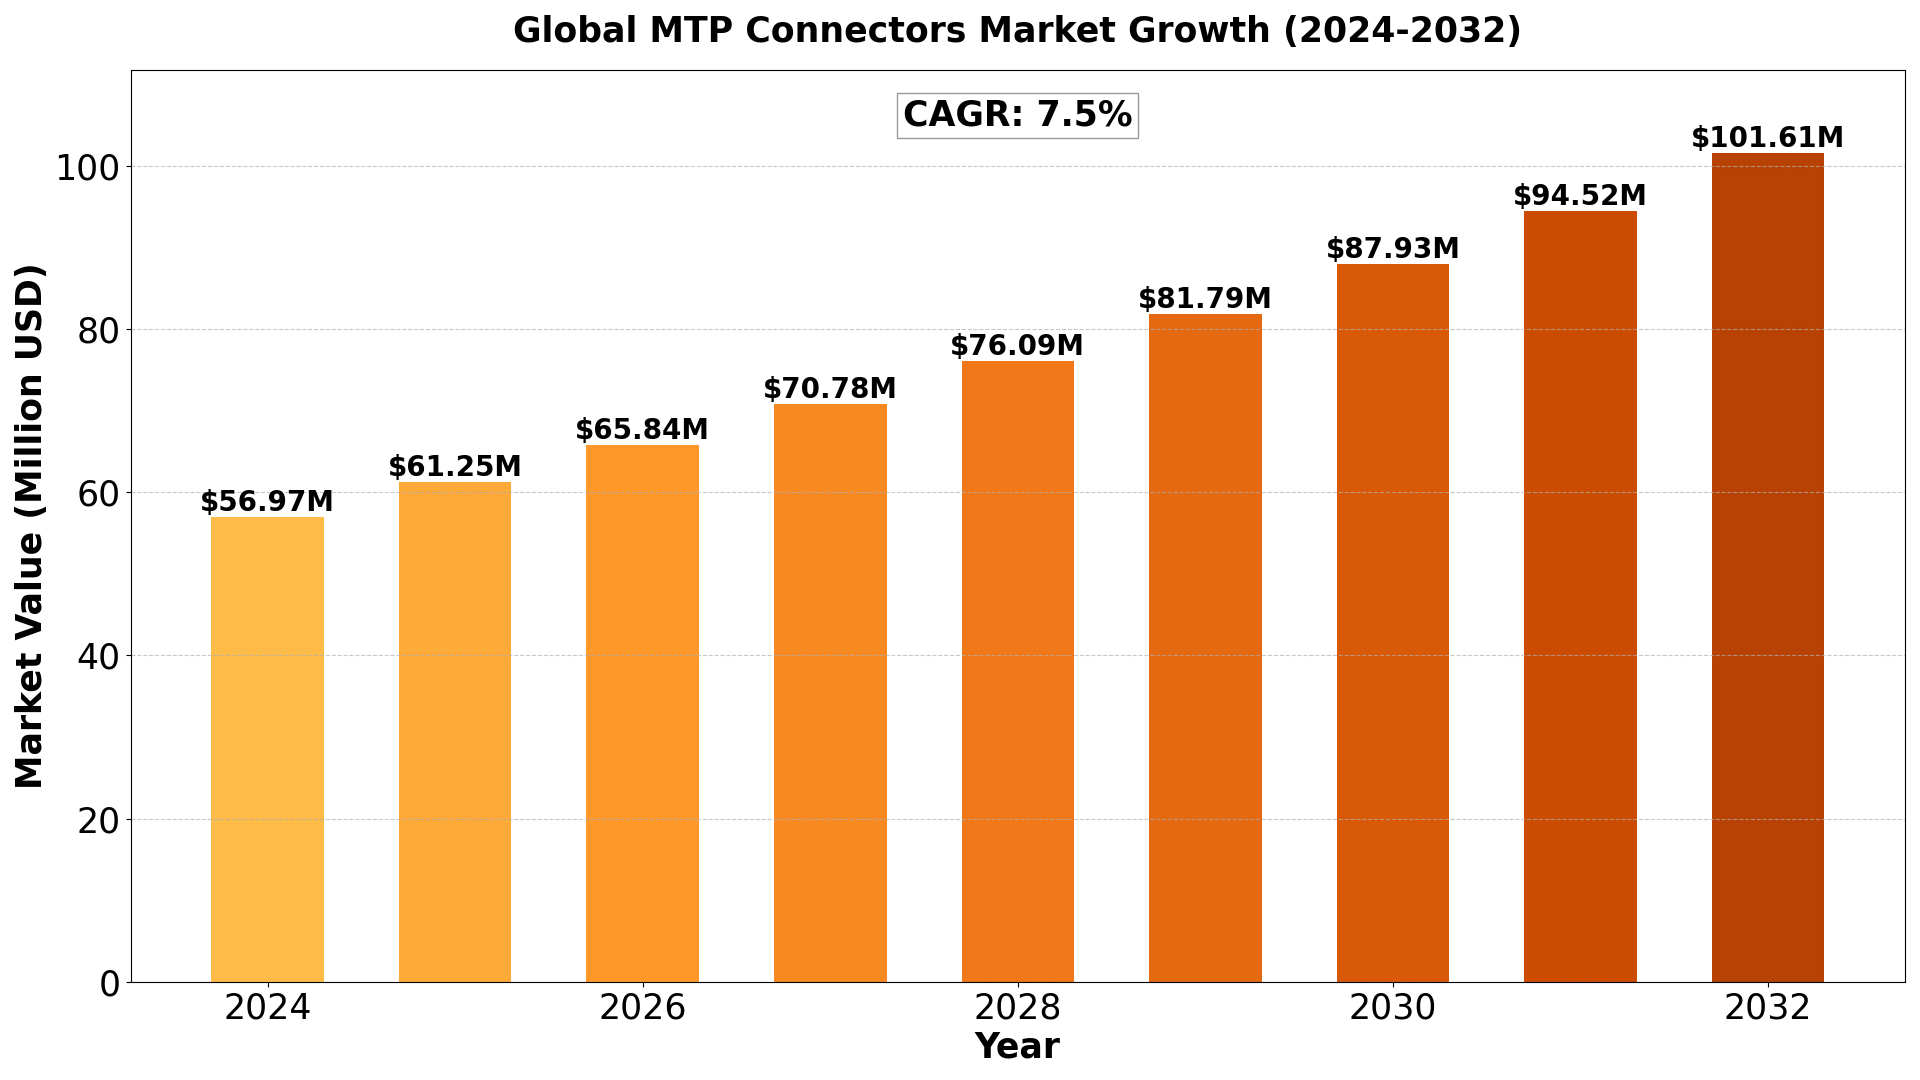
The global MTP Connectors market size was estimated at USD 53 million in 2023 and is projected to reach USD 101.61 million by 2032, exhibiting a CAGR of 7.50% during the forecast period.

North America MTP Connectors market size was estimated at USD 15.64 million in 2023, at a CAGR of 6.43% during the forecast period of 2025 through 2032.

Multiaxial Optical Position Sensor key  Market Trends  :

  1. Rising Demand for High-Speed Data Connectivity – The growing adoption of cloud computing, hyperscale data centers, and 5G networks is driving the need for MTP connectors.
  2. Expansion of Fiber Optic Communication Networks – Increasing investments in high-bandwidth optical networks for telecom and enterprise applications are fueling market growth.
  3. Advancements in Multi-Fiber Push-On (MPO) Technology – Innovations in fiber density, low-loss performance, and enhanced signal integrity are improving the efficiency of MTP connectors.
  4. Miniaturization and High-Density Cabling Solutions – The push for compact, high-performance cabling systems in data centers is accelerating MTP connector adoption.
  5. Integration with AI and Edge Computing – MTP connectors are playing a vital role in supporting the growing demand for high-speed, low-latency data processing.

Multiaxial Optical Position Sensor Market Regional Analysis :

semi insight

  • North America:Strong demand driven by EVs, 5G infrastructure, and renewable energy, with the U.S. leading the market.
  • Europe:Growth fueled by automotive electrification, renewable energy, and strong regulatory support, with Germany as a key player.
  • Asia-Pacific:Dominates the market due to large-scale manufacturing in China and Japan, with growing demand from EVs, 5G, and semiconductors.
  • South America:Emerging market, driven by renewable energy and EV adoption, with Brazil leading growth.
  • Middle East & Africa:Gradual growth, mainly due to investments in renewable energy and EV infrastructure, with Saudi Arabia and UAE as key contributors.

Multiaxial Optical Position Sensor Market Segmentation :

The research report includes specific segments by region (country), manufacturers, Type, and Application. Market segmentation creates subsets of a market based on product type, end-user or application, Geographic, and other factors. By understanding the market segments, the decision-maker can leverage this targeting in the product, sales, and marketing strategies. Market segments can power your product development cycles by informing how you create product offerings for different segments.
Key Company

  • US Conec
  • Amphenol
  • Suzhou Agix
  • Complete Connect
  • Longxing
  • Huber+Suhner

Market Segmentation (by Type)

  • Male Connector
  • Female Connector

Market Segmentation (by Application)

  • Data Centers
  • Telecommunications
  • Military/Aerospace
  • Others


Drivers

  • Surging Data Traffic and Bandwidth Needs – The exponential growth in digital services, video streaming, and IoT applications is fueling the demand for high-speed fiber optic networks.
  • Growth of 5G and Cloud Infrastructure – The rapid deployment of 5G networks and cloud-based services is driving the adoption of MTP connectors in network infrastructure.
  • Technological Innovations in Fiber Optics – Advances in fiber-optic transmission, connector durability, and efficiency are supporting market expansion.

Restraints

  • High Initial Deployment Costs – The cost of implementing MTP connectors, including fiber optic cabling and network upgrades, poses a challenge for some enterprises.
  • Complex Installation and Maintenance – The need for specialized knowledge and precision in fiber optic connections increases operational complexity.
  • Compatibility Issues with Legacy Systems – Upgrading to MTP-based infrastructure may require additional investment to ensure seamless integration with existing networks.

Opportunities

  • Expansion of Smart Cities and IoT Networks – The increasing use of fiber optics in smart infrastructure and IoT applications is opening new growth avenues.
  • Development of Next-Gen Data Centers – The need for high-speed, low-latency connectivity in modern data centers is driving innovation in MTP connector solutions.
  • Rising Adoption in Automotive and Aerospace Industries – MTP connectors are gaining traction in high-speed communication systems for automotive and aerospace applications.

Challenges

  • Ensuring Signal Integrity in High-Density Environments – Maintaining performance and reducing signal loss in high-density fiber networks remain key challenges.
  • Intense Market Competition – The presence of multiple fiber optic connector manufacturers creates pricing pressures and product differentiation challenges.
  • Stringent Industry Standards and Regulations – Compliance with evolving telecom and data center regulations requires continuous product enhancements.

Key Benefits of This Market Research:

  • Industry drivers, restraints, and opportunities covered in the study
  • Neutral perspective on the market performance
  • Recent industry trends and developments
  • Competitive landscape & strategies of key players
  • Potential & niche segments and regions exhibiting promising growth covered
  • Historical, current, and projected market size, in terms of value
  • In-depth analysis of the Multiaxial Optical Position Sensor Markett
  • Overview of the regional outlook of the Multiaxial Optical Position Sensor Markett:

Key Reasons to Buy this Report:

  • Access to date statistics compiled by our researchers. These provide you with historical and forecast data, which is analyzed to tell you why your market is set to change
  • This enables you to anticipate market changes to remain ahead of your competitors
  • You will be able to copy data from the Excel spreadsheet straight into your marketing plans, business presentations, or other strategic documents
  • The concise analysis, clear graph, and table format will enable you to pinpoint the information you require quickly
  • Provision of market value data for each segment and sub-segment
  • Indicates the region and segment that is expected to witness the fastest growth as well as to dominate the market
  • Provides insight into the market through Value Chain
  • Market dynamics scenario, along with growth opportunities of the market in the years to come
  • 6-month post-sales analyst support

Customization of the Report
In case of any queries or customization requirements, please connect with our sales team, who will ensure that your requirements are met.

FAQs


Q: What are the key factors driving the MTP connectors market?
A: The rising demand for high-speed data transmission, expansion of fiber optic communication networks, and advancements in MPO technology are key drivers.


Q: Which industries are the major adopters of MTP connectors?
A: The telecom, data center, cloud computing, and IT infrastructure industries are the primary users of MTP connectors.


Q: What are the challenges associated with MTP connector deployment?
A: High initial costs, complex installation, and compatibility issues with legacy systems pose challenges to widespread adoption.


Q: What are the latest innovations in MTP connectors?
A: Recent advancements include ultra-low-loss connectors, high-density solutions for data centers, and AI-integrated optical networking systems.


Q: Which regions are expected to lead the MTP connectors market?
A: North America and Asia-Pacific are expected to dominate the market, driven by rapid growth in data centers and 5G infrastructure.

Global MTP Connectors Market, Trends, Business Strategies 2025-2032

Get Sample Report PDF for Exclusive Insights

Report Sample Includes

  • Table of Contents
  • List of Tables & Figures
  • Charts, Research Methodology, and more...
PDF Icon Download Sample Report PDF

Download Sample Report

Table of Content

Table of Contents
1 Research Methodology and Statistical Scope
1.1 Market Definition and Statistical Scope of MTP Connectors
1.2 Key Market Segments
1.2.1 MTP Connectors Segment by Type
1.2.2 MTP Connectors Segment by Application
1.3 Methodology & Sources of Information
1.3.1 Research Methodology
1.3.2 Research Process
1.3.3 Market Breakdown and Data Triangulation
1.3.4 Base Year
1.3.5 Report Assumptions & Caveats
2 MTP Connectors Market Overview
2.1 Global Market Overview
2.1.1 Global MTP Connectors Market Size (M USD) Estimates and Forecasts (2019-2032)
2.1.2 Global MTP Connectors Sales Estimates and Forecasts (2019-2032)
2.2 Market Segment Executive Summary
2.3 Global Market Size by Region
3 MTP Connectors Market Competitive Landscape
3.1 Global MTP Connectors Sales by Manufacturers (2019-2025)
3.2 Global MTP Connectors Revenue Market Share by Manufacturers (2019-2025)
3.3 MTP Connectors Market Share by Company Type (Tier 1, Tier 2, and Tier 3)
3.4 Global MTP Connectors Average Price by Manufacturers (2019-2025)
3.5 Manufacturers MTP Connectors Sales Sites, Area Served, Product Type
3.6 MTP Connectors Market Competitive Situation and Trends
3.6.1 MTP Connectors Market Concentration Rate
3.6.2 Global 5 and 10 Largest MTP Connectors Players Market Share by Revenue
3.6.3 Mergers & Acquisitions, Expansion
4 MTP Connectors Industry Chain Analysis
4.1 MTP Connectors Industry Chain Analysis
4.2 Market Overview of Key Raw Materials
4.3 Midstream Market Analysis
4.4 Downstream Customer Analysis
5 The Development and Dynamics of MTP Connectors Market
5.1 Key Development Trends
5.2 Driving Factors
5.3 Market Challenges
5.4 Market Restraints
5.5 Industry News
5.5.1 New Product Developments
5.5.2 Mergers & Acquisitions
5.5.3 Expansions
5.5.4 Collaboration/Supply Contracts
5.6 Industry Policies
6 MTP Connectors Market Segmentation by Type
6.1 Evaluation Matrix of Segment Market Development Potential (Type)
6.2 Global MTP Connectors Sales Market Share by Type (2019-2025)
6.3 Global MTP Connectors Market Size Market Share by Type (2019-2025)
6.4 Global MTP Connectors Price by Type (2019-2025)
7 MTP Connectors Market Segmentation by Application
7.1 Evaluation Matrix of Segment Market Development Potential (Application)
7.2 Global MTP Connectors Market Sales by Application (2019-2025)
7.3 Global MTP Connectors Market Size (M USD) by Application (2019-2025)
7.4 Global MTP Connectors Sales Growth Rate by Application (2019-2025)
8 MTP Connectors Market Consumption by Region
8.1 Global MTP Connectors Sales by Region
8.1.1 Global MTP Connectors Sales by Region
8.1.2 Global MTP Connectors Sales Market Share by Region
8.2 North America
8.2.1 North America MTP Connectors Sales by Country
8.2.2 U.S.
8.2.3 Canada
8.2.4 Mexico
8.3 Europe
8.3.1 Europe MTP Connectors Sales by Country
8.3.2 Germany
8.3.3 France
8.3.4 U.K.
8.3.5 Italy
8.3.6 Russia
8.4 Asia Pacific
8.4.1 Asia Pacific MTP Connectors Sales by Region
8.4.2 China
8.4.3 Japan
8.4.4 South Korea
8.4.5 India
8.4.6 Southeast Asia
8.5 South America
8.5.1 South America MTP Connectors Sales by Country
8.5.2 Brazil
8.5.3 Argentina
8.5.4 Columbia
8.6 Middle East and Africa
8.6.1 Middle East and Africa MTP Connectors Sales by Region
8.6.2 Saudi Arabia
8.6.3 UAE
8.6.4 Egypt
8.6.5 Nigeria
8.6.6 South Africa
9 MTP Connectors Market Production by Region
9.1 Global Production of MTP Connectors by Region (2019-2025)
9.2 Global MTP Connectors Revenue Market Share by Region (2019-2025)
9.3 Global MTP Connectors Production, Revenue, Price and Gross Margin (2019-2025)
9.4 North America MTP Connectors Production
9.4.1 North America MTP Connectors Production Growth Rate (2019-2025)
9.4.2 North America MTP Connectors Production, Revenue, Price and Gross Margin (2019-2025)
9.5 Europe MTP Connectors Production
9.5.1 Europe MTP Connectors Production Growth Rate (2019-2025)
9.5.2 Europe MTP Connectors Production, Revenue, Price and Gross Margin (2019-2025)
9.6 Japan MTP Connectors Production (2019-2025)
9.6.1 Japan MTP Connectors Production Growth Rate (2019-2025)
9.6.2 Japan MTP Connectors Production, Revenue, Price and Gross Margin (2019-2025)
9.7 China MTP Connectors Production (2019-2025)
9.7.1 China MTP Connectors Production Growth Rate (2019-2025)
9.7.2 China MTP Connectors Production, Revenue, Price and Gross Margin (2019-2025)
10 Key Companies Profile
10.1 US Conec
10.1.1 US Conec MTP Connectors Basic Information
10.1.2 US Conec MTP Connectors Product Overview
10.1.3 US Conec MTP Connectors Product Market Performance
10.1.4 US Conec Business Overview
10.1.5 US Conec MTP Connectors SWOT Analysis
10.1.6 US Conec Recent Developments
10.2 Amphenol
10.2.1 Amphenol MTP Connectors Basic Information
10.2.2 Amphenol MTP Connectors Product Overview
10.2.3 Amphenol MTP Connectors Product Market Performance
10.2.4 Amphenol Business Overview
10.2.5 Amphenol MTP Connectors SWOT Analysis
10.2.6 Amphenol Recent Developments
10.3 Suzhou Agix
10.3.1 Suzhou Agix MTP Connectors Basic Information
10.3.2 Suzhou Agix MTP Connectors Product Overview
10.3.3 Suzhou Agix MTP Connectors Product Market Performance
10.3.4 Suzhou Agix MTP Connectors SWOT Analysis
10.3.5 Suzhou Agix Business Overview
10.3.6 Suzhou Agix Recent Developments
10.4 Complete Connect
10.4.1 Complete Connect MTP Connectors Basic Information
10.4.2 Complete Connect MTP Connectors Product Overview
10.4.3 Complete Connect MTP Connectors Product Market Performance
10.4.4 Complete Connect Business Overview
10.4.5 Complete Connect Recent Developments
10.5 Longxing
10.5.1 Longxing MTP Connectors Basic Information
10.5.2 Longxing MTP Connectors Product Overview
10.5.3 Longxing MTP Connectors Product Market Performance
10.5.4 Longxing Business Overview
10.5.5 Longxing Recent Developments
10.6 Huber+Suhner
10.6.1 Huber+Suhner MTP Connectors Basic Information
10.6.2 Huber+Suhner MTP Connectors Product Overview
10.6.3 Huber+Suhner MTP Connectors Product Market Performance
10.6.4 Huber+Suhner Business Overview
10.6.5 Huber+Suhner Recent Developments
11 MTP Connectors Market Forecast by Region
11.1 Global MTP Connectors Market Size Forecast
11.2 Global MTP Connectors Market Forecast by Region
11.2.1 North America Market Size Forecast by Country
11.2.2 Europe MTP Connectors Market Size Forecast by Country
11.2.3 Asia Pacific MTP Connectors Market Size Forecast by Region
11.2.4 South America MTP Connectors Market Size Forecast by Country
11.2.5 Middle East and Africa Forecasted Consumption of MTP Connectors by Country
12 Forecast Market by Type and by Application (2025-2032)
12.1 Global MTP Connectors Market Forecast by Type (2025-2032)
12.1.1 Global Forecasted Sales of MTP Connectors by Type (2025-2032)
12.1.2 Global MTP Connectors Market Size Forecast by Type (2025-2032)
12.1.3 Global Forecasted Price of MTP Connectors by Type (2025-2032)
12.2 Global MTP Connectors Market Forecast by Application (2025-2032)
12.2.1 Global MTP Connectors Sales (K Units) Forecast by Application
12.2.2 Global MTP Connectors Market Size (M USD) Forecast by Application (2025-2032)
13 Conclusion and Key FindingsList of Tables
Table 1. Introduction of the Type
Table 2. Introduction of the Application
Table 3. Market Size (M USD) Segment Executive Summary
Table 4. MTP Connectors Market Size Comparison by Region (M USD)
Table 5. Global MTP Connectors Sales (K Units) by Manufacturers (2019-2025)
Table 6. Global MTP Connectors Sales Market Share by Manufacturers (2019-2025)
Table 7. Global MTP Connectors Revenue (M USD) by Manufacturers (2019-2025)
Table 8. Global MTP Connectors Revenue Share by Manufacturers (2019-2025)
Table 9. Company Type (Tier 1, Tier 2, and Tier 3) & (based on the Revenue in MTP Connectors as of 2022)
Table 10. Global Market MTP Connectors Average Price (USD/Unit) of Key Manufacturers (2019-2025)
Table 11. Manufacturers MTP Connectors Sales Sites and Area Served
Table 12. Manufacturers MTP Connectors Product Type
Table 13. Global MTP Connectors Manufacturers Market Concentration Ratio (CR5 and HHI)
Table 14. Mergers & Acquisitions, Expansion Plans
Table 15. Industry Chain Map of MTP Connectors
Table 16. Market Overview of Key Raw Materials
Table 17. Midstream Market Analysis
Table 18. Downstream Customer Analysis
Table 19. Key Development Trends
Table 20. Driving Factors
Table 21. MTP Connectors Market Challenges
Table 22. Global MTP Connectors Sales by Type (K Units)
Table 23. Global MTP Connectors Market Size by Type (M USD)
Table 24. Global MTP Connectors Sales (K Units) by Type (2019-2025)
Table 25. Global MTP Connectors Sales Market Share by Type (2019-2025)
Table 26. Global MTP Connectors Market Size (M USD) by Type (2019-2025)
Table 27. Global MTP Connectors Market Size Share by Type (2019-2025)
Table 28. Global MTP Connectors Price (USD/Unit) by Type (2019-2025)
Table 29. Global MTP Connectors Sales (K Units) by Application
Table 30. Global MTP Connectors Market Size by Application
Table 31. Global MTP Connectors Sales by Application (2019-2025) & (K Units)
Table 32. Global MTP Connectors Sales Market Share by Application (2019-2025)
Table 33. Global MTP Connectors Sales by Application (2019-2025) & (M USD)
Table 34. Global MTP Connectors Market Share by Application (2019-2025)
Table 35. Global MTP Connectors Sales Growth Rate by Application (2019-2025)
Table 36. Global MTP Connectors Sales by Region (2019-2025) & (K Units)
Table 37. Global MTP Connectors Sales Market Share by Region (2019-2025)
Table 38. North America MTP Connectors Sales by Country (2019-2025) & (K Units)
Table 39. Europe MTP Connectors Sales by Country (2019-2025) & (K Units)
Table 40. Asia Pacific MTP Connectors Sales by Region (2019-2025) & (K Units)
Table 41. South America MTP Connectors Sales by Country (2019-2025) & (K Units)
Table 42. Middle East and Africa MTP Connectors Sales by Region (2019-2025) & (K Units)
Table 43. Global MTP Connectors Production (K Units) by Region (2019-2025)
Table 44. Global MTP Connectors Revenue (US$ Million) by Region (2019-2025)
Table 45. Global MTP Connectors Revenue Market Share by Region (2019-2025)
Table 46. Global MTP Connectors Production (K Units), Revenue (US$ Million), Price (USD/Unit) and Gross Margin (2019-2025)
Table 47. North America MTP Connectors Production (K Units), Revenue (US$ Million), Price (USD/Unit) and Gross Margin (2019-2025)
Table 48. Europe MTP Connectors Production (K Units), Revenue (US$ Million), Price (USD/Unit) and Gross Margin (2019-2025)
Table 49. Japan MTP Connectors Production (K Units), Revenue (US$ Million), Price (USD/Unit) and Gross Margin (2019-2025)
Table 50. China MTP Connectors Production (K Units), Revenue (US$ Million), Price (USD/Unit) and Gross Margin (2019-2025)
Table 51. US Conec MTP Connectors Basic Information
Table 52. US Conec MTP Connectors Product Overview
Table 53. US Conec MTP Connectors Sales (K Units), Revenue (M USD), Price (USD/Unit) and Gross Margin (2019-2025)
Table 54. US Conec Business Overview
Table 55. US Conec MTP Connectors SWOT Analysis
Table 56. US Conec Recent Developments
Table 57. Amphenol MTP Connectors Basic Information
Table 58. Amphenol MTP Connectors Product Overview
Table 59. Amphenol MTP Connectors Sales (K Units), Revenue (M USD), Price (USD/Unit) and Gross Margin (2019-2025)
Table 60. Amphenol Business Overview
Table 61. Amphenol MTP Connectors SWOT Analysis
Table 62. Amphenol Recent Developments
Table 63. Suzhou Agix MTP Connectors Basic Information
Table 64. Suzhou Agix MTP Connectors Product Overview
Table 65. Suzhou Agix MTP Connectors Sales (K Units), Revenue (M USD), Price (USD/Unit) and Gross Margin (2019-2025)
Table 66. Suzhou Agix MTP Connectors SWOT Analysis
Table 67. Suzhou Agix Business Overview
Table 68. Suzhou Agix Recent Developments
Table 69. Complete Connect MTP Connectors Basic Information
Table 70. Complete Connect MTP Connectors Product Overview
Table 71. Complete Connect MTP Connectors Sales (K Units), Revenue (M USD), Price (USD/Unit) and Gross Margin (2019-2025)
Table 72. Complete Connect Business Overview
Table 73. Complete Connect Recent Developments
Table 74. Longxing MTP Connectors Basic Information
Table 75. Longxing MTP Connectors Product Overview
Table 76. Longxing MTP Connectors Sales (K Units), Revenue (M USD), Price (USD/Unit) and Gross Margin (2019-2025)
Table 77. Longxing Business Overview
Table 78. Longxing Recent Developments
Table 79. Huber+Suhner MTP Connectors Basic Information
Table 80. Huber+Suhner MTP Connectors Product Overview
Table 81. Huber+Suhner MTP Connectors Sales (K Units), Revenue (M USD), Price (USD/Unit) and Gross Margin (2019-2025)
Table 82. Huber+Suhner Business Overview
Table 83. Huber+Suhner Recent Developments
Table 84. Global MTP Connectors Sales Forecast by Region (2025-2032) & (K Units)
Table 85. Global MTP Connectors Market Size Forecast by Region (2025-2032) & (M USD)
Table 86. North America MTP Connectors Sales Forecast by Country (2025-2032) & (K Units)
Table 87. North America MTP Connectors Market Size Forecast by Country (2025-2032) & (M USD)
Table 88. Europe MTP Connectors Sales Forecast by Country (2025-2032) & (K Units)
Table 89. Europe MTP Connectors Market Size Forecast by Country (2025-2032) & (M USD)
Table 90. Asia Pacific MTP Connectors Sales Forecast by Region (2025-2032) & (K Units)
Table 91. Asia Pacific MTP Connectors Market Size Forecast by Region (2025-2032) & (M USD)
Table 92. South America MTP Connectors Sales Forecast by Country (2025-2032) & (K Units)
Table 93. South America MTP Connectors Market Size Forecast by Country (2025-2032) & (M USD)
Table 94. Middle East and Africa MTP Connectors Consumption Forecast by Country (2025-2032) & (Units)
Table 95. Middle East and Africa MTP Connectors Market Size Forecast by Country (2025-2032) & (M USD)
Table 96. Global MTP Connectors Sales Forecast by Type (2025-2032) & (K Units)
Table 97. Global MTP Connectors Market Size Forecast by Type (2025-2032) & (M USD)
Table 98. Global MTP Connectors Price Forecast by Type (2025-2032) & (USD/Unit)
Table 99. Global MTP Connectors Sales (K Units) Forecast by Application (2025-2032)
Table 100. Global MTP Connectors Market Size Forecast by Application (2025-2032) & (M USD)
List of Figures
Figure 1. Product Picture of MTP Connectors
Figure 2. Data Triangulation
Figure 3. Key Caveats
Figure 4. Global MTP Connectors Market Size (M USD), 2019-2032
Figure 5. Global MTP Connectors Market Size (M USD) (2019-2032)
Figure 6. Global MTP Connectors Sales (K Units) & (2019-2032)
Figure 7. Evaluation Matrix of Segment Market Development Potential (Type)
Figure 8. Evaluation Matrix of Segment Market Development Potential (Application)
Figure 9. Evaluation Matrix of Regional Market Development Potential
Figure 10. MTP Connectors Market Size by Country (M USD)
Figure 11. MTP Connectors Sales Share by Manufacturers in 2023
Figure 12. Global MTP Connectors Revenue Share by Manufacturers in 2023
Figure 13. MTP Connectors Market Share by Company Type (Tier 1, Tier 2 and Tier 3): 2023
Figure 14. Global Market MTP Connectors Average Price (USD/Unit) of Key Manufacturers in 2023
Figure 15. The Global 5 and 10 Largest Players: Market Share by MTP Connectors Revenue in 2023
Figure 16. Evaluation Matrix of Segment Market Development Potential (Type)
Figure 17. Global MTP Connectors Market Share by Type
Figure 18. Sales Market Share of MTP Connectors by Type (2019-2025)
Figure 19. Sales Market Share of MTP Connectors by Type in 2023
Figure 20. Market Size Share of MTP Connectors by Type (2019-2025)
Figure 21. Market Size Market Share of MTP Connectors by Type in 2023
Figure 22. Evaluation Matrix of Segment Market Development Potential (Application)
Figure 23. Global MTP Connectors Market Share by Application
Figure 24. Global MTP Connectors Sales Market Share by Application (2019-2025)
Figure 25. Global MTP Connectors Sales Market Share by Application in 2023
Figure 26. Global MTP Connectors Market Share by Application (2019-2025)
Figure 27. Global MTP Connectors Market Share by Application in 2023
Figure 28. Global MTP Connectors Sales Growth Rate by Application (2019-2025)
Figure 29. Global MTP Connectors Sales Market Share by Region (2019-2025)
Figure 30. North America MTP Connectors Sales and Growth Rate (2019-2025) & (K Units)
Figure 31. North America MTP Connectors Sales Market Share by Country in 2023
Figure 32. U.S. MTP Connectors Sales and Growth Rate (2019-2025) & (K Units)
Figure 33. Canada MTP Connectors Sales (K Units) and Growth Rate (2019-2025)
Figure 34. Mexico MTP Connectors Sales (Units) and Growth Rate (2019-2025)
Figure 35. Europe MTP Connectors Sales and Growth Rate (2019-2025) & (K Units)
Figure 36. Europe MTP Connectors Sales Market Share by Country in 2023
Figure 37. Germany MTP Connectors Sales and Growth Rate (2019-2025) & (K Units)
Figure 38. France MTP Connectors Sales and Growth Rate (2019-2025) & (K Units)
Figure 39. U.K. MTP Connectors Sales and Growth Rate (2019-2025) & (K Units)
Figure 40. Italy MTP Connectors Sales and Growth Rate (2019-2025) & (K Units)
Figure 41. Russia MTP Connectors Sales and Growth Rate (2019-2025) & (K Units)
Figure 42. Asia Pacific MTP Connectors Sales and Growth Rate (K Units)
Figure 43. Asia Pacific MTP Connectors Sales Market Share by Region in 2023
Figure 44. China MTP Connectors Sales and Growth Rate (2019-2025) & (K Units)
Figure 45. Japan MTP Connectors Sales and Growth Rate (2019-2025) & (K Units)
Figure 46. South Korea MTP Connectors Sales and Growth Rate (2019-2025) & (K Units)
Figure 47. India MTP Connectors Sales and Growth Rate (2019-2025) & (K Units)
Figure 48. Southeast Asia MTP Connectors Sales and Growth Rate (2019-2025) & (K Units)
Figure 49. South America MTP Connectors Sales and Growth Rate (K Units)
Figure 50. South America MTP Connectors Sales Market Share by Country in 2023
Figure 51. Brazil MTP Connectors Sales and Growth Rate (2019-2025) & (K Units)
Figure 52. Argentina MTP Connectors Sales and Growth Rate (2019-2025) & (K Units)
Figure 53. Columbia MTP Connectors Sales and Growth Rate (2019-2025) & (K Units)
Figure 54. Middle East and Africa MTP Connectors Sales and Growth Rate (K Units)
Figure 55. Middle East and Africa MTP Connectors Sales Market Share by Region in 2023
Figure 56. Saudi Arabia MTP Connectors Sales and Growth Rate (2019-2025) & (K Units)
Figure 57. UAE MTP Connectors Sales and Growth Rate (2019-2025) & (K Units)
Figure 58. Egypt MTP Connectors Sales and Growth Rate (2019-2025) & (K Units)
Figure 59. Nigeria MTP Connectors Sales and Growth Rate (2019-2025) & (K Units)
Figure 60. South Africa MTP Connectors Sales and Growth Rate (2019-2025) & (K Units)
Figure 61. Global MTP Connectors Production Market Share by Region (2019-2025)
Figure 62. North America MTP Connectors Production (K Units) Growth Rate (2019-2025)
Figure 63. Europe MTP Connectors Production (K Units) Growth Rate (2019-2025)
Figure 64. Japan MTP Connectors Production (K Units) Growth Rate (2019-2025)
Figure 65. China MTP Connectors Production (K Units) Growth Rate (2019-2025)
Figure 66. Global MTP Connectors Sales Forecast by Volume (2019-2032) & (K Units)
Figure 67. Global MTP Connectors Market Size Forecast by Value (2019-2032) & (M USD)
Figure 68. Global MTP Connectors Sales Market Share Forecast by Type (2025-2032)
Figure 69. Global MTP Connectors Market Share Forecast by Type (2025-2032)
Figure 70. Global MTP Connectors Sales Forecast by Application (2025-2032)
Figure 71. Global MTP Connectors Market Share Forecast by Application (2025-2032)