Global MO (Metal Organic) Source Market, Size, Trends, Business Strategies 2025-2032

The MO (Metal Organic) Source Market size was estimated at USD 143.30 million in 2023 and is projected to reach USD 440.87 million by 2032, exhibiting a CAGR of 13.30% during the forecast period.

PDF Icon Download Sample Report PDF
  • Quick Dispatch

    All Orders

  • Secure Payment

    100% Secure Payment

Compare

$1,500.00$4,250.00

Clear

MO (Metal Organic) Source Market Overview

Metal Organic (MO) source also known as high-purity metal organic compound, is a class of chemical compounds that contain metals and organic ligands, which confer solubility in organic solvents or volatility. MO source is a key raw material for producing semiconductor microstructure materials by use of MOVCD technology. Widely used in the production of LEDs, solar cells as well as other applications.

This report provides a deep insight into the global MO (Metal Organic) Source market covering all its essential aspects. This ranges from a macro overview of the market to micro details of the market size, competitive landscape, development trend, niche market, key market drivers and challenges, SWOT analysis, value chain analysis, etc.

The analysis helps the reader to shape the competition within the industries and strategies for the competitive environment to enhance the potential profit. Furthermore, it provides a simple framework for evaluating and accessing the position of the business organization. The report structure also focuses on the competitive landscape of the Global MO (Metal Organic) Source Market, this report introduces in detail the market share, market performance, product situation, operation situation, etc. of the main players, which helps the readers in the industry to identify the main competitors and deeply understand the competition pattern of the market.
In a word, this report is a must-read for industry players, investors, researchers, consultants, business strategists, and all those who have any kind of stake or are planning to foray into the MO (Metal Organic) Source market in any manner.

MO (Metal Organic) Source Market Analysis:

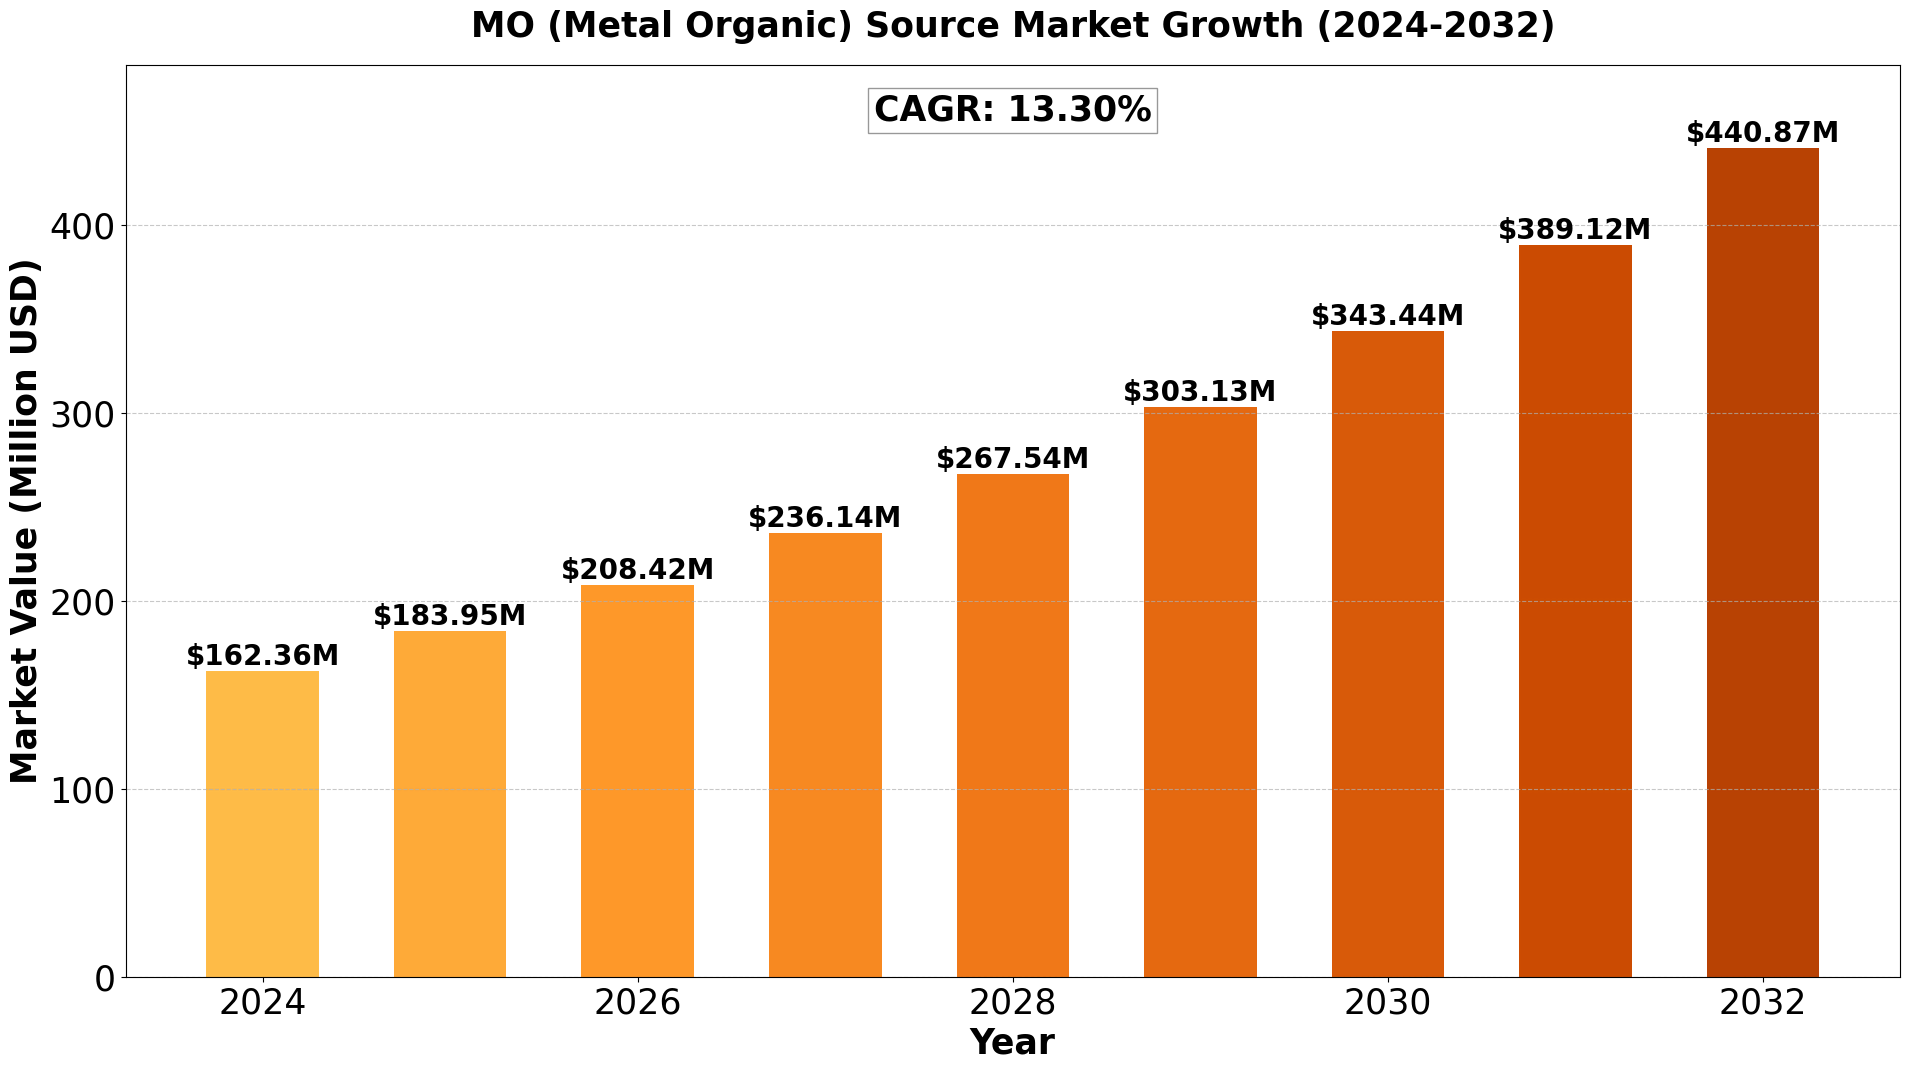
The Global MO (Metal Organic) Source Market size was estimated at USD 143.30 million in 2023 and is projected to reach USD 440.87 million by 2032, exhibiting a CAGR of 13.30% during the forecast period.

North America MO (Metal Organic) Source market size was estimated at USD 46.34 million in 2023, at a CAGR of 11.40% during the forecast period of 2025 through 2032.


MO (Metal Organic) Source Key Market Trends  :

  1. Growing Demand for LEDs
    The increasing adoption of energy-efficient lighting solutions is driving the demand for MO sources, particularly in LED manufacturing.

  2. Rising Adoption in Semiconductor Applications
    The semiconductor industry’s growth, including memory chips and laser technology, is boosting the demand for high-purity MO compounds.

  3. Expanding Solar Energy Sector
    With a rising focus on renewable energy, MO sources are witnessing increased use in solar cell production.

  4. Technological Advancements in MOVCD Technology
    Continuous innovations in Metal-Organic Vapor Phase Deposition (MOVCD) technology are improving efficiency and material performance.

  5. Surging Investments in Asia-Pacific
    The Asia-Pacific region is experiencing rapid industrialization and government initiatives, making it a major hub for MO source production.

MO (Metal Organic) Source Market Regional Analysis :

semi insight

  • North America:

    Strong demand driven by EVs, 5G infrastructure, and renewable energy, with the U.S. leading the market.

  • Europe:

    Growth fueled by automotive electrification, renewable energy, and strong regulatory support, with Germany as a key player.

  • Asia-Pacific:

    Dominates the market due to large-scale manufacturing in China and Japan, with growing demand from EVs, 5G, and semiconductors.

  • South America:

    Emerging market, driven by renewable energy and EV adoption, with Brazil leading growth.

  • Middle East & Africa:

    Gradual growth, mainly due to investments in renewable energy and EV infrastructure, with Saudi Arabia and UAE as key contributors.

MO (Metal Organic) Source Market Segmentation :

The research report includes specific segments by region (country), manufacturers, Type, and Application. Market segmentation creates subsets of a market based on product type, end-user or application, Geographic, and other factors. By understanding the market segments, the decision-maker can leverage this targeting in the product, sales, and marketing strategies. Market segments can power your product development cycles by informing how you create product offerings for different segments.
Key Company

  • Nata Opto-electronic
  • SAFC Hitech
  • AkzoNobel (Nouryon)
  • Jiang Xi Jia Yin Opt-Electronic
  • Albemarle
  • Chemtura
  • Sumitomo Chemical
  • Ube Industries
  • Lake Materials
  • ARGOSUN MO
  • Suzhou Pure Opto-Electronic
  • Entegris
  • Inc

Market Segmentation (by Type)

  • Trimethylgallium (TMGa)
  • Triethylgallium (TEGa)
  • Trimethylindium (TMIn)
  • Trimethylaluminium (TMAl)
  • Other MO Sources

Market Segmentation (by Application)

  • LED Industry
  • Solar Cell
  • Phase Change Memory
  • Semiconductor Laser
  • Others

Drivers

  • Expanding Semiconductor Industry
    The demand for high-performance chips in electronics, AI, and IoT is propelling MO source adoption.
  • Growth in LED and Solar Cell Manufacturing
    Rising global energy efficiency standards and increasing solar panel installations are fueling market growth.
  • Advancements in Deposition Technologies
    Innovations in MOVCD and other deposition techniques enhance the efficiency and quality of semiconductor materials.

Restraints

  • High Production Costs
    The complexity and high cost of manufacturing MO sources pose a challenge to market expansion.
  • Environmental and Regulatory Concerns
    Stringent regulations on chemical handling and emissions impact production processes.
  • Limited Availability of Raw Materials
    The scarcity of certain metals used in MO sources affects supply chains and pricing.

Opportunities

  • Increasing Investments in Semiconductor R&D
    Continuous research and development efforts are creating new opportunities for improved MO sources.
  • Expansion in Emerging Markets
    Countries like India, Brazil, and Southeast Asian nations are becoming key markets for MO source applications.
  • Integration with Advanced Technologies
    The combination of MO sources with nanotechnology and quantum computing could open new growth avenues.

Challenges

  • Intense Market Competition
    The presence of several key players creates pricing pressures and challenges differentiation.
  • Supply Chain Disruptions
    Global economic fluctuations and geopolitical tensions impact the supply of raw materials.
  • Complex Manufacturing Processes
    Producing high-purity MO sources requires advanced infrastructure and expertise, limiting new market entrants.

Key Benefits of This Market Research:

  • Industry drivers, restraints, and opportunities covered in the study
  • Neutral perspective on the market performance
  • Recent industry trends and developments
  • Competitive landscape & strategies of key players
  • Potential & niche segments and regions exhibiting promising growth covered
  • Historical, current, and projected market size, in terms of value
  • In-depth analysis of the MO (Metal Organic) Source Market
  • Overview of the regional outlook of the MO (Metal Organic) Source Market:

Key Reasons to Buy this Report:

  • Access to date statistics compiled by our researchers. These provide you with historical and forecast data, which is analyzed to tell you why your market is set to change
  • This enables you to anticipate market changes to remain ahead of your competitors
  • You will be able to copy data from the Excel spreadsheet straight into your marketing plans, business presentations, or other strategic documents
  • The concise analysis, clear graph, and table format will enable you to pinpoint the information you require quickly
  • Provision of market value data for each segment and sub-segment
  • Indicates the region and segment that is expected to witness the fastest growth as well as to dominate the market
  • Provides insight into the market through Value Chain
  • Market dynamics scenario, along with growth opportunities of the market in the years to come
  • 6-month post-sales analyst support

Customization of the Report
In case of any queries or customization requirements, please connect with our sales team, who will ensure that your requirements are met.


FAQs


Q: What are the key driving factors and opportunities in the MO (Metal Organic) Source market?

A: The key driving factors include the rising demand for LEDs, expansion in semiconductor applications, and growth in solar energy adoption. Opportunities lie in emerging markets, ongoing R&D in semiconductor technology, and advancements in MOVCD deposition techniques.


Q: Which region is projected to have the largest market share?

A: Asia-Pacific is expected to dominate the market due to rapid industrialization, increasing semiconductor production, and strong government support for LED and solar industries.


Q: Who are the top players in the global MO (Metal Organic) Source market?

A: Leading companies include Nata Opto-electronic, SAFC Hitech, AkzoNobel (Nouryon), Albemarle, Sumitomo Chemical, Ube Industries, and Entegris Inc.


Q: What are the latest technological advancements in the industry?

A: Innovations in MOVCD deposition, enhanced purity of metal organic compounds, and integration with nanotechnology are among the latest advancements driving market growth.


Q: What is the current size of the global MO (Metal Organic) Source market?

A: The market was valued at USD 143.30 million in 2023 and is projected to reach USD 440.87 million by 2032, growing at a CAGR of 13.30% during the forecast period.

Global MO (Metal Organic) Source Market, Size, Trends, Business Strategies 2025-2032

Get Sample Report PDF for Exclusive Insights

Report Sample Includes

  • Table of Contents
  • List of Tables & Figures
  • Charts, Research Methodology, and more...
PDF Icon Download Sample Report PDF

Download Sample Report

Table of Content

Table of Contents
1 Research Methodology and Statistical Scope
1.1 Market Definition and Statistical Scope of MO (Metal Organic) Source
1.2 Key Market Segments
1.2.1 MO (Metal Organic) Source Segment by Type
1.2.2 MO (Metal Organic) Source Segment by Application
1.3 Methodology & Sources of Information
1.3.1 Research Methodology
1.3.2 Research Process
1.3.3 Market Breakdown and Data Triangulation
1.3.4 Base Year
1.3.5 Report Assumptions & Caveats
2 MO (Metal Organic) Source Market Overview
2.1 Global Market Overview
2.1.1 Global MO (Metal Organic) Source Market Size (M USD) Estimates and Forecasts (2019-2032)
2.1.2 Global MO (Metal Organic) Source Sales Estimates and Forecasts (2019-2032)
2.2 Market Segment Executive Summary
2.3 Global Market Size by Region
3 MO (Metal Organic) Source Market Competitive Landscape
3.1 Global MO (Metal Organic) Source Sales by Manufacturers (2019-2025)
3.2 Global MO (Metal Organic) Source Revenue Market Share by Manufacturers (2019-2025)
3.3 MO (Metal Organic) Source Market Share by Company Type (Tier 1, Tier 2, and Tier 3)
3.4 Global MO (Metal Organic) Source Average Price by Manufacturers (2019-2025)
3.5 Manufacturers MO (Metal Organic) Source Sales Sites, Area Served, Product Type
3.6 MO (Metal Organic) Source Market Competitive Situation and Trends
3.6.1 MO (Metal Organic) Source Market Concentration Rate
3.6.2 Global 5 and 10 Largest MO (Metal Organic) Source Players Market Share by Revenue
3.6.3 Mergers & Acquisitions, Expansion
4 MO (Metal Organic) Source Industry Chain Analysis
4.1 MO (Metal Organic) Source Industry Chain Analysis
4.2 Market Overview of Key Raw Materials
4.3 Midstream Market Analysis
4.4 Downstream Customer Analysis
5 The Development and Dynamics of MO (Metal Organic) Source Market
5.1 Key Development Trends
5.2 Driving Factors
5.3 Market Challenges
5.4 Market Restraints
5.5 Industry News
5.5.1 New Product Developments
5.5.2 Mergers & Acquisitions
5.5.3 Expansions
5.5.4 Collaboration/Supply Contracts
5.6 Industry Policies
6 MO (Metal Organic) Source Market Segmentation by Type
6.1 Evaluation Matrix of Segment Market Development Potential (Type)
6.2 Global MO (Metal Organic) Source Sales Market Share by Type (2019-2025)
6.3 Global MO (Metal Organic) Source Market Size Market Share by Type (2019-2025)
6.4 Global MO (Metal Organic) Source Price by Type (2019-2025)
7 MO (Metal Organic) Source Market Segmentation by Application
7.1 Evaluation Matrix of Segment Market Development Potential (Application)
7.2 Global MO (Metal Organic) Source Market Sales by Application (2019-2025)
7.3 Global MO (Metal Organic) Source Market Size (M USD) by Application (2019-2025)
7.4 Global MO (Metal Organic) Source Sales Growth Rate by Application (2019-2025)
8 MO (Metal Organic) Source Market Consumption by Region
8.1 Global MO (Metal Organic) Source Sales by Region
8.1.1 Global MO (Metal Organic) Source Sales by Region
8.1.2 Global MO (Metal Organic) Source Sales Market Share by Region
8.2 North America
8.2.1 North America MO (Metal Organic) Source Sales by Country
8.2.2 U.S.
8.2.3 Canada
8.2.4 Mexico
8.3 Europe
8.3.1 Europe MO (Metal Organic) Source Sales by Country
8.3.2 Germany
8.3.3 France
8.3.4 U.K.
8.3.5 Italy
8.3.6 Russia
8.4 Asia Pacific
8.4.1 Asia Pacific MO (Metal Organic) Source Sales by Region
8.4.2 China
8.4.3 Japan
8.4.4 South Korea
8.4.5 India
8.4.6 Southeast Asia
8.5 South America
8.5.1 South America MO (Metal Organic) Source Sales by Country
8.5.2 Brazil
8.5.3 Argentina
8.5.4 Columbia
8.6 Middle East and Africa
8.6.1 Middle East and Africa MO (Metal Organic) Source Sales by Region
8.6.2 Saudi Arabia
8.6.3 UAE
8.6.4 Egypt
8.6.5 Nigeria
8.6.6 South Africa
9 MO (Metal Organic) Source Market Production by Region
9.1 Global Production of MO (Metal Organic) Source by Region (2019-2025)
9.2 Global MO (Metal Organic) Source Revenue Market Share by Region (2019-2025)
9.3 Global MO (Metal Organic) Source Production, Revenue, Price and Gross Margin (2019-2025)
9.4 North America MO (Metal Organic) Source Production
9.4.1 North America MO (Metal Organic) Source Production Growth Rate (2019-2025)
9.4.2 North America MO (Metal Organic) Source Production, Revenue, Price and Gross Margin (2019-2025)
9.5 Europe MO (Metal Organic) Source Production
9.5.1 Europe MO (Metal Organic) Source Production Growth Rate (2019-2025)
9.5.2 Europe MO (Metal Organic) Source Production, Revenue, Price and Gross Margin (2019-2025)
9.6 Japan MO (Metal Organic) Source Production (2019-2025)
9.6.1 Japan MO (Metal Organic) Source Production Growth Rate (2019-2025)
9.6.2 Japan MO (Metal Organic) Source Production, Revenue, Price and Gross Margin (2019-2025)
9.7 China MO (Metal Organic) Source Production (2019-2025)
9.7.1 China MO (Metal Organic) Source Production Growth Rate (2019-2025)
9.7.2 China MO (Metal Organic) Source Production, Revenue, Price and Gross Margin (2019-2025)
10 Key Companies Profile
10.1 Nata Opto-electronic
10.1.1 Nata Opto-electronic MO (Metal Organic) Source Basic Information
10.1.2 Nata Opto-electronic MO (Metal Organic) Source Product Overview
10.1.3 Nata Opto-electronic MO (Metal Organic) Source Product Market Performance
10.1.4 Nata Opto-electronic Business Overview
10.1.5 Nata Opto-electronic MO (Metal Organic) Source SWOT Analysis
10.1.6 Nata Opto-electronic Recent Developments
10.2 SAFC Hitech
10.2.1 SAFC Hitech MO (Metal Organic) Source Basic Information
10.2.2 SAFC Hitech MO (Metal Organic) Source Product Overview
10.2.3 SAFC Hitech MO (Metal Organic) Source Product Market Performance
10.2.4 SAFC Hitech Business Overview
10.2.5 SAFC Hitech MO (Metal Organic) Source SWOT Analysis
10.2.6 SAFC Hitech Recent Developments
10.3 AkzoNobel (Nouryon)
10.3.1 AkzoNobel (Nouryon) MO (Metal Organic) Source Basic Information
10.3.2 AkzoNobel (Nouryon) MO (Metal Organic) Source Product Overview
10.3.3 AkzoNobel (Nouryon) MO (Metal Organic) Source Product Market Performance
10.3.4 AkzoNobel (Nouryon) MO (Metal Organic) Source SWOT Analysis
10.3.5 AkzoNobel (Nouryon) Business Overview
10.3.6 AkzoNobel (Nouryon) Recent Developments
10.4 Jiang Xi Jia Yin Opt-Electronic
10.4.1 Jiang Xi Jia Yin Opt-Electronic MO (Metal Organic) Source Basic Information
10.4.2 Jiang Xi Jia Yin Opt-Electronic MO (Metal Organic) Source Product Overview
10.4.3 Jiang Xi Jia Yin Opt-Electronic MO (Metal Organic) Source Product Market Performance
10.4.4 Jiang Xi Jia Yin Opt-Electronic Business Overview
10.4.5 Jiang Xi Jia Yin Opt-Electronic Recent Developments
10.5 Albemarle
10.5.1 Albemarle MO (Metal Organic) Source Basic Information
10.5.2 Albemarle MO (Metal Organic) Source Product Overview
10.5.3 Albemarle MO (Metal Organic) Source Product Market Performance
10.5.4 Albemarle Business Overview
10.5.5 Albemarle Recent Developments
10.6 Chemtura
10.6.1 Chemtura MO (Metal Organic) Source Basic Information
10.6.2 Chemtura MO (Metal Organic) Source Product Overview
10.6.3 Chemtura MO (Metal Organic) Source Product Market Performance
10.6.4 Chemtura Business Overview
10.6.5 Chemtura Recent Developments
10.7 Sumitomo Chemical
10.7.1 Sumitomo Chemical MO (Metal Organic) Source Basic Information
10.7.2 Sumitomo Chemical MO (Metal Organic) Source Product Overview
10.7.3 Sumitomo Chemical MO (Metal Organic) Source Product Market Performance
10.7.4 Sumitomo Chemical Business Overview
10.7.5 Sumitomo Chemical Recent Developments
10.8 Ube Industries
10.8.1 Ube Industries MO (Metal Organic) Source Basic Information
10.8.2 Ube Industries MO (Metal Organic) Source Product Overview
10.8.3 Ube Industries MO (Metal Organic) Source Product Market Performance
10.8.4 Ube Industries Business Overview
10.8.5 Ube Industries Recent Developments
10.9 Lake Materials
10.9.1 Lake Materials MO (Metal Organic) Source Basic Information
10.9.2 Lake Materials MO (Metal Organic) Source Product Overview
10.9.3 Lake Materials MO (Metal Organic) Source Product Market Performance
10.9.4 Lake Materials Business Overview
10.9.5 Lake Materials Recent Developments
10.10 ARGOSUN MO
10.10.1 ARGOSUN MO MO (Metal Organic) Source Basic Information
10.10.2 ARGOSUN MO MO (Metal Organic) Source Product Overview
10.10.3 ARGOSUN MO MO (Metal Organic) Source Product Market Performance
10.10.4 ARGOSUN MO Business Overview
10.10.5 ARGOSUN MO Recent Developments
10.11 Suzhou Pure Opto-Electronic
10.11.1 Suzhou Pure Opto-Electronic MO (Metal Organic) Source Basic Information
10.11.2 Suzhou Pure Opto-Electronic MO (Metal Organic) Source Product Overview
10.11.3 Suzhou Pure Opto-Electronic MO (Metal Organic) Source Product Market Performance
10.11.4 Suzhou Pure Opto-Electronic Business Overview
10.11.5 Suzhou Pure Opto-Electronic Recent Developments
10.12 Entegris
10.12.1 Entegris MO (Metal Organic) Source Basic Information
10.12.2 Entegris MO (Metal Organic) Source Product Overview
10.12.3 Entegris MO (Metal Organic) Source Product Market Performance
10.12.4 Entegris Business Overview
10.12.5 Entegris Recent Developments
10.13 Inc
10.13.1 Inc MO (Metal Organic) Source Basic Information
10.13.2 Inc MO (Metal Organic) Source Product Overview
10.13.3 Inc MO (Metal Organic) Source Product Market Performance
10.13.4 Inc Business Overview
10.13.5 Inc Recent Developments
11 MO (Metal Organic) Source Market Forecast by Region
11.1 Global MO (Metal Organic) Source Market Size Forecast
11.2 Global MO (Metal Organic) Source Market Forecast by Region
11.2.1 North America Market Size Forecast by Country
11.2.2 Europe MO (Metal Organic) Source Market Size Forecast by Country
11.2.3 Asia Pacific MO (Metal Organic) Source Market Size Forecast by Region
11.2.4 South America MO (Metal Organic) Source Market Size Forecast by Country
11.2.5 Middle East and Africa Forecasted Consumption of MO (Metal Organic) Source by Country
12 Forecast Market by Type and by Application (2025-2032)
12.1 Global MO (Metal Organic) Source Market Forecast by Type (2025-2032)
12.1.1 Global Forecasted Sales of MO (Metal Organic) Source by Type (2025-2032)
12.1.2 Global MO (Metal Organic) Source Market Size Forecast by Type (2025-2032)
12.1.3 Global Forecasted Price of MO (Metal Organic) Source by Type (2025-2032)
12.2 Global MO (Metal Organic) Source Market Forecast by Application (2025-2032)
12.2.1 Global MO (Metal Organic) Source Sales (K Units) Forecast by Application
12.2.2 Global MO (Metal Organic) Source Market Size (M USD) Forecast by Application (2025-2032)
13 Conclusion and Key FindingsList of Tables
Table 1. Introduction of the Type
Table 2. Introduction of the Application
Table 3. Market Size (M USD) Segment Executive Summary
Table 4. MO (Metal Organic) Source Market Size Comparison by Region (M USD)
Table 5. Global MO (Metal Organic) Source Sales (K Units) by Manufacturers (2019-2025)
Table 6. Global MO (Metal Organic) Source Sales Market Share by Manufacturers (2019-2025)
Table 7. Global MO (Metal Organic) Source Revenue (M USD) by Manufacturers (2019-2025)
Table 8. Global MO (Metal Organic) Source Revenue Share by Manufacturers (2019-2025)
Table 9. Company Type (Tier 1, Tier 2, and Tier 3) & (based on the Revenue in MO (Metal Organic) Source as of 2022)
Table 10. Global Market MO (Metal Organic) Source Average Price (USD/Unit) of Key Manufacturers (2019-2025)
Table 11. Manufacturers MO (Metal Organic) Source Sales Sites and Area Served
Table 12. Manufacturers MO (Metal Organic) Source Product Type
Table 13. Global MO (Metal Organic) Source Manufacturers Market Concentration Ratio (CR5 and HHI)
Table 14. Mergers & Acquisitions, Expansion Plans
Table 15. Industry Chain Map of MO (Metal Organic) Source
Table 16. Market Overview of Key Raw Materials
Table 17. Midstream Market Analysis
Table 18. Downstream Customer Analysis
Table 19. Key Development Trends
Table 20. Driving Factors
Table 21. MO (Metal Organic) Source Market Challenges
Table 22. Global MO (Metal Organic) Source Sales by Type (K Units)
Table 23. Global MO (Metal Organic) Source Market Size by Type (M USD)
Table 24. Global MO (Metal Organic) Source Sales (K Units) by Type (2019-2025)
Table 25. Global MO (Metal Organic) Source Sales Market Share by Type (2019-2025)
Table 26. Global MO (Metal Organic) Source Market Size (M USD) by Type (2019-2025)
Table 27. Global MO (Metal Organic) Source Market Size Share by Type (2019-2025)
Table 28. Global MO (Metal Organic) Source Price (USD/Unit) by Type (2019-2025)
Table 29. Global MO (Metal Organic) Source Sales (K Units) by Application
Table 30. Global MO (Metal Organic) Source Market Size by Application
Table 31. Global MO (Metal Organic) Source Sales by Application (2019-2025) & (K Units)
Table 32. Global MO (Metal Organic) Source Sales Market Share by Application (2019-2025)
Table 33. Global MO (Metal Organic) Source Sales by Application (2019-2025) & (M USD)
Table 34. Global MO (Metal Organic) Source Market Share by Application (2019-2025)
Table 35. Global MO (Metal Organic) Source Sales Growth Rate by Application (2019-2025)
Table 36. Global MO (Metal Organic) Source Sales by Region (2019-2025) & (K Units)
Table 37. Global MO (Metal Organic) Source Sales Market Share by Region (2019-2025)
Table 38. North America MO (Metal Organic) Source Sales by Country (2019-2025) & (K Units)
Table 39. Europe MO (Metal Organic) Source Sales by Country (2019-2025) & (K Units)
Table 40. Asia Pacific MO (Metal Organic) Source Sales by Region (2019-2025) & (K Units)
Table 41. South America MO (Metal Organic) Source Sales by Country (2019-2025) & (K Units)
Table 42. Middle East and Africa MO (Metal Organic) Source Sales by Region (2019-2025) & (K Units)
Table 43. Global MO (Metal Organic) Source Production (K Units) by Region (2019-2025)
Table 44. Global MO (Metal Organic) Source Revenue (US$ Million) by Region (2019-2025)
Table 45. Global MO (Metal Organic) Source Revenue Market Share by Region (2019-2025)
Table 46. Global MO (Metal Organic) Source Production (K Units), Revenue (US$ Million), Price (USD/Unit) and Gross Margin (2019-2025)
Table 47. North America MO (Metal Organic) Source Production (K Units), Revenue (US$ Million), Price (USD/Unit) and Gross Margin (2019-2025)
Table 48. Europe MO (Metal Organic) Source Production (K Units), Revenue (US$ Million), Price (USD/Unit) and Gross Margin (2019-2025)
Table 49. Japan MO (Metal Organic) Source Production (K Units), Revenue (US$ Million), Price (USD/Unit) and Gross Margin (2019-2025)
Table 50. China MO (Metal Organic) Source Production (K Units), Revenue (US$ Million), Price (USD/Unit) and Gross Margin (2019-2025)
Table 51. Nata Opto-electronic MO (Metal Organic) Source Basic Information
Table 52. Nata Opto-electronic MO (Metal Organic) Source Product Overview
Table 53. Nata Opto-electronic MO (Metal Organic) Source Sales (K Units), Revenue (M USD), Price (USD/Unit) and Gross Margin (2019-2025)
Table 54. Nata Opto-electronic Business Overview
Table 55. Nata Opto-electronic MO (Metal Organic) Source SWOT Analysis
Table 56. Nata Opto-electronic Recent Developments
Table 57. SAFC Hitech MO (Metal Organic) Source Basic Information
Table 58. SAFC Hitech MO (Metal Organic) Source Product Overview
Table 59. SAFC Hitech MO (Metal Organic) Source Sales (K Units), Revenue (M USD), Price (USD/Unit) and Gross Margin (2019-2025)
Table 60. SAFC Hitech Business Overview
Table 61. SAFC Hitech MO (Metal Organic) Source SWOT Analysis
Table 62. SAFC Hitech Recent Developments
Table 63. AkzoNobel (Nouryon) MO (Metal Organic) Source Basic Information
Table 64. AkzoNobel (Nouryon) MO (Metal Organic) Source Product Overview
Table 65. AkzoNobel (Nouryon) MO (Metal Organic) Source Sales (K Units), Revenue (M USD), Price (USD/Unit) and Gross Margin (2019-2025)
Table 66. AkzoNobel (Nouryon) MO (Metal Organic) Source SWOT Analysis
Table 67. AkzoNobel (Nouryon) Business Overview
Table 68. AkzoNobel (Nouryon) Recent Developments
Table 69. Jiang Xi Jia Yin Opt-Electronic MO (Metal Organic) Source Basic Information
Table 70. Jiang Xi Jia Yin Opt-Electronic MO (Metal Organic) Source Product Overview
Table 71. Jiang Xi Jia Yin Opt-Electronic MO (Metal Organic) Source Sales (K Units), Revenue (M USD), Price (USD/Unit) and Gross Margin (2019-2025)
Table 72. Jiang Xi Jia Yin Opt-Electronic Business Overview
Table 73. Jiang Xi Jia Yin Opt-Electronic Recent Developments
Table 74. Albemarle MO (Metal Organic) Source Basic Information
Table 75. Albemarle MO (Metal Organic) Source Product Overview
Table 76. Albemarle MO (Metal Organic) Source Sales (K Units), Revenue (M USD), Price (USD/Unit) and Gross Margin (2019-2025)
Table 77. Albemarle Business Overview
Table 78. Albemarle Recent Developments
Table 79. Chemtura MO (Metal Organic) Source Basic Information
Table 80. Chemtura MO (Metal Organic) Source Product Overview
Table 81. Chemtura MO (Metal Organic) Source Sales (K Units), Revenue (M USD), Price (USD/Unit) and Gross Margin (2019-2025)
Table 82. Chemtura Business Overview
Table 83. Chemtura Recent Developments
Table 84. Sumitomo Chemical MO (Metal Organic) Source Basic Information
Table 85. Sumitomo Chemical MO (Metal Organic) Source Product Overview
Table 86. Sumitomo Chemical MO (Metal Organic) Source Sales (K Units), Revenue (M USD), Price (USD/Unit) and Gross Margin (2019-2025)
Table 87. Sumitomo Chemical Business Overview
Table 88. Sumitomo Chemical Recent Developments
Table 89. Ube Industries MO (Metal Organic) Source Basic Information
Table 90. Ube Industries MO (Metal Organic) Source Product Overview
Table 91. Ube Industries MO (Metal Organic) Source Sales (K Units), Revenue (M USD), Price (USD/Unit) and Gross Margin (2019-2025)
Table 92. Ube Industries Business Overview
Table 93. Ube Industries Recent Developments
Table 94. Lake Materials MO (Metal Organic) Source Basic Information
Table 95. Lake Materials MO (Metal Organic) Source Product Overview
Table 96. Lake Materials MO (Metal Organic) Source Sales (K Units), Revenue (M USD), Price (USD/Unit) and Gross Margin (2019-2025)
Table 97. Lake Materials Business Overview
Table 98. Lake Materials Recent Developments
Table 99. ARGOSUN MO MO (Metal Organic) Source Basic Information
Table 100. ARGOSUN MO MO (Metal Organic) Source Product Overview
Table 101. ARGOSUN MO MO (Metal Organic) Source Sales (K Units), Revenue (M USD), Price (USD/Unit) and Gross Margin (2019-2025)
Table 102. ARGOSUN MO Business Overview
Table 103. ARGOSUN MO Recent Developments
Table 104. Suzhou Pure Opto-Electronic MO (Metal Organic) Source Basic Information
Table 105. Suzhou Pure Opto-Electronic MO (Metal Organic) Source Product Overview
Table 106. Suzhou Pure Opto-Electronic MO (Metal Organic) Source Sales (K Units), Revenue (M USD), Price (USD/Unit) and Gross Margin (2019-2025)
Table 107. Suzhou Pure Opto-Electronic Business Overview
Table 108. Suzhou Pure Opto-Electronic Recent Developments
Table 109. Entegris MO (Metal Organic) Source Basic Information
Table 110. Entegris MO (Metal Organic) Source Product Overview
Table 111. Entegris MO (Metal Organic) Source Sales (K Units), Revenue (M USD), Price (USD/Unit) and Gross Margin (2019-2025)
Table 112. Entegris Business Overview
Table 113. Entegris Recent Developments
Table 114. Inc MO (Metal Organic) Source Basic Information
Table 115. Inc MO (Metal Organic) Source Product Overview
Table 116. Inc MO (Metal Organic) Source Sales (K Units), Revenue (M USD), Price (USD/Unit) and Gross Margin (2019-2025)
Table 117. Inc Business Overview
Table 118. Inc Recent Developments
Table 119. Global MO (Metal Organic) Source Sales Forecast by Region (2025-2032) & (K Units)
Table 120. Global MO (Metal Organic) Source Market Size Forecast by Region (2025-2032) & (M USD)
Table 121. North America MO (Metal Organic) Source Sales Forecast by Country (2025-2032) & (K Units)
Table 122. North America MO (Metal Organic) Source Market Size Forecast by Country (2025-2032) & (M USD)
Table 123. Europe MO (Metal Organic) Source Sales Forecast by Country (2025-2032) & (K Units)
Table 124. Europe MO (Metal Organic) Source Market Size Forecast by Country (2025-2032) & (M USD)
Table 125. Asia Pacific MO (Metal Organic) Source Sales Forecast by Region (2025-2032) & (K Units)
Table 126. Asia Pacific MO (Metal Organic) Source Market Size Forecast by Region (2025-2032) & (M USD)
Table 127. South America MO (Metal Organic) Source Sales Forecast by Country (2025-2032) & (K Units)
Table 128. South America MO (Metal Organic) Source Market Size Forecast by Country (2025-2032) & (M USD)
Table 129. Middle East and Africa MO (Metal Organic) Source Consumption Forecast by Country (2025-2032) & (Units)
Table 130. Middle East and Africa MO (Metal Organic) Source Market Size Forecast by Country (2025-2032) & (M USD)
Table 131. Global MO (Metal Organic) Source Sales Forecast by Type (2025-2032) & (K Units)
Table 132. Global MO (Metal Organic) Source Market Size Forecast by Type (2025-2032) & (M USD)
Table 133. Global MO (Metal Organic) Source Price Forecast by Type (2025-2032) & (USD/Unit)
Table 134. Global MO (Metal Organic) Source Sales (K Units) Forecast by Application (2025-2032)
Table 135. Global MO (Metal Organic) Source Market Size Forecast by Application (2025-2032) & (M USD)
List of Figures
Figure 1. Product Picture of MO (Metal Organic) Source
Figure 2. Data Triangulation
Figure 3. Key Caveats
Figure 4. Global MO (Metal Organic) Source Market Size (M USD), 2019-2032
Figure 5. Global MO (Metal Organic) Source Market Size (M USD) (2019-2032)
Figure 6. Global MO (Metal Organic) Source Sales (K Units) & (2019-2032)
Figure 7. Evaluation Matrix of Segment Market Development Potential (Type)
Figure 8. Evaluation Matrix of Segment Market Development Potential (Application)
Figure 9. Evaluation Matrix of Regional Market Development Potential
Figure 10. MO (Metal Organic) Source Market Size by Country (M USD)
Figure 11. MO (Metal Organic) Source Sales Share by Manufacturers in 2023
Figure 12. Global MO (Metal Organic) Source Revenue Share by Manufacturers in 2023
Figure 13. MO (Metal Organic) Source Market Share by Company Type (Tier 1, Tier 2 and Tier 3): 2023
Figure 14. Global Market MO (Metal Organic) Source Average Price (USD/Unit) of Key Manufacturers in 2023
Figure 15. The Global 5 and 10 Largest Players: Market Share by MO (Metal Organic) Source Revenue in 2023
Figure 16. Evaluation Matrix of Segment Market Development Potential (Type)
Figure 17. Global MO (Metal Organic) Source Market Share by Type
Figure 18. Sales Market Share of MO (Metal Organic) Source by Type (2019-2025)
Figure 19. Sales Market Share of MO (Metal Organic) Source by Type in 2023
Figure 20. Market Size Share of MO (Metal Organic) Source by Type (2019-2025)
Figure 21. Market Size Market Share of MO (Metal Organic) Source by Type in 2023
Figure 22. Evaluation Matrix of Segment Market Development Potential (Application)
Figure 23. Global MO (Metal Organic) Source Market Share by Application
Figure 24. Global MO (Metal Organic) Source Sales Market Share by Application (2019-2025)
Figure 25. Global MO (Metal Organic) Source Sales Market Share by Application in 2023
Figure 26. Global MO (Metal Organic) Source Market Share by Application (2019-2025)
Figure 27. Global MO (Metal Organic) Source Market Share by Application in 2023
Figure 28. Global MO (Metal Organic) Source Sales Growth Rate by Application (2019-2025)
Figure 29. Global MO (Metal Organic) Source Sales Market Share by Region (2019-2025)
Figure 30. North America MO (Metal Organic) Source Sales and Growth Rate (2019-2025) & (K Units)
Figure 31. North America MO (Metal Organic) Source Sales Market Share by Country in 2023
Figure 32. U.S. MO (Metal Organic) Source Sales and Growth Rate (2019-2025) & (K Units)
Figure 33. Canada MO (Metal Organic) Source Sales (K Units) and Growth Rate (2019-2025)
Figure 34. Mexico MO (Metal Organic) Source Sales (Units) and Growth Rate (2019-2025)
Figure 35. Europe MO (Metal Organic) Source Sales and Growth Rate (2019-2025) & (K Units)
Figure 36. Europe MO (Metal Organic) Source Sales Market Share by Country in 2023
Figure 37. Germany MO (Metal Organic) Source Sales and Growth Rate (2019-2025) & (K Units)
Figure 38. France MO (Metal Organic) Source Sales and Growth Rate (2019-2025) & (K Units)
Figure 39. U.K. MO (Metal Organic) Source Sales and Growth Rate (2019-2025) & (K Units)
Figure 40. Italy MO (Metal Organic) Source Sales and Growth Rate (2019-2025) & (K Units)
Figure 41. Russia MO (Metal Organic) Source Sales and Growth Rate (2019-2025) & (K Units)
Figure 42. Asia Pacific MO (Metal Organic) Source Sales and Growth Rate (K Units)
Figure 43. Asia Pacific MO (Metal Organic) Source Sales Market Share by Region in 2023
Figure 44. China MO (Metal Organic) Source Sales and Growth Rate (2019-2025) & (K Units)
Figure 45. Japan MO (Metal Organic) Source Sales and Growth Rate (2019-2025) & (K Units)
Figure 46. South Korea MO (Metal Organic) Source Sales and Growth Rate (2019-2025) & (K Units)
Figure 47. India MO (Metal Organic) Source Sales and Growth Rate (2019-2025) & (K Units)
Figure 48. Southeast Asia MO (Metal Organic) Source Sales and Growth Rate (2019-2025) & (K Units)
Figure 49. South America MO (Metal Organic) Source Sales and Growth Rate (K Units)
Figure 50. South America MO (Metal Organic) Source Sales Market Share by Country in 2023
Figure 51. Brazil MO (Metal Organic) Source Sales and Growth Rate (2019-2025) & (K Units)
Figure 52. Argentina MO (Metal Organic) Source Sales and Growth Rate (2019-2025) & (K Units)
Figure 53. Columbia MO (Metal Organic) Source Sales and Growth Rate (2019-2025) & (K Units)
Figure 54. Middle East and Africa MO (Metal Organic) Source Sales and Growth Rate (K Units)
Figure 55. Middle East and Africa MO (Metal Organic) Source Sales Market Share by Region in 2023
Figure 56. Saudi Arabia MO (Metal Organic) Source Sales and Growth Rate (2019-2025) & (K Units)
Figure 57. UAE MO (Metal Organic) Source Sales and Growth Rate (2019-2025) & (K Units)
Figure 58. Egypt MO (Metal Organic) Source Sales and Growth Rate (2019-2025) & (K Units)
Figure 59. Nigeria MO (Metal Organic) Source Sales and Growth Rate (2019-2025) & (K Units)
Figure 60. South Africa MO (Metal Organic) Source Sales and Growth Rate (2019-2025) & (K Units)
Figure 61. Global MO (Metal Organic) Source Production Market Share by Region (2019-2025)
Figure 62. North America MO (Metal Organic) Source Production (K Units) Growth Rate (2019-2025)
Figure 63. Europe MO (Metal Organic) Source Production (K Units) Growth Rate (2019-2025)
Figure 64. Japan MO (Metal Organic) Source Production (K Units) Growth Rate (2019-2025)
Figure 65. China MO (Metal Organic) Source Production (K Units) Growth Rate (2019-2025)
Figure 66. Global MO (Metal Organic) Source Sales Forecast by Volume (2019-2032) & (K Units)
Figure 67. Global MO (Metal Organic) Source Market Size Forecast by Value (2019-2032) & (M USD)
Figure 68. Global MO (Metal Organic) Source Sales Market Share Forecast by Type (2025-2032)
Figure 69. Global MO (Metal Organic) Source Market Share Forecast by Type (2025-2032)
Figure 70. Global MO (Metal Organic) Source Sales Forecast by Application (2025-2032)
Figure 71. Global MO (Metal Organic) Source Market Share Forecast by Application (2025-2032)