Global Microprinting Market ,Size ,Trends, Business Strategies 2025-2032

Global Microprinting market size was estimated at USD 398.20 million in 2023 and is projected to reach USD 571.69 million by 2032, exhibiting a CAGR of 4.10% during the forecast period.

PDF Icon Download Sample Report PDF
  • Quick Dispatch

    All Orders

  • Secure Payment

    100% Secure Payment

Compare

$1,500.00$4,250.00

Clear

Microprinting Market Overview

Micro-printing, also known as micro-words, is an anti-counterfeiting technology widely used on banknotes, bank checks, and other valuable prints and documents. In the inconspicuous places on paper money or some other printed matter, micro-printing technology is usually used – some words are printed with a very small font size, so that it is difficult to identify with the naked eye.

This report provides a deep insight into the global Microprinting market covering all its essential aspects. This ranges from a macro overview of the market to micro details of the market size, competitive landscape, development trend, niche market, key market drivers and challenges, SWOT analysis, value chain analysis, etc.

The analysis helps the reader to shape the competition within the industries and strategies for the competitive environment to enhance the potential profit. Furthermore, it provides a simple framework for evaluating and accessing the position of the business organization. The report structure also focuses on the competitive landscape of the Global Microprinting Market, this report introduces in detail the market share, market performance, product situation, operation situation, etc. of the main players, which helps the readers in the industry to identify the main competitors and deeply understand the competition pattern of the market.
In a word, this report is a must-read for industry players, investors, researchers, consultants, business strategists, and all those who have any kind of stake or are planning to foray into the Microprinting market in any manner.

Microprinting Market  Analysis:

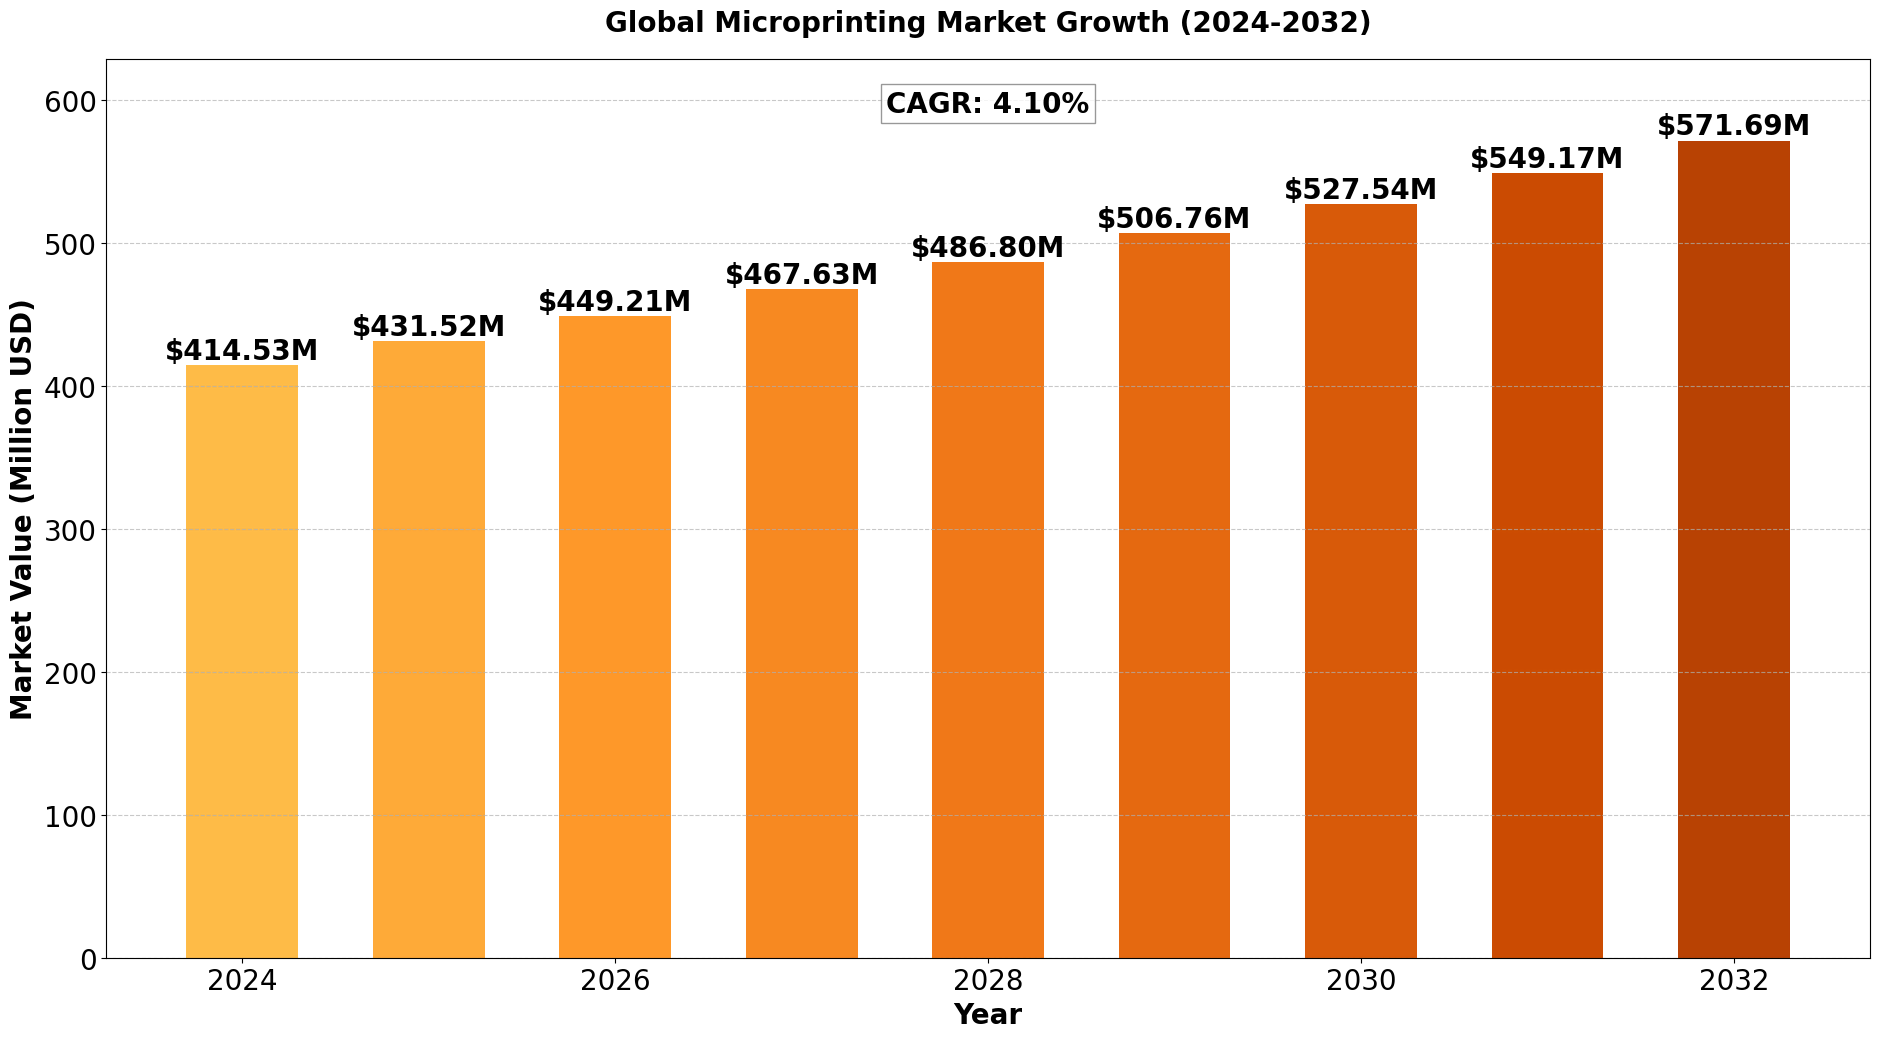
The global Microprinting market size was estimated at USD 398.20 million in 2023 and is projected to reach USD 571.69 million by 2032, exhibiting a CAGR of 4.10% during the forecast period.

North America Microprinting market size was estimated at USD 111.18 million in 2023, at a CAGR of 3.51% during the forecast period of 2025 through 2032.

Microprinting Key Market Trends  :

  1. Growing Demand for Anti-Counterfeiting Solutions – Increasing concerns over document and currency fraud are driving the adoption of microprinting in security applications.
  2. Expansion in Electronics and Healthcare Industries – The rising use of microprinted circuits and medical labeling is supporting market growth.
  3. Advancements in High-Resolution Printing Technologies – Innovations in laser and inkjet microprinting are enhancing print quality and security features.
  4. Adoption in Consumer Goods Packaging – Brands are using microprinting to prevent counterfeiting in luxury goods, pharmaceuticals, and packaged food.
  5. Integration with Smart Authentication Technologies – Microprinting combined with digital tracking solutions is improving security in financial and government sectors.

Microprinting Market Regional Analysis :

semi insight

  • North America:Strong demand driven by EVs, 5G infrastructure, and renewable energy, with the U.S. leading the market.
  • Europe:Growth fueled by automotive electrification, renewable energy, and strong regulatory support, with Germany as a key player.
  • Asia-Pacific:Dominates the market due to large-scale manufacturing in China and Japan, with growing demand from EVs, 5G, and semiconductors.
  • South America:Emerging market, driven by renewable energy and EV adoption, with Brazil leading growth.
  • Middle East & Africa:Gradual growth, mainly due to investments in renewable energy and EV infrastructure, with Saudi Arabia and UAE as key contributors.

Microprinting Market Segmentation :

The research report includes specific segments by region (country), manufacturers, Type, and Application. Market segmentation creates subsets of a market based on product type, end-user or application, Geographic, and other factors. By understanding the market segments, the decision-maker can leverage this targeting in the product, sales, and marketing strategies. Market segments can power your product development cycles by informing how you create product offerings for different segments.
Key Company

  • Sauressig
  • Diagramm Halbach
  • Xerox Corp
  • Micro Format
  • Printegra
  • Team NiSCA
  • Brady
  • Gallas Label & Decal
  • Huber Group
  • Troy Group
  • Heidelberg Instruments
  • Hewlett Packard
  • GeSiM
  • Smith & Ouzman
  • Computastat Group
  • Trustcopy
  • Favini
  • William Frick & Co
  • MaxMax
  • SAFEChecks
  • Zebra Technologies
  • Data Carte Concepts
  • Cardlogix
  • Spectrum Positive

Market Segmentation (by Type)

  • UV Invisible Marking
  • Special Inks
  • Infrared Ink Marking
  • Magnetic Ink
  • Micro-Embossing
  • Others

Market Segmentation (by Application)

  • Currency
  • Bank Checks
  • ID Cards
  • Labels
  • Packaging
  • Consumer Electronics
  • Defense
  • Others

Drivers

  • Increasing Use in Currency and Secure Documents – Governments and financial institutions are investing in microprinting for banknotes, passports, and official documents.
  • Growth in Brand Protection and Product Authentication – Rising concerns about counterfeit products in industries like pharmaceuticals and cosmetics are fueling demand.
  • Technological Developments in Printing Materials – Advancements in UV-cured inks, nano-scale printing, and specialized substrates are improving durability and precision.

Restraints

  • High Initial Setup Costs for Advanced Printing Systems – Implementing microprinting technology requires significant investment in specialized equipment.
  • Challenges in Printing on Complex Surfaces – Achieving precision microprinting on flexible or uneven surfaces remains a technical hurdle.
  • Limited Awareness Among Small and Medium Enterprises (SMEs) – Many smaller businesses are unaware of the benefits and applications of microprinting.

Opportunities

  • Rising Demand for Smart Packaging and IoT-Connected Labels – The integration of microprinting with NFC and RFID technologies is opening new market avenues.
  • Expansion in the E-commerce and Logistics Sectors – Increasing use of microprinted security features in supply chain tracking and authentication.
  • Advancements in Biometric and Forensic Applications – The development of microprinted security markers for identity verification and forensic tracking is gaining traction.

Challenges

  • Ensuring Long-Term Durability and Readability – Maintaining microprinted details against wear, environmental conditions, and tampering is challenging.
  • Competition from Alternative Security Printing Methods – Holography, RFID tags, and blockchain-based authentication may impact microprinting adoption.
  • Balancing Cost and Scalability for Mass Production – Implementing microprinting across large-scale production while keeping costs low is a significant challenge.

Key Benefits of This Market Research:

  • Industry drivers, restraints, and opportunities covered in the study
  • Neutral perspective on the market performance
  • Recent industry trends and developments
  • Competitive landscape & strategies of key players
  • Potential & niche segments and regions exhibiting promising growth covered
  • Historical, current, and projected market size, in terms of value
  • In-depth analysis of the Mask Blanks Manufacturing Market
  • Overview of the regional outlook of the Mask Blanks Manufacturing Market:

Key Reasons to Buy this Report:

  • Access to date statistics compiled by our researchers. These provide you with historical and forecast data, which is analyzed to tell you why your market is set to change
  • This enables you to anticipate market changes to remain ahead of your competitors
  • You will be able to copy data from the Excel spreadsheet straight into your marketing plans, business presentations, or other strategic documents
  • The concise analysis, clear graph, and table format will enable you to pinpoint the information you require quickly
  • Provision of market value data for each segment and sub-segment
  • Indicates the region and segment that is expected to witness the fastest growth as well as to dominate the market
  • Includes in-depth analysis of the market from various perspectives through Porters five forces analysis
  • Provides insight into the market through Value Chain
  • Market dynamics scenario, along with growth opportunities of the market in the years to come
  • 6-month post-sales analyst support

Customization of the Report
In case of any queries or customization requirements, please connect with our sales team, who will ensure that your requirements are met.

FAQs


Q: What are the key driving factors and opportunities in the microprinting market?

A: Key drivers include increasing demand for anti-counterfeiting solutions, advancements in security printing, and adoption in brand protection. Opportunities lie in smart packaging, e-commerce security, and forensic applications.


Q: Which region is projected to have the largest market share?

A: North America is expected to lead due to strong government regulations and advanced security printing technologies, while Asia-Pacific is experiencing rapid growth in packaging and financial applications.


Q: Who are the top players in the global microprinting market?

A: Leading companies include Videojet Technologies, Zebra Technologies, Matica Technologies, Domino Printing Sciences, and Xerox Corporation.


Q: What are the latest technological advancements in the industry?

A: Recent innovations include high-resolution UV microprinting, laser-based security printing, and integration with smart tracking solutions like RFID and QR codes.


Q: What is the current size of the global microprinting market?

A: The market was valued at USD 2.5 billion in 2024 and is projected to reach USD 4.8 billion by 2032, growing at a CAGR of 8.2%.

Global Microprinting Market ,Size ,Trends, Business Strategies 2025-2032

Get Sample Report PDF for Exclusive Insights

Report Sample Includes

  • Table of Contents
  • List of Tables & Figures
  • Charts, Research Methodology, and more...
PDF Icon Download Sample Report PDF

Download Sample Report

Table of Content

Table of Contents
1 Research Methodology and Statistical Scope
1.1 Market Definition and Statistical Scope of Microprinting
1.2 Key Market Segments
1.2.1 Microprinting Segment by Type
1.2.2 Microprinting Segment by Application
1.3 Methodology & Sources of Information
1.3.1 Research Methodology
1.3.2 Research Process
1.3.3 Market Breakdown and Data Triangulation
1.3.4 Base Year
1.3.5 Report Assumptions & Caveats
2 Microprinting Market Overview
2.1 Global Market Overview
2.1.1 Global Microprinting Market Size (M USD) Estimates and Forecasts (2019-2032)
2.1.2 Global Microprinting Sales Estimates and Forecasts (2019-2032)
2.2 Market Segment Executive Summary
2.3 Global Market Size by Region
3 Microprinting Market Competitive Landscape
3.1 Global Microprinting Sales by Manufacturers (2019-2025)
3.2 Global Microprinting Revenue Market Share by Manufacturers (2019-2025)
3.3 Microprinting Market Share by Company Type (Tier 1, Tier 2, and Tier 3)
3.4 Global Microprinting Average Price by Manufacturers (2019-2025)
3.5 Manufacturers Microprinting Sales Sites, Area Served, Product Type
3.6 Microprinting Market Competitive Situation and Trends
3.6.1 Microprinting Market Concentration Rate
3.6.2 Global 5 and 10 Largest Microprinting Players Market Share by Revenue
3.6.3 Mergers & Acquisitions, Expansion
4 Microprinting Industry Chain Analysis
4.1 Microprinting Industry Chain Analysis
4.2 Market Overview of Key Raw Materials
4.3 Midstream Market Analysis
4.4 Downstream Customer Analysis
5 The Development and Dynamics of Microprinting Market
5.1 Key Development Trends
5.2 Driving Factors
5.3 Market Challenges
5.4 Market Restraints
5.5 Industry News
5.5.1 New Product Developments
5.5.2 Mergers & Acquisitions
5.5.3 Expansions
5.5.4 Collaboration/Supply Contracts
5.6 Industry Policies
6 Microprinting Market Segmentation by Type
6.1 Evaluation Matrix of Segment Market Development Potential (Type)
6.2 Global Microprinting Sales Market Share by Type (2019-2025)
6.3 Global Microprinting Market Size Market Share by Type (2019-2025)
6.4 Global Microprinting Price by Type (2019-2025)
7 Microprinting Market Segmentation by Application
7.1 Evaluation Matrix of Segment Market Development Potential (Application)
7.2 Global Microprinting Market Sales by Application (2019-2025)
7.3 Global Microprinting Market Size (M USD) by Application (2019-2025)
7.4 Global Microprinting Sales Growth Rate by Application (2019-2025)
8 Microprinting Market Consumption by Region
8.1 Global Microprinting Sales by Region
8.1.1 Global Microprinting Sales by Region
8.1.2 Global Microprinting Sales Market Share by Region
8.2 North America
8.2.1 North America Microprinting Sales by Country
8.2.2 U.S.
8.2.3 Canada
8.2.4 Mexico
8.3 Europe
8.3.1 Europe Microprinting Sales by Country
8.3.2 Germany
8.3.3 France
8.3.4 U.K.
8.3.5 Italy
8.3.6 Russia
8.4 Asia Pacific
8.4.1 Asia Pacific Microprinting Sales by Region
8.4.2 China
8.4.3 Japan
8.4.4 South Korea
8.4.5 India
8.4.6 Southeast Asia
8.5 South America
8.5.1 South America Microprinting Sales by Country
8.5.2 Brazil
8.5.3 Argentina
8.5.4 Columbia
8.6 Middle East and Africa
8.6.1 Middle East and Africa Microprinting Sales by Region
8.6.2 Saudi Arabia
8.6.3 UAE
8.6.4 Egypt
8.6.5 Nigeria
8.6.6 South Africa
9 Microprinting Market Production by Region
9.1 Global Production of Microprinting by Region (2019-2025)
9.2 Global Microprinting Revenue Market Share by Region (2019-2025)
9.3 Global Microprinting Production, Revenue, Price and Gross Margin (2019-2025)
9.4 North America Microprinting Production
9.4.1 North America Microprinting Production Growth Rate (2019-2025)
9.4.2 North America Microprinting Production, Revenue, Price and Gross Margin (2019-2025)
9.5 Europe Microprinting Production
9.5.1 Europe Microprinting Production Growth Rate (2019-2025)
9.5.2 Europe Microprinting Production, Revenue, Price and Gross Margin (2019-2025)
9.6 Japan Microprinting Production (2019-2025)
9.6.1 Japan Microprinting Production Growth Rate (2019-2025)
9.6.2 Japan Microprinting Production, Revenue, Price and Gross Margin (2019-2025)
9.7 China Microprinting Production (2019-2025)
9.7.1 China Microprinting Production Growth Rate (2019-2025)
9.7.2 China Microprinting Production, Revenue, Price and Gross Margin (2019-2025)
10 Key Companies Profile
10.1 Sauressig
10.1.1 Sauressig Microprinting Basic Information
10.1.2 Sauressig Microprinting Product Overview
10.1.3 Sauressig Microprinting Product Market Performance
10.1.4 Sauressig Business Overview
10.1.5 Sauressig Microprinting SWOT Analysis
10.1.6 Sauressig Recent Developments
10.2 Diagramm Halbach
10.2.1 Diagramm Halbach Microprinting Basic Information
10.2.2 Diagramm Halbach Microprinting Product Overview
10.2.3 Diagramm Halbach Microprinting Product Market Performance
10.2.4 Diagramm Halbach Business Overview
10.2.5 Diagramm Halbach Microprinting SWOT Analysis
10.2.6 Diagramm Halbach Recent Developments
10.3 Xerox Corp
10.3.1 Xerox Corp Microprinting Basic Information
10.3.2 Xerox Corp Microprinting Product Overview
10.3.3 Xerox Corp Microprinting Product Market Performance
10.3.4 Xerox Corp Microprinting SWOT Analysis
10.3.5 Xerox Corp Business Overview
10.3.6 Xerox Corp Recent Developments
10.4 Micro Format
10.4.1 Micro Format Microprinting Basic Information
10.4.2 Micro Format Microprinting Product Overview
10.4.3 Micro Format Microprinting Product Market Performance
10.4.4 Micro Format Business Overview
10.4.5 Micro Format Recent Developments
10.5 Printegra
10.5.1 Printegra Microprinting Basic Information
10.5.2 Printegra Microprinting Product Overview
10.5.3 Printegra Microprinting Product Market Performance
10.5.4 Printegra Business Overview
10.5.5 Printegra Recent Developments
10.6 Team NiSCA
10.6.1 Team NiSCA Microprinting Basic Information
10.6.2 Team NiSCA Microprinting Product Overview
10.6.3 Team NiSCA Microprinting Product Market Performance
10.6.4 Team NiSCA Business Overview
10.6.5 Team NiSCA Recent Developments
10.7 Brady
10.7.1 Brady Microprinting Basic Information
10.7.2 Brady Microprinting Product Overview
10.7.3 Brady Microprinting Product Market Performance
10.7.4 Brady Business Overview
10.7.5 Brady Recent Developments
10.8 Gallas Label and Decal
10.8.1 Gallas Label and Decal Microprinting Basic Information
10.8.2 Gallas Label and Decal Microprinting Product Overview
10.8.3 Gallas Label and Decal Microprinting Product Market Performance
10.8.4 Gallas Label and Decal Business Overview
10.8.5 Gallas Label and Decal Recent Developments
10.9 Huber Group
10.9.1 Huber Group Microprinting Basic Information
10.9.2 Huber Group Microprinting Product Overview
10.9.3 Huber Group Microprinting Product Market Performance
10.9.4 Huber Group Business Overview
10.9.5 Huber Group Recent Developments
10.10 Troy Group
10.10.1 Troy Group Microprinting Basic Information
10.10.2 Troy Group Microprinting Product Overview
10.10.3 Troy Group Microprinting Product Market Performance
10.10.4 Troy Group Business Overview
10.10.5 Troy Group Recent Developments
10.11 Heidelberg Instruments
10.11.1 Heidelberg Instruments Microprinting Basic Information
10.11.2 Heidelberg Instruments Microprinting Product Overview
10.11.3 Heidelberg Instruments Microprinting Product Market Performance
10.11.4 Heidelberg Instruments Business Overview
10.11.5 Heidelberg Instruments Recent Developments
10.12 Hewlett Packard
10.12.1 Hewlett Packard Microprinting Basic Information
10.12.2 Hewlett Packard Microprinting Product Overview
10.12.3 Hewlett Packard Microprinting Product Market Performance
10.12.4 Hewlett Packard Business Overview
10.12.5 Hewlett Packard Recent Developments
10.13 GeSiM
10.13.1 GeSiM Microprinting Basic Information
10.13.2 GeSiM Microprinting Product Overview
10.13.3 GeSiM Microprinting Product Market Performance
10.13.4 GeSiM Business Overview
10.13.5 GeSiM Recent Developments
10.14 Smith and Ouzman
10.14.1 Smith and Ouzman Microprinting Basic Information
10.14.2 Smith and Ouzman Microprinting Product Overview
10.14.3 Smith and Ouzman Microprinting Product Market Performance
10.14.4 Smith and Ouzman Business Overview
10.14.5 Smith and Ouzman Recent Developments
10.15 Computastat Group
10.15.1 Computastat Group Microprinting Basic Information
10.15.2 Computastat Group Microprinting Product Overview
10.15.3 Computastat Group Microprinting Product Market Performance
10.15.4 Computastat Group Business Overview
10.15.5 Computastat Group Recent Developments
10.16 Trustcopy
10.16.1 Trustcopy Microprinting Basic Information
10.16.2 Trustcopy Microprinting Product Overview
10.16.3 Trustcopy Microprinting Product Market Performance
10.16.4 Trustcopy Business Overview
10.16.5 Trustcopy Recent Developments
10.17 Favini
10.17.1 Favini Microprinting Basic Information
10.17.2 Favini Microprinting Product Overview
10.17.3 Favini Microprinting Product Market Performance
10.17.4 Favini Business Overview
10.17.5 Favini Recent Developments
10.18 William Frick and Co
10.18.1 William Frick and Co Microprinting Basic Information
10.18.2 William Frick and Co Microprinting Product Overview
10.18.3 William Frick and Co Microprinting Product Market Performance
10.18.4 William Frick and Co Business Overview
10.18.5 William Frick and Co Recent Developments
10.19 MaxMax
10.19.1 MaxMax Microprinting Basic Information
10.19.2 MaxMax Microprinting Product Overview
10.19.3 MaxMax Microprinting Product Market Performance
10.19.4 MaxMax Business Overview
10.19.5 MaxMax Recent Developments
10.20 SAFEChecks
10.20.1 SAFEChecks Microprinting Basic Information
10.20.2 SAFEChecks Microprinting Product Overview
10.20.3 SAFEChecks Microprinting Product Market Performance
10.20.4 SAFEChecks Business Overview
10.20.5 SAFEChecks Recent Developments
10.21 Zebra Technologies
10.21.1 Zebra Technologies Microprinting Basic Information
10.21.2 Zebra Technologies Microprinting Product Overview
10.21.3 Zebra Technologies Microprinting Product Market Performance
10.21.4 Zebra Technologies Business Overview
10.21.5 Zebra Technologies Recent Developments
10.22 Data Carte Concepts
10.22.1 Data Carte Concepts Microprinting Basic Information
10.22.2 Data Carte Concepts Microprinting Product Overview
10.22.3 Data Carte Concepts Microprinting Product Market Performance
10.22.4 Data Carte Concepts Business Overview
10.22.5 Data Carte Concepts Recent Developments
10.23 Cardlogix
10.23.1 Cardlogix Microprinting Basic Information
10.23.2 Cardlogix Microprinting Product Overview
10.23.3 Cardlogix Microprinting Product Market Performance
10.23.4 Cardlogix Business Overview
10.23.5 Cardlogix Recent Developments
10.24 Spectrum Positive
10.24.1 Spectrum Positive Microprinting Basic Information
10.24.2 Spectrum Positive Microprinting Product Overview
10.24.3 Spectrum Positive Microprinting Product Market Performance
10.24.4 Spectrum Positive Business Overview
10.24.5 Spectrum Positive Recent Developments
11 Microprinting Market Forecast by Region
11.1 Global Microprinting Market Size Forecast
11.2 Global Microprinting Market Forecast by Region
11.2.1 North America Market Size Forecast by Country
11.2.2 Europe Microprinting Market Size Forecast by Country
11.2.3 Asia Pacific Microprinting Market Size Forecast by Region
11.2.4 South America Microprinting Market Size Forecast by Country
11.2.5 Middle East and Africa Forecasted Consumption of Microprinting by Country
12 Forecast Market by Type and by Application (2025-2032)
12.1 Global Microprinting Market Forecast by Type (2025-2032)
12.1.1 Global Forecasted Sales of Microprinting by Type (2025-2032)
12.1.2 Global Microprinting Market Size Forecast by Type (2025-2032)
12.1.3 Global Forecasted Price of Microprinting by Type (2025-2032)
12.2 Global Microprinting Market Forecast by Application (2025-2032)
12.2.1 Global Microprinting Sales (K Units) Forecast by Application
12.2.2 Global Microprinting Market Size (M USD) Forecast by Application (2025-2032)
13 Conclusion and Key FindingsList of Tables
Table 1. Introduction of the Type
Table 2. Introduction of the Application
Table 3. Market Size (M USD) Segment Executive Summary
Table 4. Microprinting Market Size Comparison by Region (M USD)
Table 5. Global Microprinting Sales (K Units) by Manufacturers (2019-2025)
Table 6. Global Microprinting Sales Market Share by Manufacturers (2019-2025)
Table 7. Global Microprinting Revenue (M USD) by Manufacturers (2019-2025)
Table 8. Global Microprinting Revenue Share by Manufacturers (2019-2025)
Table 9. Company Type (Tier 1, Tier 2, and Tier 3) & (based on the Revenue in Microprinting as of 2022)
Table 10. Global Market Microprinting Average Price (USD/Unit) of Key Manufacturers (2019-2025)
Table 11. Manufacturers Microprinting Sales Sites and Area Served
Table 12. Manufacturers Microprinting Product Type
Table 13. Global Microprinting Manufacturers Market Concentration Ratio (CR5 and HHI)
Table 14. Mergers & Acquisitions, Expansion Plans
Table 15. Industry Chain Map of Microprinting
Table 16. Market Overview of Key Raw Materials
Table 17. Midstream Market Analysis
Table 18. Downstream Customer Analysis
Table 19. Key Development Trends
Table 20. Driving Factors
Table 21. Microprinting Market Challenges
Table 22. Global Microprinting Sales by Type (K Units)
Table 23. Global Microprinting Market Size by Type (M USD)
Table 24. Global Microprinting Sales (K Units) by Type (2019-2025)
Table 25. Global Microprinting Sales Market Share by Type (2019-2025)
Table 26. Global Microprinting Market Size (M USD) by Type (2019-2025)
Table 27. Global Microprinting Market Size Share by Type (2019-2025)
Table 28. Global Microprinting Price (USD/Unit) by Type (2019-2025)
Table 29. Global Microprinting Sales (K Units) by Application
Table 30. Global Microprinting Market Size by Application
Table 31. Global Microprinting Sales by Application (2019-2025) & (K Units)
Table 32. Global Microprinting Sales Market Share by Application (2019-2025)
Table 33. Global Microprinting Sales by Application (2019-2025) & (M USD)
Table 34. Global Microprinting Market Share by Application (2019-2025)
Table 35. Global Microprinting Sales Growth Rate by Application (2019-2025)
Table 36. Global Microprinting Sales by Region (2019-2025) & (K Units)
Table 37. Global Microprinting Sales Market Share by Region (2019-2025)
Table 38. North America Microprinting Sales by Country (2019-2025) & (K Units)
Table 39. Europe Microprinting Sales by Country (2019-2025) & (K Units)
Table 40. Asia Pacific Microprinting Sales by Region (2019-2025) & (K Units)
Table 41. South America Microprinting Sales by Country (2019-2025) & (K Units)
Table 42. Middle East and Africa Microprinting Sales by Region (2019-2025) & (K Units)
Table 43. Global Microprinting Production (K Units) by Region (2019-2025)
Table 44. Global Microprinting Revenue (US$ Million) by Region (2019-2025)
Table 45. Global Microprinting Revenue Market Share by Region (2019-2025)
Table 46. Global Microprinting Production (K Units), Revenue (US$ Million), Price (USD/Unit) and Gross Margin (2019-2025)
Table 47. North America Microprinting Production (K Units), Revenue (US$ Million), Price (USD/Unit) and Gross Margin (2019-2025)
Table 48. Europe Microprinting Production (K Units), Revenue (US$ Million), Price (USD/Unit) and Gross Margin (2019-2025)
Table 49. Japan Microprinting Production (K Units), Revenue (US$ Million), Price (USD/Unit) and Gross Margin (2019-2025)
Table 50. China Microprinting Production (K Units), Revenue (US$ Million), Price (USD/Unit) and Gross Margin (2019-2025)
Table 51. Sauressig Microprinting Basic Information
Table 52. Sauressig Microprinting Product Overview
Table 53. Sauressig Microprinting Sales (K Units), Revenue (M USD), Price (USD/Unit) and Gross Margin (2019-2025)
Table 54. Sauressig Business Overview
Table 55. Sauressig Microprinting SWOT Analysis
Table 56. Sauressig Recent Developments
Table 57. Diagramm Halbach Microprinting Basic Information
Table 58. Diagramm Halbach Microprinting Product Overview
Table 59. Diagramm Halbach Microprinting Sales (K Units), Revenue (M USD), Price (USD/Unit) and Gross Margin (2019-2025)
Table 60. Diagramm Halbach Business Overview
Table 61. Diagramm Halbach Microprinting SWOT Analysis
Table 62. Diagramm Halbach Recent Developments
Table 63. Xerox Corp Microprinting Basic Information
Table 64. Xerox Corp Microprinting Product Overview
Table 65. Xerox Corp Microprinting Sales (K Units), Revenue (M USD), Price (USD/Unit) and Gross Margin (2019-2025)
Table 66. Xerox Corp Microprinting SWOT Analysis
Table 67. Xerox Corp Business Overview
Table 68. Xerox Corp Recent Developments
Table 69. Micro Format Microprinting Basic Information
Table 70. Micro Format Microprinting Product Overview
Table 71. Micro Format Microprinting Sales (K Units), Revenue (M USD), Price (USD/Unit) and Gross Margin (2019-2025)
Table 72. Micro Format Business Overview
Table 73. Micro Format Recent Developments
Table 74. Printegra Microprinting Basic Information
Table 75. Printegra Microprinting Product Overview
Table 76. Printegra Microprinting Sales (K Units), Revenue (M USD), Price (USD/Unit) and Gross Margin (2019-2025)
Table 77. Printegra Business Overview
Table 78. Printegra Recent Developments
Table 79. Team NiSCA Microprinting Basic Information
Table 80. Team NiSCA Microprinting Product Overview
Table 81. Team NiSCA Microprinting Sales (K Units), Revenue (M USD), Price (USD/Unit) and Gross Margin (2019-2025)
Table 82. Team NiSCA Business Overview
Table 83. Team NiSCA Recent Developments
Table 84. Brady Microprinting Basic Information
Table 85. Brady Microprinting Product Overview
Table 86. Brady Microprinting Sales (K Units), Revenue (M USD), Price (USD/Unit) and Gross Margin (2019-2025)
Table 87. Brady Business Overview
Table 88. Brady Recent Developments
Table 89. Gallas Label and Decal Microprinting Basic Information
Table 90. Gallas Label and Decal Microprinting Product Overview
Table 91. Gallas Label and Decal Microprinting Sales (K Units), Revenue (M USD), Price (USD/Unit) and Gross Margin (2019-2025)
Table 92. Gallas Label and Decal Business Overview
Table 93. Gallas Label and Decal Recent Developments
Table 94. Huber Group Microprinting Basic Information
Table 95. Huber Group Microprinting Product Overview
Table 96. Huber Group Microprinting Sales (K Units), Revenue (M USD), Price (USD/Unit) and Gross Margin (2019-2025)
Table 97. Huber Group Business Overview
Table 98. Huber Group Recent Developments
Table 99. Troy Group Microprinting Basic Information
Table 100. Troy Group Microprinting Product Overview
Table 101. Troy Group Microprinting Sales (K Units), Revenue (M USD), Price (USD/Unit) and Gross Margin (2019-2025)
Table 102. Troy Group Business Overview
Table 103. Troy Group Recent Developments
Table 104. Heidelberg Instruments Microprinting Basic Information
Table 105. Heidelberg Instruments Microprinting Product Overview
Table 106. Heidelberg Instruments Microprinting Sales (K Units), Revenue (M USD), Price (USD/Unit) and Gross Margin (2019-2025)
Table 107. Heidelberg Instruments Business Overview
Table 108. Heidelberg Instruments Recent Developments
Table 109. Hewlett Packard Microprinting Basic Information
Table 110. Hewlett Packard Microprinting Product Overview
Table 111. Hewlett Packard Microprinting Sales (K Units), Revenue (M USD), Price (USD/Unit) and Gross Margin (2019-2025)
Table 112. Hewlett Packard Business Overview
Table 113. Hewlett Packard Recent Developments
Table 114. GeSiM Microprinting Basic Information
Table 115. GeSiM Microprinting Product Overview
Table 116. GeSiM Microprinting Sales (K Units), Revenue (M USD), Price (USD/Unit) and Gross Margin (2019-2025)
Table 117. GeSiM Business Overview
Table 118. GeSiM Recent Developments
Table 119. Smith and Ouzman Microprinting Basic Information
Table 120. Smith and Ouzman Microprinting Product Overview
Table 121. Smith and Ouzman Microprinting Sales (K Units), Revenue (M USD), Price (USD/Unit) and Gross Margin (2019-2025)
Table 122. Smith and Ouzman Business Overview
Table 123. Smith and Ouzman Recent Developments
Table 124. Computastat Group Microprinting Basic Information
Table 125. Computastat Group Microprinting Product Overview
Table 126. Computastat Group Microprinting Sales (K Units), Revenue (M USD), Price (USD/Unit) and Gross Margin (2019-2025)
Table 127. Computastat Group Business Overview
Table 128. Computastat Group Recent Developments
Table 129. Trustcopy Microprinting Basic Information
Table 130. Trustcopy Microprinting Product Overview
Table 131. Trustcopy Microprinting Sales (K Units), Revenue (M USD), Price (USD/Unit) and Gross Margin (2019-2025)
Table 132. Trustcopy Business Overview
Table 133. Trustcopy Recent Developments
Table 134. Favini Microprinting Basic Information
Table 135. Favini Microprinting Product Overview
Table 136. Favini Microprinting Sales (K Units), Revenue (M USD), Price (USD/Unit) and Gross Margin (2019-2025)
Table 137. Favini Business Overview
Table 138. Favini Recent Developments
Table 139. William Frick and Co Microprinting Basic Information
Table 140. William Frick and Co Microprinting Product Overview
Table 141. William Frick and Co Microprinting Sales (K Units), Revenue (M USD), Price (USD/Unit) and Gross Margin (2019-2025)
Table 142. William Frick and Co Business Overview
Table 143. William Frick and Co Recent Developments
Table 144. MaxMax Microprinting Basic Information
Table 145. MaxMax Microprinting Product Overview
Table 146. MaxMax Microprinting Sales (K Units), Revenue (M USD), Price (USD/Unit) and Gross Margin (2019-2025)
Table 147. MaxMax Business Overview
Table 148. MaxMax Recent Developments
Table 149. SAFEChecks Microprinting Basic Information
Table 150. SAFEChecks Microprinting Product Overview
Table 151. SAFEChecks Microprinting Sales (K Units), Revenue (M USD), Price (USD/Unit) and Gross Margin (2019-2025)
Table 152. SAFEChecks Business Overview
Table 153. SAFEChecks Recent Developments
Table 154. Zebra Technologies Microprinting Basic Information
Table 155. Zebra Technologies Microprinting Product Overview
Table 156. Zebra Technologies Microprinting Sales (K Units), Revenue (M USD), Price (USD/Unit) and Gross Margin (2019-2025)
Table 157. Zebra Technologies Business Overview
Table 158. Zebra Technologies Recent Developments
Table 159. Data Carte Concepts Microprinting Basic Information
Table 160. Data Carte Concepts Microprinting Product Overview
Table 161. Data Carte Concepts Microprinting Sales (K Units), Revenue (M USD), Price (USD/Unit) and Gross Margin (2019-2025)
Table 162. Data Carte Concepts Business Overview
Table 163. Data Carte Concepts Recent Developments
Table 164. Cardlogix Microprinting Basic Information
Table 165. Cardlogix Microprinting Product Overview
Table 166. Cardlogix Microprinting Sales (K Units), Revenue (M USD), Price (USD/Unit) and Gross Margin (2019-2025)
Table 167. Cardlogix Business Overview
Table 168. Cardlogix Recent Developments
Table 169. Spectrum Positive Microprinting Basic Information
Table 170. Spectrum Positive Microprinting Product Overview
Table 171. Spectrum Positive Microprinting Sales (K Units), Revenue (M USD), Price (USD/Unit) and Gross Margin (2019-2025)
Table 172. Spectrum Positive Business Overview
Table 173. Spectrum Positive Recent Developments
Table 174. Global Microprinting Sales Forecast by Region (2025-2032) & (K Units)
Table 175. Global Microprinting Market Size Forecast by Region (2025-2032) & (M USD)
Table 176. North America Microprinting Sales Forecast by Country (2025-2032) & (K Units)
Table 177. North America Microprinting Market Size Forecast by Country (2025-2032) & (M USD)
Table 178. Europe Microprinting Sales Forecast by Country (2025-2032) & (K Units)
Table 179. Europe Microprinting Market Size Forecast by Country (2025-2032) & (M USD)
Table 180. Asia Pacific Microprinting Sales Forecast by Region (2025-2032) & (K Units)
Table 181. Asia Pacific Microprinting Market Size Forecast by Region (2025-2032) & (M USD)
Table 182. South America Microprinting Sales Forecast by Country (2025-2032) & (K Units)
Table 183. South America Microprinting Market Size Forecast by Country (2025-2032) & (M USD)
Table 184. Middle East and Africa Microprinting Consumption Forecast by Country (2025-2032) & (Units)
Table 185. Middle East and Africa Microprinting Market Size Forecast by Country (2025-2032) & (M USD)
Table 186. Global Microprinting Sales Forecast by Type (2025-2032) & (K Units)
Table 187. Global Microprinting Market Size Forecast by Type (2025-2032) & (M USD)
Table 188. Global Microprinting Price Forecast by Type (2025-2032) & (USD/Unit)
Table 189. Global Microprinting Sales (K Units) Forecast by Application (2025-2032)
Table 190. Global Microprinting Market Size Forecast by Application (2025-2032) & (M USD)
List of Figures
Figure 1. Product Picture of Microprinting
Figure 2. Data Triangulation
Figure 3. Key Caveats
Figure 4. Global Microprinting Market Size (M USD), 2019-2032
Figure 5. Global Microprinting Market Size (M USD) (2019-2032)
Figure 6. Global Microprinting Sales (K Units) & (2019-2032)
Figure 7. Evaluation Matrix of Segment Market Development Potential (Type)
Figure 8. Evaluation Matrix of Segment Market Development Potential (Application)
Figure 9. Evaluation Matrix of Regional Market Development Potential
Figure 10. Microprinting Market Size by Country (M USD)
Figure 11. Microprinting Sales Share by Manufacturers in 2023
Figure 12. Global Microprinting Revenue Share by Manufacturers in 2023
Figure 13. Microprinting Market Share by Company Type (Tier 1, Tier 2 and Tier 3): 2023
Figure 14. Global Market Microprinting Average Price (USD/Unit) of Key Manufacturers in 2023
Figure 15. The Global 5 and 10 Largest Players: Market Share by Microprinting Revenue in 2023
Figure 16. Evaluation Matrix of Segment Market Development Potential (Type)
Figure 17. Global Microprinting Market Share by Type
Figure 18. Sales Market Share of Microprinting by Type (2019-2025)
Figure 19. Sales Market Share of Microprinting by Type in 2023
Figure 20. Market Size Share of Microprinting by Type (2019-2025)
Figure 21. Market Size Market Share of Microprinting by Type in 2023
Figure 22. Evaluation Matrix of Segment Market Development Potential (Application)
Figure 23. Global Microprinting Market Share by Application
Figure 24. Global Microprinting Sales Market Share by Application (2019-2025)
Figure 25. Global Microprinting Sales Market Share by Application in 2023
Figure 26. Global Microprinting Market Share by Application (2019-2025)
Figure 27. Global Microprinting Market Share by Application in 2023
Figure 28. Global Microprinting Sales Growth Rate by Application (2019-2025)
Figure 29. Global Microprinting Sales Market Share by Region (2019-2025)
Figure 30. North America Microprinting Sales and Growth Rate (2019-2025) & (K Units)
Figure 31. North America Microprinting Sales Market Share by Country in 2023
Figure 32. U.S. Microprinting Sales and Growth Rate (2019-2025) & (K Units)
Figure 33. Canada Microprinting Sales (K Units) and Growth Rate (2019-2025)
Figure 34. Mexico Microprinting Sales (Units) and Growth Rate (2019-2025)
Figure 35. Europe Microprinting Sales and Growth Rate (2019-2025) & (K Units)
Figure 36. Europe Microprinting Sales Market Share by Country in 2023
Figure 37. Germany Microprinting Sales and Growth Rate (2019-2025) & (K Units)
Figure 38. France Microprinting Sales and Growth Rate (2019-2025) & (K Units)
Figure 39. U.K. Microprinting Sales and Growth Rate (2019-2025) & (K Units)
Figure 40. Italy Microprinting Sales and Growth Rate (2019-2025) & (K Units)
Figure 41. Russia Microprinting Sales and Growth Rate (2019-2025) & (K Units)
Figure 42. Asia Pacific Microprinting Sales and Growth Rate (K Units)
Figure 43. Asia Pacific Microprinting Sales Market Share by Region in 2023
Figure 44. China Microprinting Sales and Growth Rate (2019-2025) & (K Units)
Figure 45. Japan Microprinting Sales and Growth Rate (2019-2025) & (K Units)
Figure 46. South Korea Microprinting Sales and Growth Rate (2019-2025) & (K Units)
Figure 47. India Microprinting Sales and Growth Rate (2019-2025) & (K Units)
Figure 48. Southeast Asia Microprinting Sales and Growth Rate (2019-2025) & (K Units)
Figure 49. South America Microprinting Sales and Growth Rate (K Units)
Figure 50. South America Microprinting Sales Market Share by Country in 2023
Figure 51. Brazil Microprinting Sales and Growth Rate (2019-2025) & (K Units)
Figure 52. Argentina Microprinting Sales and Growth Rate (2019-2025) & (K Units)
Figure 53. Columbia Microprinting Sales and Growth Rate (2019-2025) & (K Units)
Figure 54. Middle East and Africa Microprinting Sales and Growth Rate (K Units)
Figure 55. Middle East and Africa Microprinting Sales Market Share by Region in 2023
Figure 56. Saudi Arabia Microprinting Sales and Growth Rate (2019-2025) & (K Units)
Figure 57. UAE Microprinting Sales and Growth Rate (2019-2025) & (K Units)
Figure 58. Egypt Microprinting Sales and Growth Rate (2019-2025) & (K Units)
Figure 59. Nigeria Microprinting Sales and Growth Rate (2019-2025) & (K Units)
Figure 60. South Africa Microprinting Sales and Growth Rate (2019-2025) & (K Units)
Figure 61. Global Microprinting Production Market Share by Region (2019-2025)
Figure 62. North America Microprinting Production (K Units) Growth Rate (2019-2025)
Figure 63. Europe Microprinting Production (K Units) Growth Rate (2019-2025)
Figure 64. Japan Microprinting Production (K Units) Growth Rate (2019-2025)
Figure 65. China Microprinting Production (K Units) Growth Rate (2019-2025)
Figure 66. Global Microprinting Sales Forecast by Volume (2019-2032) & (K Units)
Figure 67. Global Microprinting Market Size Forecast by Value (2019-2032) & (M USD)
Figure 68. Global Microprinting Sales Market Share Forecast by Type (2025-2032)
Figure 69. Global Microprinting Market Share Forecast by Type (2025-2032)
Figure 70. Global Microprinting Sales Forecast by Application (2025-2032)
Figure 71. Global Microprinting Market Share Forecast by Application (2025-2032)