Machine Vision in Mobile Devices Market Overview
Machine Vision in Mobile Devices refers to the integration of computer vision technology into smartphones and tablets. This technology allows mobile devices to capture and process visual data, enabling features such as facial recognition, augmented reality applications, barcode scanning, and object tracking. Machine vision enhances the capabilities of mobile devices and opens up new possibilities for interactive and information-rich user experiences.
This report provides a deep insight into the global Machine Vision in Mobile Devices market covering all its essential aspects. This ranges from a macro overview of the market to micro details of the market size, competitive landscape, development trend, niche market, key market drivers and challenges, SWOT analysis, value chain analysis, etc.
The analysis helps the reader to shape the competition within the industries and strategies for the competitive environment to enhance the potential profit. Furthermore, it provides a simple framework for evaluating and accessing the position of the business organization. The report structure also focuses on the competitive landscape of the Global Machine Vision in Mobile Devices Market, this report introduces in detail the market share, market performance, product situation, operation situation, etc. of the main players, which helps the readers in the industry to identify the main competitors and deeply understand the competition pattern of the market.
In a word, this report is a must-read for industry players, investors, researchers, consultants, business strategists, and all those who have any kind of stake or are planning to foray into the Machine Vision in Mobile Devices market in any manner.
Machine Vision in Mobile Devices Market Analysis:
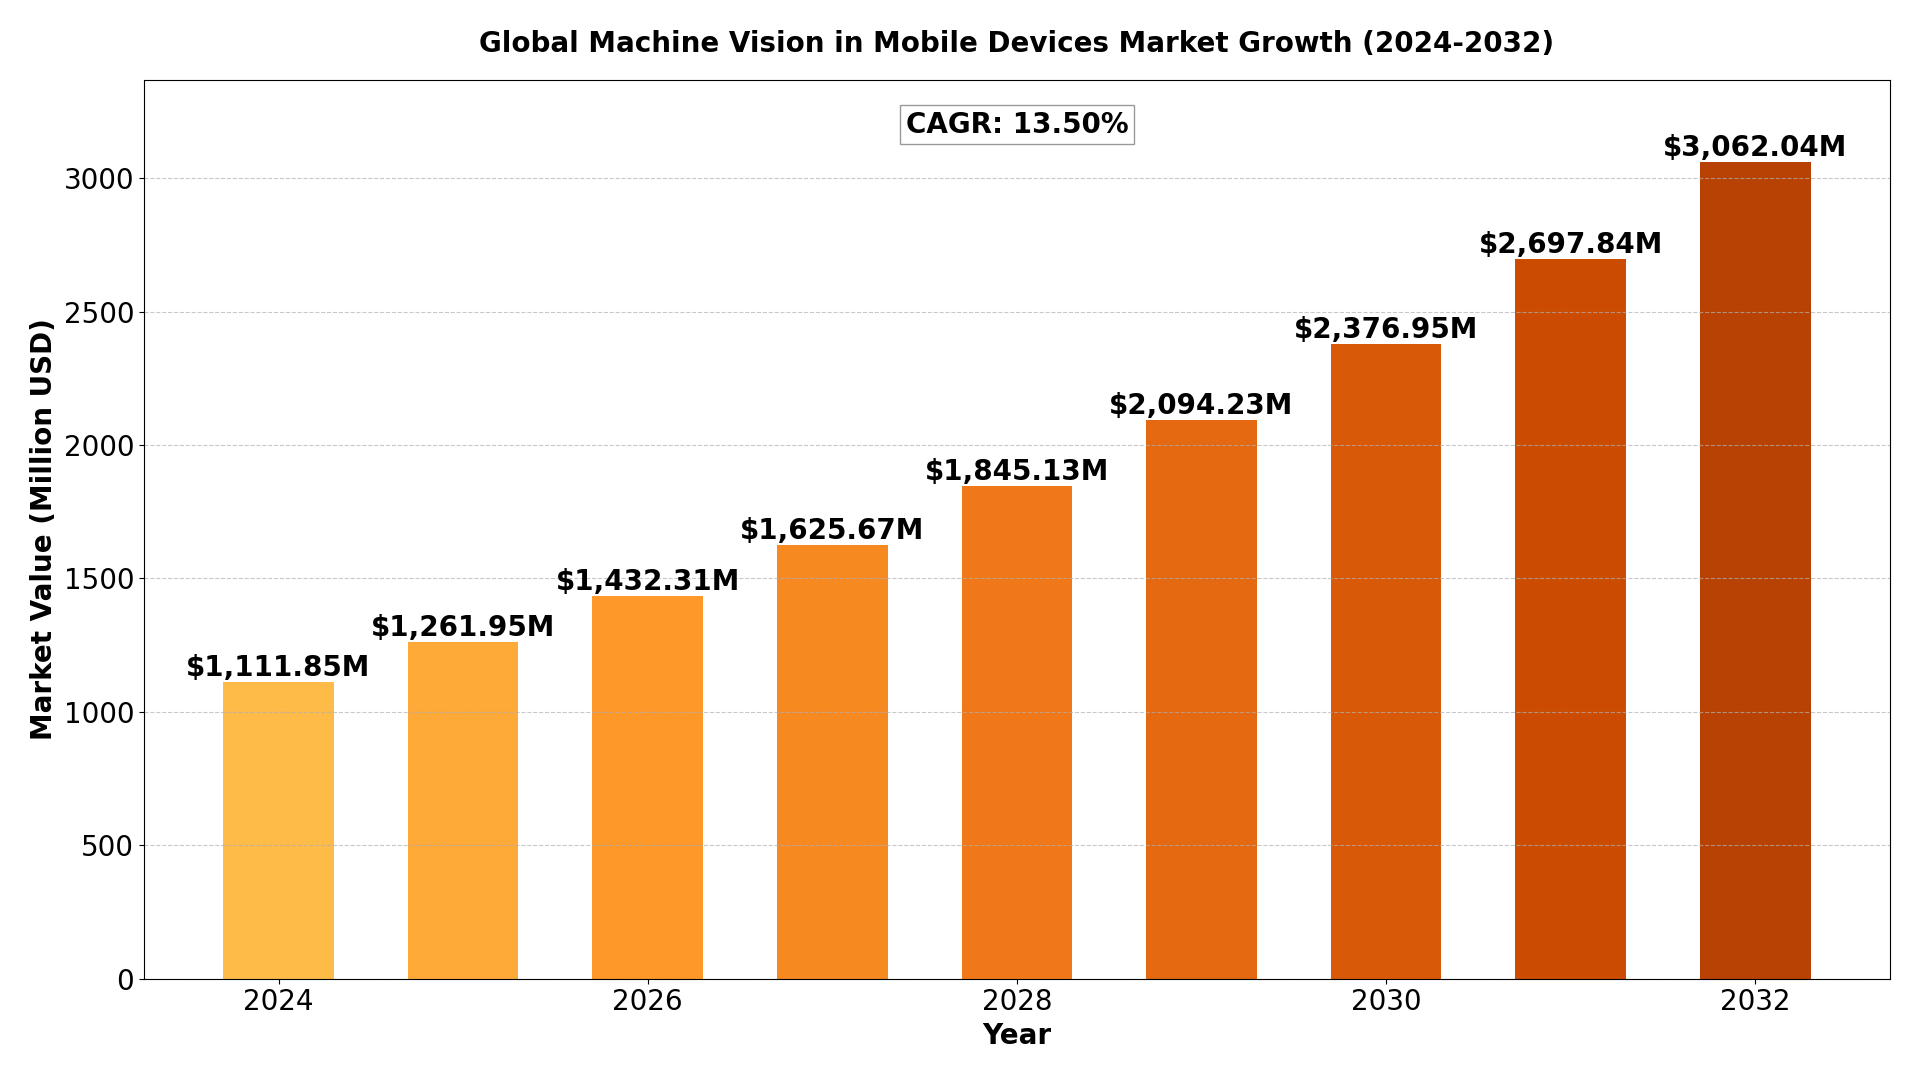
The Global Machine Vision in Mobile Devices Market was estimated at USD 979.60 million in 2023 and is projected to reach USD 3062.04 million by 2032, exhibiting a CAGR of 13.50% during the forecast period.
North America Machine Vision in Mobile Devices market size was estimated at USD 317.75 million in 2023, at a CAGR of 11.57% during the forecast period of 2025 through 2032.
Machine Vision in Mobile Devices Key Market Trends :
- Advancements in AI and Deep Learning
- AI-powered machine vision is enhancing real-time image processing, facial recognition, and AR applications in mobile devices.
- Integration of AR and VR
- Augmented reality and virtual reality applications are driving the adoption of machine vision, improving gaming, navigation, and shopping experiences.
- Enhanced Camera Capabilities
- Smartphone manufacturers are integrating multi-lens setups and advanced sensors to improve object detection and scene recognition.
- Growing Demand for Contactless Authentication
- Biometric authentication, including facial recognition, is gaining traction due to increased security concerns and seamless user experiences.
- Expansion in 5G Connectivity
- High-speed 5G networks enable faster data processing, enhancing the capabilities of machine vision applications in mobile devices.
Machine Vision in Mobile Devices Market Regional Analysis :

- North America:Strong demand driven by EVs, 5G infrastructure, and renewable energy, with the U.S. leading the market.
- Europe:Growth fueled by automotive electrification, renewable energy, and strong regulatory support, with Germany as a key player.
- Asia-Pacific:Dominates the market due to large-scale manufacturing in China and Japan, with growing demand from EVs, 5G, and semiconductors.
- South America:Emerging market, driven by renewable energy and EV adoption, with Brazil leading growth.
- Middle East & Africa:Gradual growth, mainly due to investments in renewable energy and EV infrastructure, with Saudi Arabia and UAE as key contributors.
Machine Vision in Mobile Devices Market Segmentation
The research report includes specific segments by region (country), manufacturers, Type, and Application. Market segmentation creates subsets of a market based on product type, end-user or application, Geographic, and other factors. By understanding the market segments, the decision-maker can leverage this targeting in the product, sales, and marketing strategies. Market segments can power your product development cycles by informing how you create product offerings for different segments.
Key Company
- Apple Inc.
- Samsung
- Huawei
- Intel Corporation
- Helio
- LG
- Movidius
- MediaTek Inc
- Qualcomm Inc
- CEVA
- Inc.
- Motorola Inc
- Amazon
- Hardware
- Software
- Smartphones
- Tablets
- Others
Drivers:
- Rising Adoption of AI and IoT
AI-driven machine vision in mobile devices is improving real-time image processing and user interaction, driving market growth. - Surge in Augmented Reality Applications
The demand for AR-powered mobile applications in gaming, shopping, and healthcare is pushing the integration of machine vision technology. - Advancements in Smartphone Camera Technology
Mobile manufacturers are equipping devices with high-resolution sensors and AI-powered enhancements to improve object recognition and photography.
Restraints:
- High Implementation Costs
Developing and integrating machine vision technology requires significant investment, making it challenging for smaller manufacturers. - Privacy and Security Concerns
The increasing use of facial recognition and biometric authentication raises concerns about data privacy and potential security breaches. - Limited Processing Power in Mobile Devices
Machine vision applications require substantial computational power, which can be constrained by the hardware limitations of mobile devices.
Opportunities:
- Expansion of Smart Wearables
Growing adoption of AI-powered smart glasses and wearables creates new opportunities for machine vision in consumer electronics. - Rising Demand in Healthcare and Retail
Machine vision in mobile devices is increasingly used for telemedicine, diagnostics, and enhanced retail experiences, fueling market growth. - Collaboration with Cloud Computing
Cloud-based AI processing can help overcome hardware limitations, allowing mobile devices to perform complex vision tasks efficiently.
Challenges:
- Regulatory and Compliance Issues
Strict government regulations regarding facial recognition and biometric data usage can slow down market adoption. - Competition Among Key Players
Major tech giants are continuously innovating, leading to a highly competitive market with rapid technological shifts. - Battery Consumption Concerns
High power consumption by machine vision applications can affect battery life, limiting user adoption and performance.
Key Benefits of This Market Research:
- Industry drivers, restraints, and opportunities covered in the study
- Neutral perspective on the market performance
- Recent industry trends and developments
- Competitive landscape & strategies of key players
- Potential & niche segments and regions exhibiting promising growth covered
- Historical, current, and projected market size, in terms of value
- In-depth analysis of the Machine Vision in Mobile Devices Market
- Overview of the regional outlook of the Machine Vision in Mobile Devices Market:
Key Reasons to Buy this Report:
- Access to date statistics compiled by our researchers. These provide you with historical and forecast data, which is analyzed to tell you why your market is set to change
- This enables you to anticipate market changes to remain ahead of your competitors
- You will be able to copy data from the Excel spreadsheet straight into your marketing plans, business presentations, or other strategic documents
- The concise analysis, clear graph, and table format will enable you to pinpoint the information you require quickly
- Provision of market value data for each segment and sub-segment
- Indicates the region and segment that is expected to witness the fastest growth as well as to dominate the market
- Provides insight into the market through Value Chain
- Market dynamics scenario, along with growth opportunities of the market in the years to come
- 6-month post-sales analyst support
Customization of the Report
In case of any queries or customization requirements, please connect with our sales team, who will ensure that your requirements are met.
FAQs:
Q: What are the key driving factors and opportunities in the Machine Vision in Mobile Devices market?
A: The key drivers include advancements in AI, increasing adoption of AR applications, and improvements in smartphone camera technology. Opportunities lie in smart wearables, healthcare, and cloud integration.
Q: Which region is projected to have the largest market share?
A: North America is expected to lead the market due to technological advancements, high smartphone penetration, and early adoption of AI-driven applications.
Q: Who are the top players in the global Machine Vision in Mobile Devices market?
A: Key players include Google, Apple Inc., Samsung, Huawei, Intel Corporation, Qualcomm Inc., MediaTek Inc., and Amazon.
Q: What are the latest technological advancements in the industry?
A: The latest advancements include AI-powered real-time image processing, AR/VR integrations, multi-lens smartphone cameras, and 5G-enabled machine vision applications.
Q: What is the current size of the global Machine Vision in Mobile Devices market?
A: The market was valued at USD 979.60 million in 2023 and is projected to reach USD 3062.04 million by 2032, growing at a CAGR of 13.50%.

Get Sample Report PDF for Exclusive Insights
Report Sample Includes
- Table of Contents
- List of Tables & Figures
- Charts, Research Methodology, and more...