Introduction
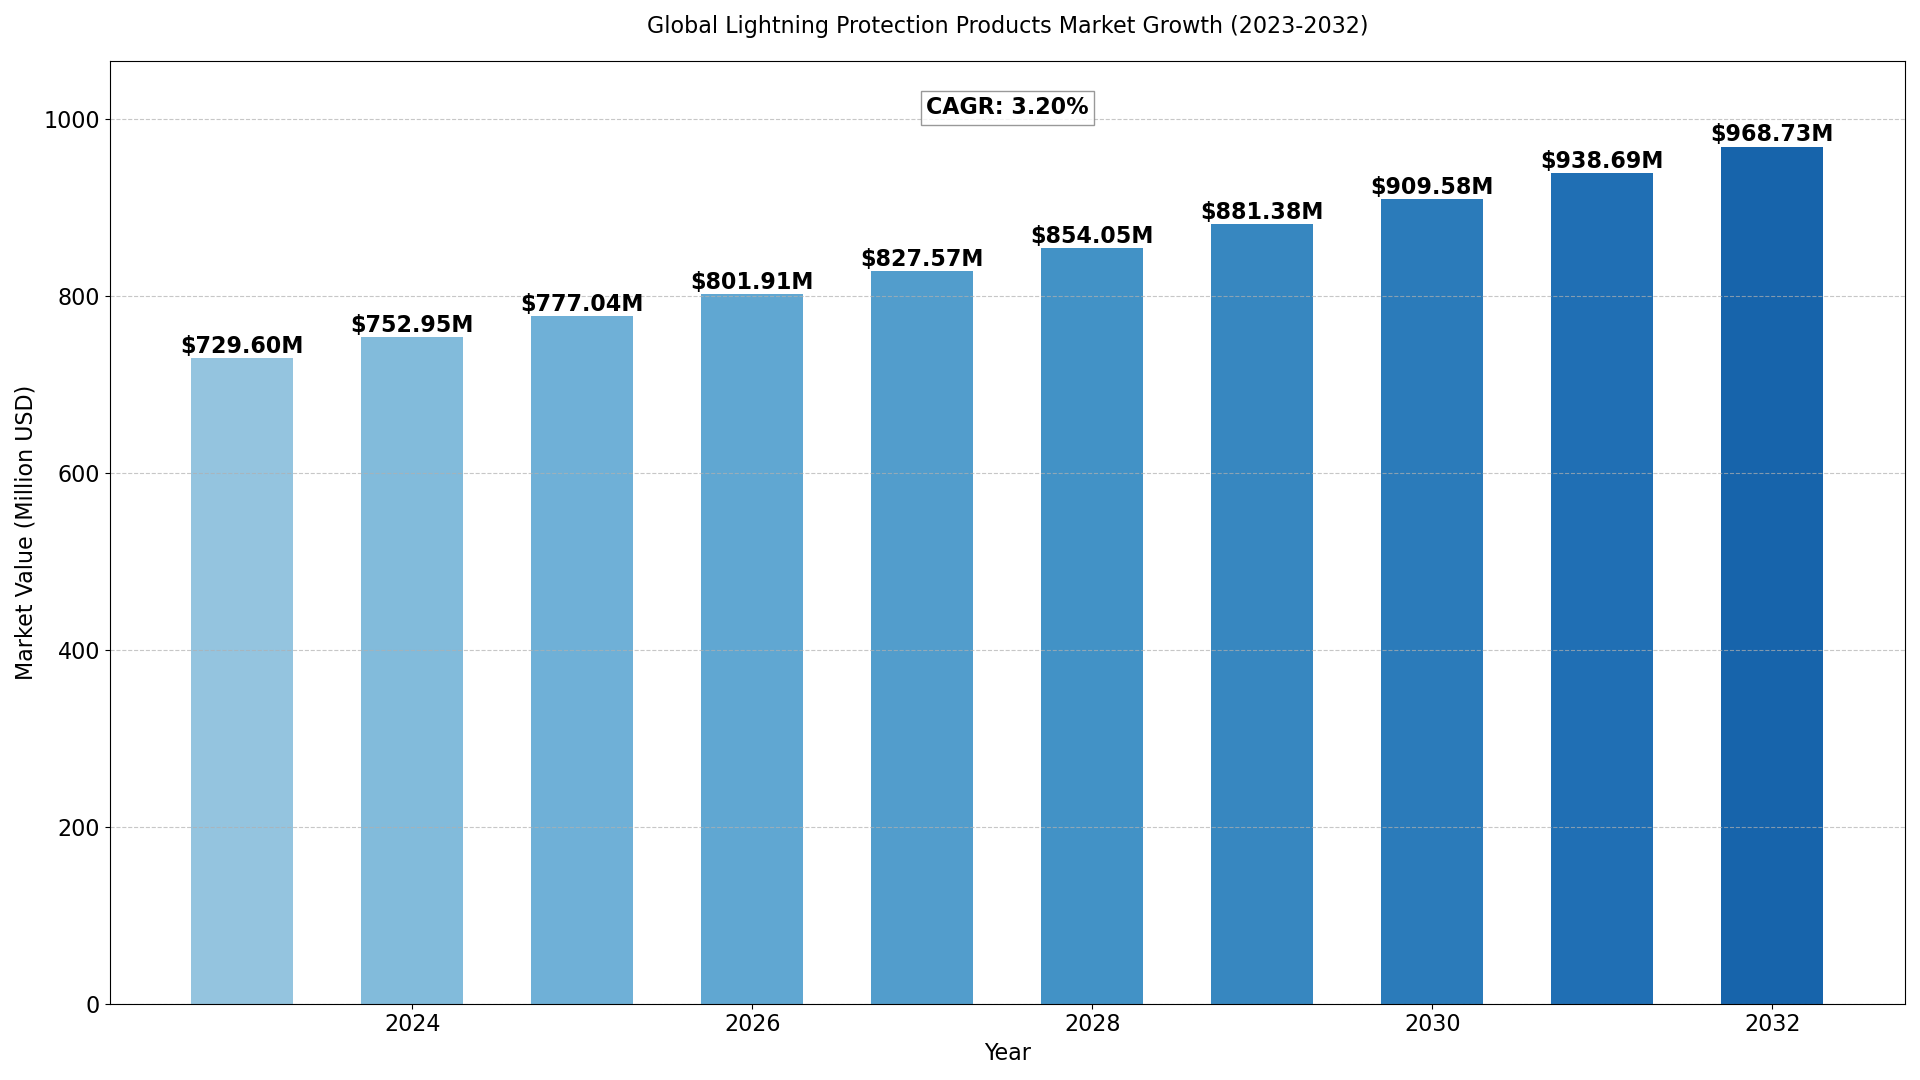
The Global Lightning Protection Products Market size was estimated at USD 729.60 million in 2023 and is projected to reach USD 968.73 million by 2032, exhibiting a CAGR of 3.20% during the forecast period.
North America Lightning Protection Products market size was estimated at USD 200.68 million in 2023, at a CAGR of 2.74% during the forecast period of 2025 through 2032.
Report Overview
Lightning protection products deliver complete protection against lightning risk, safeguard critical equipment along with transient overvoltage protection with an effective, low resistance route from lightning protection system to earth. The function of lightning protection products is to intercept, conduct, and disperse lightning strikes safely to the earth’s surface and without such product building structure, electrical systems are all at high risk. Lightning protection products can prevent from lost or destroyed data, repair work mainly costly for remote or unmanned installations, equipment damage, loss of essential services, and fire & electric shock hazards. The main components of lightning protection systems are rods, cables, and air terminals that work together to carry immense current away from the structure, prevent fire, and most appliance damage.
This report provides a deep insight into the global Lightning Protection Products market covering all its essential aspects. This ranges from a macro overview of the market to micro details of the market size, competitive landscape, development trend, niche market, key market drivers and challenges, SWOT analysis, value chain analysis, etc.
The analysis helps the reader to shape the competition within the industries and strategies for the competitive environment to enhance the potential profit. Furthermore, it provides a simple framework for evaluating and accessing the position of the business organization. The report structure also focuses on the competitive landscape of the Global Lightning Protection Products Market, this report introduces in detail the market share, market performance, product situation, operation situation, etc. of the main players, which helps the readers in the industry to identify the main competitors and deeply understand the competition pattern of the market.
In a word, this report is a must-read for industry players, investors, researchers, consultants, business strategists, and all those who have any kind of stake or are planning to foray into the Lightning Protection Products market in any manner.
Global Lightning Protection Products Market: Market Segmentation Analysis
The research report includes specific segments by region (country), manufacturers, Type, and Application. Market segmentation creates subsets of a market based on product type, end-user or application, Geographic, and other factors. By understanding the market segments, the decision-maker can leverage this targeting in the product, sales, and marketing strategies. Market segments can power your product development cycles by informing how you create product offerings for different segments.
Click Here to Download Your Free Sample Report
Key Company
- Pentair
- Harger
- Alltec Corporation
- AN Wallis
- Fatech Electronic
- NexTek
- AXIS Electrical Components
- K.M.L.Technology
- MTL Instruments Group
- Lightning Protection International
- Kumwell
- Lightning Master
- ABB
- Streamer
- TSTLP
- Independent Protection
- Fatech Electronic
- Raycap
Market Segmentation (by Type)
- Air Terminals & Adaptors
- Conductors
- Fittings & Connectors
- Grounding Equipment
- Surge Protectors
- Others
Market Segmentation (by Application)
- Building & Factories
- Electric Power
- Transportation
- Oil & Gas
- Others
Geographic Segmentation
- North America (USA, Canada, Mexico)
- Europe (Germany, UK, France, Russia, Italy, Rest of Europe)
- Asia-Pacific (China, Japan, South Korea, India, Southeast Asia, Rest of Asia-Pacific)
- South America (Brazil, Argentina, Columbia, Rest of South America)
- The Middle East and Africa (Saudi Arabia, UAE, Egypt, Nigeria, South Africa, Rest of MEA)
Key Benefits of This Market Research:
- Industry drivers, restraints, and opportunities covered in the study
- Neutral perspective on the market performance
- Recent industry trends and developments
- Competitive landscape & strategies of key players
- Potential & niche segments and regions exhibiting promising growth covered
- Historical, current, and projected market size, in terms of value
- In-depth analysis of the Lightning Protection Products Market
- Overview of the regional outlook of the Lightning Protection Products Market:
Key Reasons to Buy this Report:
- Access to date statistics compiled by our researchers. These provide you with historical and forecast data, which is analyzed to tell you why your market is set to change
- This enables you to anticipate market changes to remain ahead of your competitors
- You will be able to copy data from the Excel spreadsheet straight into your marketing plans, business presentations, or other strategic documents
- The concise analysis, clear graph, and table format will enable you to pinpoint the information you require quickly
- Provision of market value data for each segment and sub-segment
- Indicates the region and segment that is expected to witness the fastest growth as well as to dominate the market
- Analysis by geography highlighting the consumption of the product/service in the region as well as indicating the factors that are affecting the market within each region
- Competitive landscape which incorporates the market ranking of the major players, along with new service/product launches, partnerships, business expansions, and acquisitions in the past five years of companies profiled
- Extensive company profiles comprising of company overview, company insights, product benchmarking, and SWOT analysis for the major market players
- The current as well as the future market outlook of the industry concerning recent developments which involve growth opportunities and drivers as well as challenges and restraints of both emerging as well as developed regions
- Includes in-depth analysis of the market from various perspectives through Porters five forces analysis
- Provides insight into the market through Value Chain
- Market dynamics scenario, along with growth opportunities of the market in the years to come
- 6-month post-sales analyst support
Click Here to Download Your Free Sample Report
Customization of the Report
In case of any queries or customization requirements, please connect with our sales team, who will ensure that your requirements are met.
Drivers:
- Increasing Frequency of Severe Weather Events: As global climate change leads to more frequent and intense weather events, including lightning storms, there is a growing demand for lightning protection products. The increasing threat to buildings, infrastructure, and communication systems from lightning strikes has led to a surge in demand for reliable protection systems.
- Growth in Infrastructure Development: Rapid urbanization and expansion of infrastructure in both developed and developing economies are driving the need for advanced lightning protection systems. Tall buildings, industrial plants, power grids, and communication towers are especially vulnerable to lightning strikes, increasing the adoption of protection products.
- Technological Advancements: The development of more efficient and reliable lightning protection systems, including early-warning systems and improved grounding methods, is making these products more attractive to businesses and homeowners. Advancements in sensor technologies and materials have also contributed to the growing market for lightning protection systems.
- Regulatory Standards and Codes: Many countries have introduced strict regulatory standards and building codes that mandate the installation of lightning protection systems, particularly in high-risk zones. This is further contributing to the market’s growth as businesses and property owners comply with safety regulations.
Restraints:
- High Initial Costs: The installation of comprehensive lightning protection systems involves a high upfront cost. This can deter small businesses and individual property owners from investing in these products, especially in regions where lightning strikes are less frequent.
- Lack of Awareness: In some regions, there is a lack of awareness regarding the risks associated with lightning strikes, leading to lower demand for protection products. Many individuals and businesses may underestimate the potential damage that lightning can cause, resulting in slower adoption rates.
- Complex Installation and Maintenance: Installing a lightning protection system requires expert knowledge and skills, which can increase costs and complicate the installation process. Regular maintenance is also required to ensure the system remains effective over time, adding to the overall cost of ownership.
- Market Fragmentation: The lightning protection products market is fragmented, with a large number of players offering different technologies and solutions. This fragmentation can make it difficult for consumers to choose the right product, creating confusion and reducing overall market efficiency.
Opportunities:
- Rising Demand in Emerging Markets: As urbanization increases in emerging economies, particularly in regions with high lightning activity, there is significant potential for growth in the market for lightning protection products. Countries in Southeast Asia, Africa, and South America are seeing increased construction and infrastructure development, creating opportunities for manufacturers to expand their presence.
- Integration with Smart Technologies: The integration of lightning protection systems with smart technologies such as Internet of Things (IoT) sensors and automated warning systems presents a significant opportunity for market expansion. IoT-enabled systems can monitor lightning risks in real-time, providing early warning signals and enhancing the safety of people and property.
- Growth in Renewable Energy Infrastructure: The growing reliance on renewable energy sources, particularly wind and solar power, requires the installation of robust lightning protection systems. Wind turbines and solar panels are highly susceptible to lightning strikes, creating demand for specialized protection solutions in these industries.
- Increasing Awareness and Education: As awareness about the risks of lightning strikes grows, governments and private organizations are investing in educational programs that highlight the importance of lightning protection. This increased focus on safety and risk management presents an opportunity for market growth.
Challenges:
- Technological and Innovation Risks: While advancements in technology present opportunities, they also pose challenges. The introduction of new technologies may require significant investment in research and development, and companies that fail to innovate may fall behind in the competitive market.
- Environmental Impact: As the construction industry becomes more focused on sustainability, there is growing pressure to develop lightning protection products that are both effective and environmentally friendly. Manufacturers will need to address these concerns by producing eco-friendly materials and ensuring their systems align with green building standards.
- Competitor Pressure: With a large number of manufacturers and suppliers in the lightning protection market, competition is fierce. Smaller companies may struggle to compete with established players, especially when it comes to pricing, technology, and brand recognition.
- Changing Regulatory Landscape: While regulatory standards can drive market growth, changes in these standards can also pose challenges. Companies must stay updated on local, regional, and international regulations, which may evolve over time. Non-compliance can lead to penalties, further complicating the market dynamics.
Interested in related market reports? Click here to explore more!
About Semiconductor Insight:
Established in 2016, Semiconductor Insight specializes in providing comprehensive semiconductor industry research and analysis to support businesses in making well-informed decisions within this dynamic and fast-paced sector. From the beginning, we have been committed to delivering in-depth semiconductor market research, identifying key trends, opportunities, and challenges shaping the global semiconductor industry.
Our expertly developed semiconductor market reports offer actionable intelligence, including detailed semiconductor industry analysis, market forecasts, competitive analysis, and insights into technological advancements, enabling our clients to maintain a competitive edge. With nearly a decade of expertise, we remain at the forefront of innovation, delivering strategic clarity to businesses in the semiconductor sector.
Our commitment to providing insights into semiconductor market share and industry trends ensures that our clients have the information they need to succeed in the ever-evolving semiconductor market.

Get Sample Report PDF for Exclusive Insights
Report Sample Includes
- Table of Contents
- List of Tables & Figures
- Charts, Research Methodology, and more...


