LGA Packaging Market Overview
LGA (Land Grid Array Package) is a BGA packaging technology that further reduces the height without solder balls. LGA has thinner and lighter package outline. It is especially suitable for application that required high electrical performance.
This report provides a deep insight into the global LGA Packaging market covering all its essential aspects. This ranges from a macro overview of the market to micro details of the market size, competitive landscape, development trend, niche market, key market drivers and challenges, SWOT analysis, value chain analysis, etc.
The analysis helps the reader to shape the competition within the industries and strategies for the competitive environment to enhance the potential profit. Furthermore, it provides a simple framework for evaluating and accessing the position of the business organization. The report structure also focuses on the competitive landscape of the Global LGA Packaging Market, this report introduces in detail the market share, market performance, product situation, operation situation, etc. of the main players, which helps the readers in the industry to identify the main competitors and deeply understand the competition pattern of the market.
In a word, this report is a must-read for industry players, investors, researchers, consultants, business strategists, and all those who have any kind of stake or are planning to foray into the LGA Packaging market in any manner.
LGA Packaging Market Analysis:
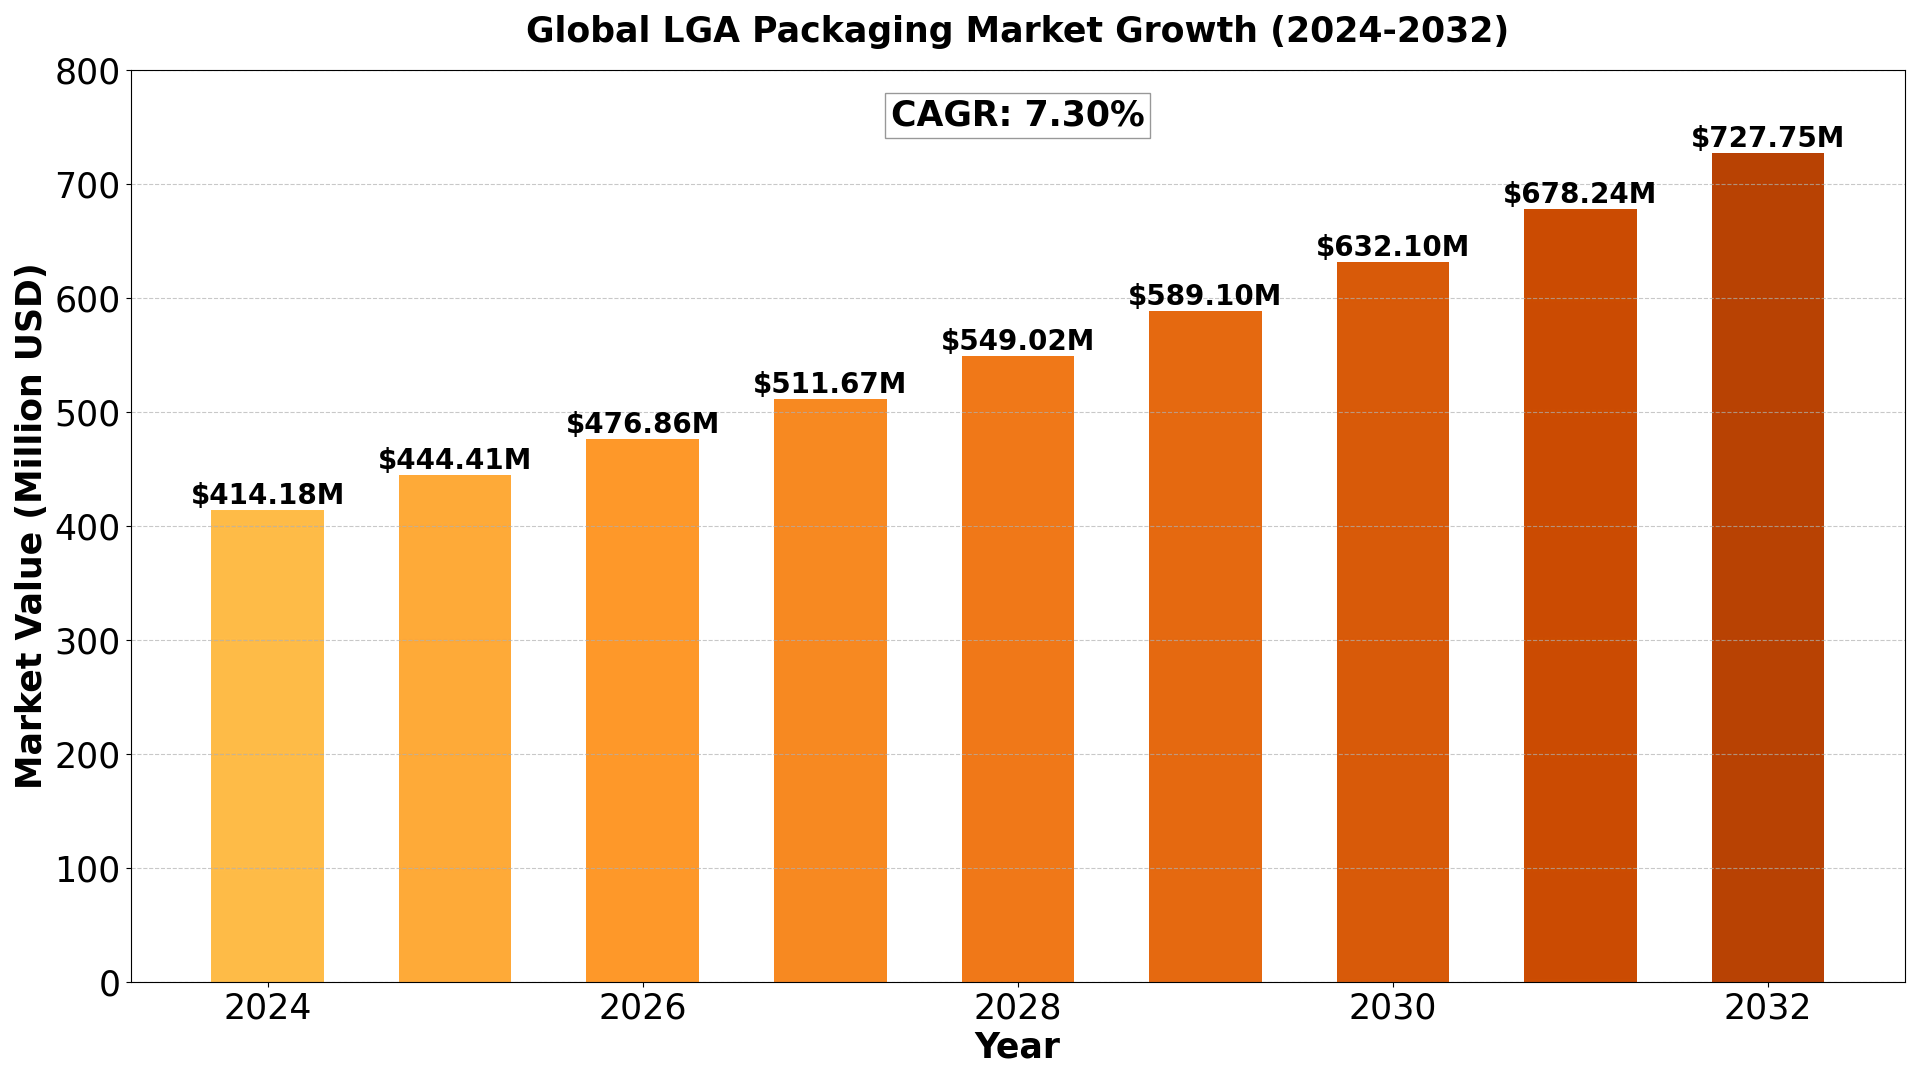
The Global LGA Packaging Market size was estimated at USD 386 million in 2023 and is projected to reach USD 727.75 million by 2032, exhibiting a CAGR of 7.30% during the forecast period.
North America LGA Packaging market size was estimated at USD 113.56 million in 2023, at a CAGR of 6.26% during the forecast period of 2025 through 2032.
LGA Packaging Key Market Trends :
- Increased Demand for Smaller, Lighter Packages: The shift towards reducing size and weight in electronic devices, especially in mobile phones and wearables, is driving the growth of LGA packaging.
- Integration of LGA in EV and 5G Applications: As electric vehicles (EVs) and 5G networks expand, LGA packaging is seeing increased adoption due to its enhanced electrical performance and miniaturization benefits.
- Automation in Manufacturing: The rise in automation and advanced manufacturing technologies are improving the efficiency and scalability of LGA packaging solutions.
- Growing Focus on Sustainable Electronics: With the increasing demand for environmentally friendly products, LGA packaging is favored due to its reduced material usage and more efficient performance.
- Customization for Specific Applications: Companies are focusing on customizing LGA packages to meet the unique requirements of different industries like automotive and aerospace, further driving market growth.
LGA Packaging Market Regional Analysis :

-
North America:
Strong demand driven by EVs, 5G infrastructure, and renewable energy, with the U.S. leading the market.
-
Europe:
Growth fueled by automotive electrification, renewable energy, and strong regulatory support, with Germany as a key player.
-
Asia-Pacific:
Dominates the market due to large-scale manufacturing in China and Japan, with growing demand from EVs, 5G, and semiconductors.
-
South America:
Emerging market, driven by renewable energy and EV adoption, with Brazil leading growth.
-
Middle East & Africa:
Gradual growth, mainly due to investments in renewable energy and EV infrastructure, with Saudi Arabia and UAE as key contributors.
LGA Packaging Market Segmentation :
The research report includes specific segments by region (country), manufacturers, Type, and Application. Market segmentation creates subsets of a market based on product type, end-user or application, Geographic, and other factors. By understanding the market segments, the decision-maker can leverage this targeting in the product, sales, and marketing strategies. Market segments can power your product development cycles by informing how you create product offerings for different segments.
Key Company
- Orient Semiconductor Electronics
- NXP
- Maxim Integrated
- Thales Group
- Analog Devices
- ASE Holdings
- GS Nanotech
- Amkor
Market Segmentation (by Type)
- Hot Air Soldering
- Infrared Soldering
Market Segmentation (by Application)
- Consumer Electronics
- Automotive
- Optoelectronic Components
- Others
Drivers
- Growing Demand for Miniaturization in Electronics
- The demand for compact and lightweight electronic devices is driving the adoption of LGA (Land Grid Array) packaging. Its small form factor makes it suitable for high-density circuit designs, catering to modern consumer electronics and IoT devices.
- Enhanced Performance and Thermal Efficiency
- LGA packaging offers improved electrical performance and better thermal dissipation compared to older packaging technologies. These features make it an attractive choice for high-performance computing applications, including data centers and cloud computing.
- Adoption in Advanced Communication Devices
- With the rise of 5G and other advanced communication technologies, LGA packaging has become a preferred solution for RF modules and chipsets, which require high-speed and low-latency interconnections.
- Robust Automotive Electronics Market
- The integration of sophisticated electronic systems in automotive applications, such as ADAS (Advanced Driver Assistance Systems) and infotainment, is boosting demand for durable and reliable packaging solutions like LGA.
- Support from Semiconductor Advancements
- Continuous advancements in semiconductor manufacturing, such as smaller node sizes and increased transistor density, have enabled LGA packaging to meet the industry’s stringent performance and size requirements.
Restraints
- High Initial Investment Costs
- Setting up manufacturing facilities for LGA packaging requires significant capital investment, which can deter new market entrants and impact the scalability of smaller players.
- Complex Assembly and Testing Requirements
- The precise alignment needed for LGA packaging during assembly increases production complexity and costs. Testing procedures are also more intricate, which may affect time-to-market for products.
- Material and Supply Chain Constraints
- Dependence on high-purity raw materials, coupled with potential disruptions in the semiconductor supply chain, can limit production capacities and impact profitability.
Opportunities
- Expansion of IoT and Edge Computing Applications
- The proliferation of IoT devices and edge computing applications is creating new opportunities for LGA packaging, as these solutions require compact, reliable, and high-performance components.
- Emergence of Advanced Technologies like AI and ML
- Technologies such as artificial intelligence (AI) and machine learning (ML) demand efficient processing units. LGA packaging can support these requirements, presenting lucrative growth prospects.
- Rising Demand in Emerging Markets
- Developing economies are witnessing increased adoption of consumer electronics and communication devices, providing untapped growth potential for LGA packaging manufacturers.
- Development of Sustainable Packaging Solutions
- The industry’s shift towards eco-friendly and recyclable materials in semiconductor packaging could position LGA as a sustainable alternative, enhancing its appeal in environmentally conscious markets.
Challenges
- Competition from Alternative Packaging Technologies
- LGA packaging faces competition from other advanced packaging solutions, such as BGA (Ball Grid Array) and flip-chip technologies, which might be preferred depending on application-specific requirements.
- Technological Obsolescence Risk
- Rapid advancements in semiconductor and packaging technologies could lead to the obsolescence of existing LGA designs, requiring continuous innovation and R&D investment.
- Reliability in Harsh Environments
- While LGA packaging offers performance benefits, ensuring reliability under extreme environmental conditions, such as in aerospace or industrial applications, remains a challenge.
- Skilled Workforce Shortage
- The increasing complexity of semiconductor packaging demands a highly skilled workforce for design, assembly, and testing. A shortage of trained professionals could hinder production efficiency.
Key Benefits of This Market Research:
- Industry drivers, restraints, and opportunities covered in the study
- Neutral perspective on the market performance
- Recent industry trends and developments
- Competitive landscape & strategies of key players
- Potential & niche segments and regions exhibiting promising growth covered
- Historical, current, and projected market size, in terms of value
- In-depth analysis of the LGA Packaging Market
- Overview of the regional outlook of the LGA Packaging Market:
Key Reasons to Buy this Report:
- Access to date statistics compiled by our researchers. These provide you with historical and forecast data, which is analyzed to tell you why your market is set to change
- This enables you to anticipate market changes to remain ahead of your competitors
- You will be able to copy data from the Excel spreadsheet straight into your marketing plans, business presentations, or other strategic documents
- The concise analysis, clear graph, and table format will enable you to pinpoint the information you require quickly
- Provision of market value data for each segment and sub-segment
- Indicates the region and segment that is expected to witness the fastest growth as well as to dominate the market
- Includes in-depth analysis of the market from various perspectives through Porters five forces analysis
- Provides insight into the market through Value Chain
- Market dynamics scenario, along with growth opportunities of the market in the years to come
- 6-month post-sales analyst support
Customization of the Report
In case of any queries or customization requirements, please connect with our sales team, who will ensure that your requirements are met.
FAQs
Q: What are the key driving factors and opportunities in the LGA packaging market?
A: The key driving factors include rising demand for high-performance electronics, increased adoption of electric vehicles (EVs), and rapid advancements in 5G infrastructure. Opportunities lie in expanding into emerging markets, collaborating for technological advancements, and customizing LGA solutions for niche industries like automotive and aerospace.
Q: Which region is projected to have the largest market share in the LGA packaging market?
A: North America is projected to have the largest market share in the LGA packaging market, driven by strong demand from industries like automotive, telecommunications, and renewable energy.
Q: Who are the top players in the global LGA packaging market?
A: The key players in the global LGA packaging market include Orient Semiconductor Electronics, NXP, Maxim Integrated, Thales Group, and Analog Devices.
Q: What are the latest technological advancements in the LGA packaging industry?
A: Recent advancements in LGA packaging include improvements in miniaturization, higher integration levels, better thermal management solutions, and the adoption of automation technologies in manufacturing processes.
Q: What is the current size of the global LGA packaging market?
A: The global LGA packaging market was valued at USD 386 million in 2023 and is projected to reach USD 727.75 million by 2032, growing at a CAGR of 7.30% during the forecast period.
Get Sample Report PDF for Exclusive Insights
Report Sample Includes
- Table of Contents
- List of Tables & Figures
- Charts, Research Methodology, and more...


