SEMICONDUCTOR INSIGHT
MARKET RESEARCH REPORT

Global Hard Disk Drives (HDDs) Market

2026 to 2034
MARKET INTELLIGENCE
ACROSS KEY REGIONS
2026 EDITION
ELECTRONIC COMPONENTS Semiconductor Market Research

Global Hard Disk Drives (HDDs) Market

Research Report 2026-2034

◷
UPDATED 15 September 2026
▤
REPORT LENGTH Detailed Report
▣
REPORT CODE ebcb682dfa9b
▯
FORMATS PDF

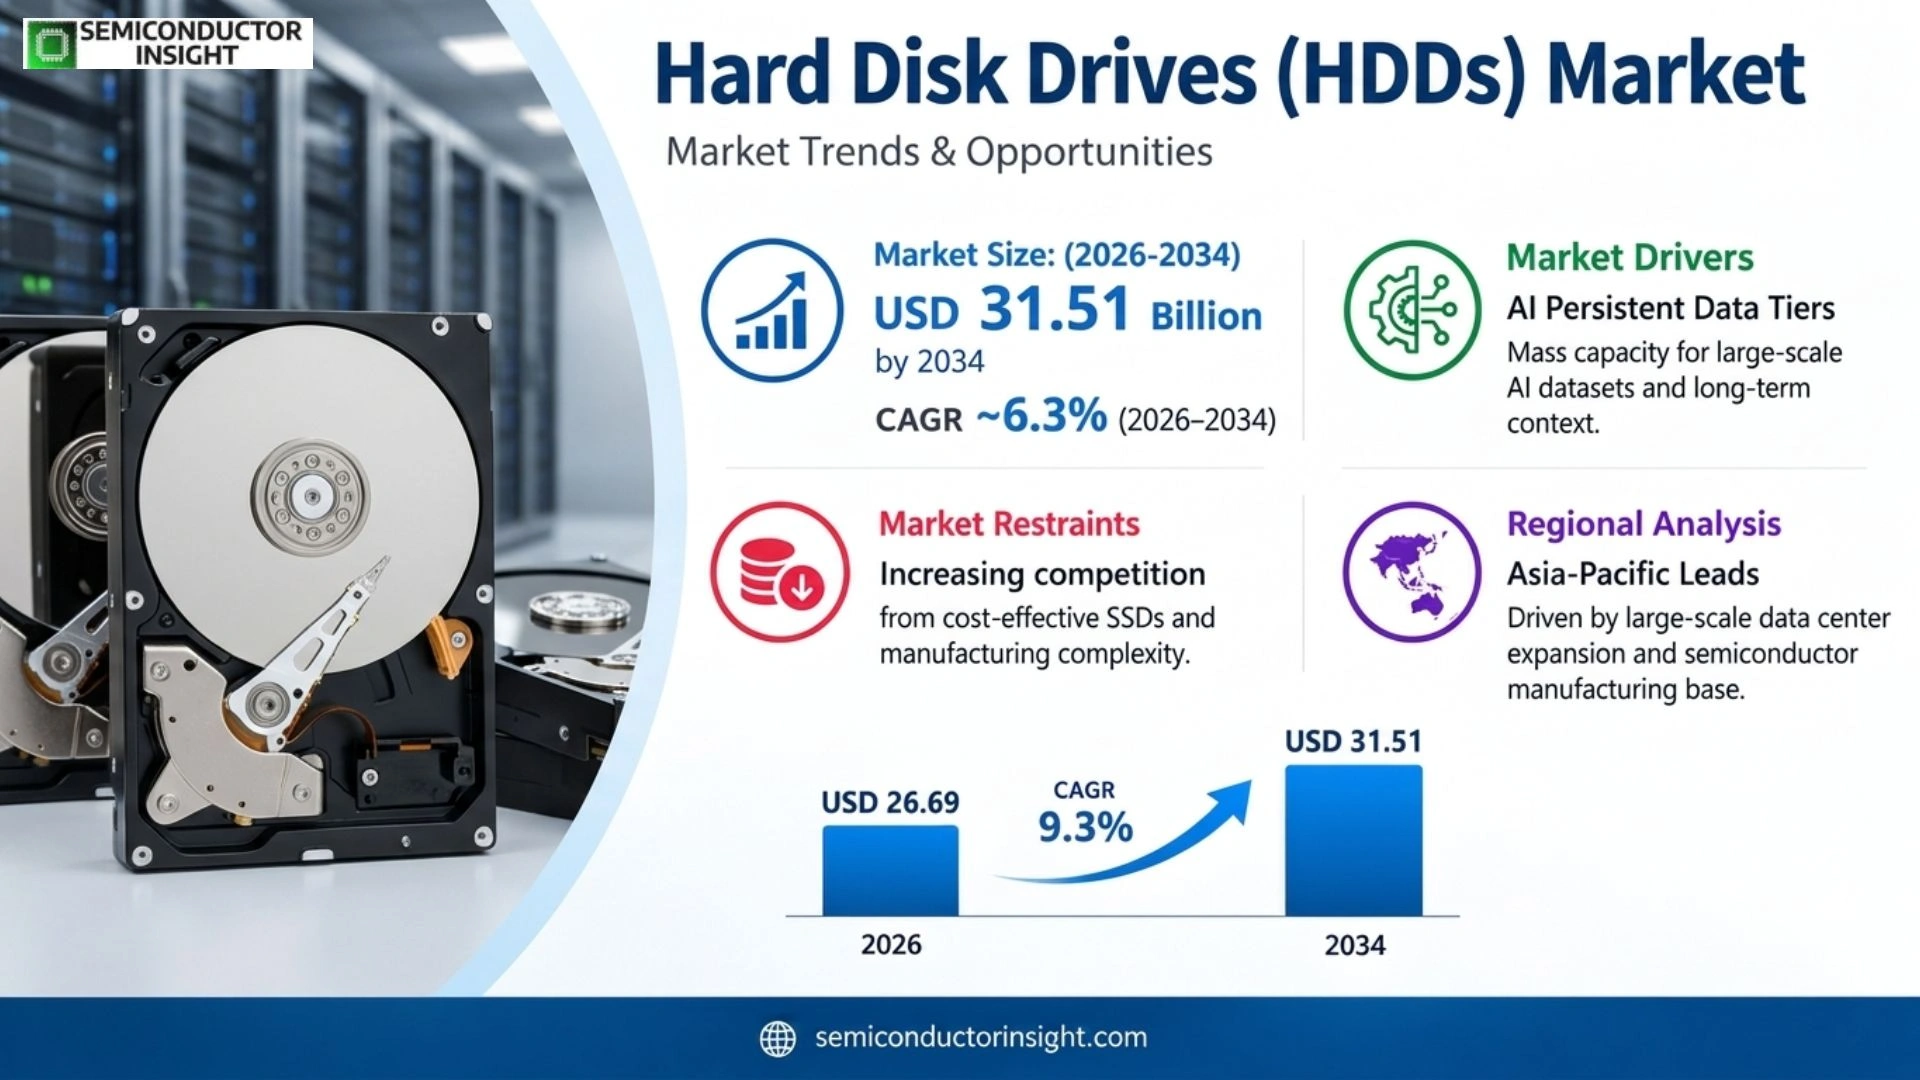
Hard Disk Drives (HDDs) market is rebased to USD 26.14 billion in 2025, increases to an estimated USD 26.69 billion in 2026, and is projected to reach USD 31.51 billion by 2034. The selected source-page size anchors imply a 2.1% CAGR during 2026–2034. North America is the largest end-demand market in 2025 based on the source page FAQ, while Asia Pacific remains the principal manufacturing cluster, while current demand is being reshaped by AI-scale data retention, hyperscale cloud growth, higher areal density through HAMR and ePMR, UltraSMR adoption, lower watts per terabyte and the migration of HDD demand away from client PCs toward nearline enterprise capacity.

Get the sample PDF with study scope, segmentation and methodology details.

Key Statistics

2025 Market Size
USD 26.14 billion
2034 Projected Market Size
USD 31.51 billion
CAGR (2026–2034)
2.1%
Largest Market in 2025
North America

Key Takeaways

  • Internal Hard Drives remain the leading type because hyperscale, cloud and enterprise systems buy high-capacity 3.5-inch nearline drives directly into storage arrays, while external HDDs serve smaller consumer and SMB backup markets.
  • Business Use is the largest and most strategically important application because hyperscale cloud, AI infrastructure, surveillance and enterprise archiving consume much higher capacity per deployment than personal storage. Western Digital shipped 231 exabytes in fiscal Q4 2026, including 209 exabytes of nearline capacity.
  • North America is used as the largest end-demand market because the source page FAQ explicitly says the region leads on data-center and enterprise storage demand; a separate page paragraph says Asia Pacific dominates due manufacturing, so that conflict is disclosed and the two roles are separated analytically.
  • HAMR and UltraSMR are extending HDD economics. Seagate’s Mozaic 4+ is qualified at up to 44 TB with two hyperscalers, Western Digital has a 40 TB UltraSMR ePMR drive in qualification and Toshiba is sampling 30–34 TB SMR nearline drives.
  • HDD relevance is becoming more concentrated rather than disappearing. Client PCs continue migrating to SSDs, but cloud and AI data growth increase demand for inexpensive persistent mass capacity, pushing the market toward fewer but much higher-capacity enterprise drives.

Hard Disk Drives (HDDs) Market Overview

Hard Disk Drives (HDDs) market is rebased to USD 26.14 billion in 2025, increases to an estimated USD 26.69 billion in 2026, and is projected to reach USD 31.51 billion by 2034. The selected source-page size anchors imply a 2.1% CAGR during 2026–2034. North America is the largest end-demand market in 2025 based on the source page FAQ, while Asia Pacific remains the principal manufacturing cluster, while current demand is being reshaped by AI-scale data retention, hyperscale cloud growth, higher areal density through HAMR and ePMR, UltraSMR adoption, lower watts per terabyte and the migration of HDD demand away from client PCs toward nearline enterprise capacity.

Base year: 2025 · Estimated year: 2026 · Forecast period: 2026–2034 · Values in USD million unless stated otherwise

Hard disk drives store data magnetically on rotating platters and remain the lowest-cost mainstream technology for very large persistent storage. Their economic role has changed substantially: consumer notebook and performance-sensitive PC workloads have shifted toward SSDs, while cloud, hyperscale, backup, surveillance and archival systems continue to deploy HDDs because capacity per dollar and capacity per rack remain decisive at exabyte scale. The market therefore increasingly tracks exabytes shipped rather than unit shipments alone.

Current supplier results confirm that the market is being pulled by cloud capacity rather than client computing. Western Digital reported fiscal Q4 2026 revenue of USD 3.75 billion and a business-metric presentation showing 231 exabytes shipped, of which 209 exabytes were nearline. Seagate reported fiscal 2026 revenue of USD 12.2 billion, up 34% from fiscal 2025, and explicitly attributed momentum to robust cloud data-center demand. These operating results support a structurally stronger enterprise mix even though total HDD unit demand remains mature.

Technology competition now centers on areal density, performance per watt and smooth customer qualification. Seagate’s second-generation Mozaic 4+ HAMR platform supports drives up to 44 TB and a roadmap toward 100 TB, while Western Digital is qualifying 40 TB UltraSMR ePMR products and continuing HAMR development. Toshiba is sampling 30–34 TB SMR nearline drives. Higher capacity reduces the number of drives, racks, power supplies and maintenance events required for a fixed amount of storage, improving hyperscale total cost of ownership.

Segment Analysis: By Type

The source page segments the market into External Hard Drives and Internal Hard Drives. Internal HDDs are the value-leading segment because they include nearline enterprise, surveillance and desktop-class drives installed directly in systems and arrays. External drives remain relevant for personal backup and small-business use but compete more directly with portable SSDs and cloud backup services.

Type Technical / commercial role Market position
Internal Hard Drives Internal HDDs are installed inside servers, storage enclosures, surveillance recorders and desktop systems. The most important commercial subsegment is 3.5-inch nearline enterprise storage, where capacity, annualized failure rate, vibration tolerance, power efficiency and firmware behavior are qualified against large-scale arrays. Higher-capacity drives reduce rack count and infrastructure cost, so customers pay for terabytes per slot rather than spindle performance alone. Leading value segment. Nearline exabytes dominate current vendor metrics, with Western Digital reporting 209 EB of nearline shipments in fiscal Q4 2026. Seagate and Toshiba are also concentrating product roadmaps on 30 TB-plus hyperscale drives, indicating that internal enterprise HDDs now define most industry innovation and margin.
External Hard Drives External HDDs combine one or more standard drives with USB, power and enclosure electronics for consumer, creator and small-business backup. They remain attractive when buyers need several terabytes at low acquisition cost and do not require SSD-level performance. However, portable SSD price declines, cloud backup and thinner laptops reduce the role of external HDDs in performance-sensitive personal workflows. Stable-to-declining unit segment but persistent capacity niche. Demand is supported by photographers, video creators, gaming libraries, offline backup and low-cost local archives. Suppliers compete through capacity, bundled software, rugged enclosures and retail distribution rather than recording technology alone, because most external products use established internal-drive platforms.

Technology Architecture Analysis

Although the source page does not provide a formal recording-technology segmentation, current HDD competition is defined by CMR/ePMR, UltraSMR/SMR and HAMR. These architectures determine areal density, host compatibility, write behavior and total cost of ownership, making them essential to a reliable market analysis. For HDD suppliers, the commercial consequence is that qualified exabytes, areal density, watts per terabyte and hyperscale allocation determine revenue quality more directly than legacy client-drive unit volumes.

Recording architecture Commercial implication
CMR / ePMR Conventional magnetic recording remains the compatibility baseline for enterprise and general-purpose workloads, while energy-assisted ePMR extends areal density without requiring a full transition to HAMR. Western Digital’s roadmap uses ePMR and HAMR in overlapping generations so hyperscalers can adopt higher capacity without changing storage software or qualification practices abruptly.
SMR / UltraSMR Shingled magnetic recording overlaps tracks to increase areal density and is strongest in host-managed or workload-aware hyperscale environments. Western Digital’s 40 TB UltraSMR qualification and Toshiba’s 30–34 TB SMR M12 sampling show that SMR remains commercially important where cloud operators can optimize sequential writes and reclaim operations at system level.
HAMR Heat-assisted magnetic recording briefly heats a tiny area of magnetic media during writes, allowing smaller stable bits and materially higher areal density. Seagate’s Mozaic 4+ is qualified and in production with two hyperscale providers at up to 44 TB, making HAMR the clearest current path to sustained capacity growth beyond conventional perpendicular-recording limits.

Capacity Class Analysis

Commercial HDD demand is increasingly divided by capacity because unit economics differ sharply between client drives and hyperscale nearline products. High-capacity drives above 20 TB capture most technology investment because each additional terabyte improves storage density and reduces infrastructure overhead, while sub-8 TB products remain concentrated in legacy client, NAS and surveillance applications.

Capacity class Demand profile
Below 8 TB Lower-capacity drives serve desktop replacement, small NAS, DVR and entry backup applications. They face the strongest substitution from SSDs because the absolute price gap is smaller and users value lower latency, silence and shock resistance. Product lifecycles are long, but strategic supplier investment is limited.
8–20 TB Mid-capacity HDDs serve NAS, surveillance and general enterprise storage where compatibility and drive count still matter. This class benefits from established CMR designs and broad channel availability, although cloud buyers increasingly move beyond 20 TB to reduce rack-level cost.
Above 20 TB High-capacity nearline drives are the core growth segment. Seagate supports up to 44 TB HAMR, Western Digital has a 40 TB UltraSMR drive in qualification and Toshiba is sampling 34 TB SMR. These products are designed around hyperscale total cost of ownership, not retail unit price.

Segment Analysis: By Application

By application, the source page segments demand into Personal Use and Business Use. Business use is the larger value pool because cloud, hyperscale, surveillance, backup and enterprise archives consume far more installed capacity per deployment than individual consumers. Personal demand persists mainly where low-cost multi-terabyte local storage is more important than SSD performance.

Application Demand characteristics
Business Use Business HDD demand is concentrated in hyperscale cloud, enterprise storage, surveillance, backup and cold/warm data tiers. AI increases both newly created and retained data, raising the value of low-cost persistent capacity. High-capacity drives allow operators to increase petabytes per rack without proportional increases in floor space, power and maintenance, so business demand increasingly rewards areal density and watts per terabyte.
Personal Use Personal HDDs are used for desktop storage, game libraries, photos, video archives and offline backup. The segment has lost share to SSDs in notebooks and primary PC storage because flash offers much lower latency and better shock resistance. HDDs remain relevant where users need several terabytes at low cost and access patterns are sequential or archival rather than latency-sensitive.

Business Storage Workload Analysis

The broad business-use category contains several commercially distinct workloads. Hyperscale nearline, surveillance, backup/archive and NAS/enterprise differ in write patterns, performance requirements and qualification cycles, which affects whether CMR, SMR or HAMR-based products are appropriate. This distinction matters because modern cloud buyers evaluate storage at rack and fleet level, so drive capacity, firmware behavior, reliability and infrastructure efficiency are more important than standalone spindle specifications.

Workload HDD demand mechanism
Hyperscale Nearline Cloud providers operate exabyte-scale fleets where cost per terabyte, rack density and fleet reliability dominate. Host-managed SMR and HAMR are viable because hyperscalers can optimize software around drive behavior. Vendor qualification is lengthy, but once approved, each platform can generate very large exabyte shipments.
Surveillance Video surveillance produces continuous sequential writes and long retention periods, favoring HDDs over SSDs on cost. Drives are optimized for multi-camera workloads, vibration and 24/7 operation. Capacity growth follows camera resolution, frame rate and retention mandates rather than general PC shipments.
Backup & Archive Enterprises retain backups, compliance data and historical datasets that are accessed infrequently but must remain online or nearline. HDDs offer lower cost and easier random access than tape for many workloads, while energy-optimized drives can create a middle tier between always-on performance storage and deep archive.
NAS & Enterprise Small business and departmental NAS use CMR drives where predictable random-write behavior and broad compatibility matter more than maximum areal density. Enterprise arrays increasingly use high-capacity nearline drives with sophisticated firmware, vibration controls and error recovery.

Global Hard Disk Drives (HDDs) Market Size

Regional Analysis

The source page contains a regional contradiction: its narrative says Asia Pacific dominates because of manufacturing in China and Japan, while the FAQ says North America is expected to lead because of strong data-center and enterprise storage demand. This analysis separates the two roles by treating North America as the largest end-demand market and Asia Pacific as the dominant manufacturing cluster.

How do cloud demand and manufacturing geography create different regional HDD roles?

North America hosts the largest concentration of hyperscale cloud operators and enterprise buyers, giving it disproportionate demand influence. Asia Pacific contains much of the HDD manufacturing and component ecosystem and also has substantial cloud and surveillance demand. Europe is a mature enterprise and regulatory storage market, while South America and Middle East & Africa are smaller import-led regions where cloud, surveillance and data sovereignty create selective growth.

Region Position Growth outlook Demand profile What decides supplier selection
North America Largest end-demand market Moderate to high Hyperscale, enterprise and AI-led Qualification, TCO, watts/TB and long-term allocation
Asia Pacific Largest manufacturing cluster Moderate to high Manufacturing, cloud and surveillance-led Scale, component ecosystem and supply continuity
Europe Mature Moderate Enterprise, cloud and compliance storage-led Energy efficiency, reliability and data governance
South America Smaller Moderate Cloud, surveillance and backup-led Landed cost, channel availability and capacity
Middle East & Africa Emerging Moderate Data-center, government and surveillance-led Imported supply, service and high-capacity economics
North America LARGEST END-DEMAND MARKET

Why does North America lead HDD demand?

The source page FAQ identifies North America as the leading market because the region hosts major hyperscale cloud and enterprise storage customers. Western Digital and Seagate also serve these customers directly, and 2026 vendor results show strong nearline exabyte growth linked to AI-driven data retention rather than personal-computer demand. Buyers therefore compare total cost per retained terabyte, qualification risk, power demand and long-term roadmap continuity before adopting a new recording architecture across large storage fleets.

Market positionLargest end-demand market
Growth outlookModerate to high
Demand profileHyperscale and AI-led
Market access gateTCO, qualification and allocation
Country / subregion Position Demand mechanism
United States Primary hyperscale market U.S. cloud providers purchase nearline HDDs in very large exabyte volumes and can qualify advanced SMR, ePMR and HAMR platforms. Their software-defined storage architectures allow vendors to optimize products around fleet-level cost rather than standalone drive benchmarks.
Canada Cloud and enterprise demand Canadian data-center, backup and public-sector workloads create steady demand for high-capacity storage. The market follows global enterprise product cycles, with energy efficiency and data residency increasing the value of dense local capacity.
Mexico Electronics and regional distribution link Mexico is more important to downstream system manufacturing and logistics than to hyperscale demand. HDD availability is tied to North American OEM and distributor supply chains, with business storage and surveillance providing the main direct demand.

Market instances

  • Western Digital’s fiscal Q4 2026 earnings deck reported 231 exabytes shipped in the quarter, including 209 exabytes of nearline capacity. The metric demonstrates that enterprise and cloud capacity, not client units, is now the key operating measure for a leading HDD supplier and supports North America’s role as a hyperscale demand center.
  • Western Digital announced in February 2026 that a 40 TB UltraSMR ePMR HDD was in customer qualification and outlined HAMR scaling toward 100 TB-plus. Hyperscale customers can therefore choose overlapping technology paths rather than accept a disruptive one-time transition, reducing qualification risk while increasing rack density. For HDD vendors, the development matters because it changes a measurable capacity, qualification, security or hyperscale deployment condition and therefore influences exabyte demand, fleet economics or supplier allocation.
  • In May 2026 Western Digital announced post-quantum-cryptography-ready secure boot and firmware protection for new high-capacity Ultrastar UltraSMR drives under hyperscale qualification. Security is therefore becoming an additional enterprise qualification factor alongside capacity, power, reliability and performance. For HDD vendors, the development matters because it changes a measurable capacity, qualification, security or hyperscale deployment condition and therefore influences exabyte demand, fleet economics or supplier allocation.

North America’s market strength comes from end demand and architecture influence, not local dominance of drive manufacturing. Hyperscalers determine product qualification, interface behavior and fleet economics that suppliers then scale through global manufacturing. Through 2034, suppliers that raise areal density while preserving enterprise reliability can keep HDD economics attractive for AI, cloud, surveillance and archive workloads even as SSDs dominate latency-sensitive applications.

Asia Pacific MANUFACTURING & CLOUD CLUSTER

Why is Asia Pacific central to HDD supply?

Asia Pacific contains the industry’s deepest manufacturing and component base and also has large cloud, surveillance and electronics markets. The source page calls the region dominant because of manufacturing in China and Japan, while current products from Toshiba and the global supply chains of Seagate and Western Digital reinforce its production importance.

Market positionLargest manufacturing cluster
Growth outlookModerate to high
Demand profileManufacturing and cloud-led
Market access gateScale, component supply and yield
Country / subregion Position Demand mechanism
Japan Technology and supplier base Toshiba remains one of the three major current HDD manufacturers and is sampling 30–34 TB SMR nearline products in 2026. Japan also contributes precision components and storage engineering expertise across the broader HDD supply chain.
China Large cloud and surveillance demand China combines hyperscale cloud, surveillance, video and enterprise storage demand with extensive electronics manufacturing. HDDs remain attractive for large video archives and low-cost cloud storage even as client devices migrate toward SSDs.
Southeast Asia Manufacturing ecosystem The region hosts substantial precision electronics and storage manufacturing infrastructure. Production economics depend on mature supplier networks for heads, media, motors, mechanical parts and final assembly, making geographic ecosystem depth difficult to replicate quickly.

Market instances

  • Toshiba began sampling its M12 nearline family in March 2026 with 30–34 TB SMR capacities and plans up to 28 TB CMR versions. The product targets hyperscale and cloud providers and shows that capacity competition remains active across all three major HDD manufacturers rather than being limited to Seagate and Western Digital.
  • Seagate’s Mozaic 4+ platform is produced at scale and qualified with two leading hyperscalers at up to 44 TB. Although customer demand is global, the commercial viability of HAMR depends on high-volume manufacturing of precision heads, media and photonic components within a tightly controlled supply network. For HDD vendors, the development matters because it changes a measurable capacity, qualification, security or hyperscale deployment condition and therefore influences exabyte demand, fleet economics or supplier allocation.
  • The source page’s Asia-Pacific dominance statement is better interpreted as manufacturing leadership than undisputed end-market leadership. China and Japan are important, but the highest-value product roadmaps are increasingly pulled by global hyperscale customers whose demand may be booked in North America. For HDD vendors, the development matters because it changes a measurable capacity, qualification, security or hyperscale deployment condition and therefore influences exabyte demand, fleet economics or supplier allocation.

Asia Pacific is indispensable because HDD manufacturing is an ecosystem business. High-precision media, heads, motors, enclosures and assembly must scale together, so supply continuity and yield can matter more than the location of final customers. The market implication is that an announced capacity becomes commercially meaningful only after production yield and hyperscale qualification are stable enough to support sustained exabyte shipments.

Europe ENTERPRISE & COMPLIANCE STORAGE

What supports HDD demand in Europe?

Europe is a mature storage market where cloud, media archives, research, surveillance and regulated enterprise workloads require large persistent capacity. Energy efficiency and data-governance requirements make high-capacity HDDs attractive in storage tiers where SSD performance would add cost without changing the workload outcome. For HDD suppliers, the commercial consequence is that qualified exabytes, areal density, watts per terabyte and hyperscale allocation determine revenue quality more directly than legacy client-drive unit volumes.

Market positionMature
Growth outlookModerate
Demand profileEnterprise and cloud-led
Market access gateEnergy efficiency and reliability
Country / subregion Position Demand mechanism
Germany Enterprise and industrial storage hub Manufacturing, research and enterprise IT create large backup and archive requirements. Data-center operators evaluate drive power and rack density carefully because energy cost and infrastructure efficiency materially affect lifecycle economics.
United Kingdom Cloud, media and financial demand The UK hosts cloud, financial and media workloads with significant archive requirements. HDDs remain relevant for object storage, backup and video where high capacity is more important than flash latency.
Nordics & France Data-center and scientific storage Low-carbon power, research computing and cloud facilities support high-capacity storage deployment. Suppliers can differentiate through watts per terabyte, predictable availability and long-life enterprise firmware.

Market instances

  • Seagate states that its 44 TB Mozaic 4+ improves capacity per rack and watts per terabyte while preserving standard drive form factors. These economics are directly relevant to European data centers where electricity and space efficiency are important operating constraints. For HDD vendors, the development matters because it changes a measurable capacity, qualification, security or hyperscale deployment condition and therefore influences exabyte demand, fleet economics or supplier allocation.
  • Enterprise backup and archival workloads often retain data for regulatory, research or business-continuity reasons even when access frequency is low. HDDs remain competitive because they provide online accessibility at materially lower capacity cost than all-flash storage. For HDD vendors, the development matters because it changes a measurable capacity, qualification, security or hyperscale deployment condition and therefore influences exabyte demand, fleet economics or supplier allocation.
  • European customers increasingly evaluate sustainability at infrastructure level. Higher-capacity drives can reduce the number of devices, enclosures and power supplies needed for a fixed petabyte target, creating an efficiency advantage even when individual drive power rises slightly. For HDD vendors, the development matters because it changes a measurable capacity, qualification, security or hyperscale deployment condition and therefore influences exabyte demand, fleet economics or supplier allocation.

Europe is not a manufacturing center for HDDs, but it is a high-value demand region where power, reliability and compliance can justify rapid adoption of higher-capacity enterprise drives. This distinction matters because modern cloud buyers evaluate storage at rack and fleet level, so drive capacity, firmware behavior, reliability and infrastructure efficiency are more important than standalone spindle specifications.

South America CLOUD & SURVEILLANCE GROWTH

Where is HDD demand strongest in South America?

South American demand is concentrated in cloud expansion, surveillance, backup and enterprise IT, with Brazil the largest market. The region is import dependent, so currency, channel inventory and shipping lead times influence product mix. High-capacity HDDs remain attractive where buyers need local multi-terabyte storage at lower cost than flash. Buyers therefore compare total cost per retained terabyte, qualification risk, power demand and long-term roadmap continuity before adopting a new recording architecture across large storage fleets.

Market positionSmaller
Growth outlookModerate
Demand profileCloud, surveillance and backup-led
Market access gatePrice, distribution and capacity
Country / subregion Position Demand mechanism
Brazil Largest regional market Brazil’s data centers, video surveillance and enterprise systems create the region’s largest HDD demand pool. Imported high-capacity drives are used for cloud and backup, while consumer HDDs remain sensitive to currency and retail pricing.
Chile Data-center and enterprise niche Cloud facilities and mining/industrial systems create steady storage demand. Local operators prioritize reliable enterprise platforms and predictable distributor supply because replacement lead times can be long.
Argentina & Rest of Region Price-sensitive market Enterprise backup and surveillance sustain demand, but macroeconomic volatility can lengthen upgrade cycles. Buyers may favor mature capacities when the premium for the latest enterprise density is difficult to justify.

Market instances

  • Video surveillance is a particularly durable HDD workload because cameras generate continuous sequential data and retention requirements often extend for weeks or months. High-resolution streams increase storage faster than camera unit growth, supporting larger-capacity drives in security systems. For HDD vendors, the development matters because it changes a measurable capacity, qualification, security or hyperscale deployment condition and therefore influences exabyte demand, fleet economics or supplier allocation.
  • Regional cloud providers can adopt the same nearline drives qualified globally by hyperscalers, giving South American customers access to advanced density without local drive manufacturing. However, imported supply means lead time and currency remain more important than in U.S. hyperscale procurement. For HDD vendors, the development matters because it changes a measurable capacity, qualification, security or hyperscale deployment condition and therefore influences exabyte demand, fleet economics or supplier allocation.
  • External and desktop HDDs retain a consumer niche because several terabytes of local capacity remain cheaper than equivalent SSDs. That demand is increasingly secondary to business storage, but it prevents the market from becoming exclusively hyperscale. For HDD vendors, the development matters because it changes a measurable capacity, qualification, security or hyperscale deployment condition and therefore influences exabyte demand, fleet economics or supplier allocation.

South America is primarily a downstream market. The strongest growth opportunity is high-capacity business storage, while consumer unit demand remains vulnerable to SSD substitution and local purchasing-power cycles. Through 2034, suppliers that raise areal density while preserving enterprise reliability can keep HDD economics attractive for AI, cloud, surveillance and archive workloads even as SSDs dominate latency-sensitive applications.

Middle East & Africa DATA-CENTER & GOVERNMENT GROWTH

Why is MEA becoming more relevant for high-capacity HDDs?

Gulf data-center expansion, government digitalization, telecom networks and video surveillance are increasing persistent storage requirements, while African enterprise and telecom markets also need economical backup capacity. HDDs benefit because most workloads are capacity intensive and do not require all-flash latency. The market implication is that an announced capacity becomes commercially meaningful only after production yield and hyperscale qualification are stable enough to support sustained exabyte shipments.

Market positionEmerging
Growth outlookModerate
Demand profileData-center and surveillance-led
Market access gateImported supply, service and TCO
Country / subregion Position Demand mechanism
GCC AI and cloud infrastructure market New AI and sovereign-cloud projects create large datasets that must be retained beyond accelerator memory. High-capacity nearline HDDs can form the object-storage and archive tiers beneath expensive flash systems.
South Africa Enterprise and telecom hub Banks, telecom operators and data centers use HDDs for backup, video and capacity storage. Distributor support and replacement availability matter because local manufacturing is absent.
Rest of Africa Surveillance and enterprise growth Telecom, public-sector digitalization and security systems create demand for rugged, affordable storage. Capacity per dollar is often more important than the latest recording technology.

Market instances

  • AI infrastructure in Gulf markets creates a large secondary storage requirement because training data, checkpoints, logs and generated outputs must be retained economically after computation. HDDs can therefore grow alongside flash rather than compete with it directly. For HDD vendors, the development matters because it changes a measurable capacity, qualification, security or hyperscale deployment condition and therefore influences exabyte demand, fleet economics or supplier allocation.
  • Government and commercial surveillance systems generate continuous video streams that are well suited to high-capacity HDDs. As camera resolution increases, storage demand can grow faster than the number of cameras, supporting sustained capacity upgrades. For HDD vendors, the development matters because it changes a measurable capacity, qualification, security or hyperscale deployment condition and therefore influences exabyte demand, fleet economics or supplier allocation.
  • Import dependence makes supply planning important. Regional integrators often qualify a limited number of enterprise drive families, so continuity, warranty support and predictable availability can outweigh small price differences between brands. For HDD vendors, the development matters because it changes a measurable capacity, qualification, security or hyperscale deployment condition and therefore influences exabyte demand, fleet economics or supplier allocation.

MEA growth is linked to digital infrastructure rather than PC units. High-capacity HDDs remain well positioned wherever the workload is large, persistent and cost-sensitive. For HDD suppliers, the commercial consequence is that qualified exabytes, areal density, watts per terabyte and hyperscale allocation determine revenue quality more directly than legacy client-drive unit volumes.

Competitive Landscape

The source page company list is materially broader than the current HDD manufacturing industry and includes many SSD or flash-storage brands. For reliable competitive analysis, current hard-drive manufacturing is treated as concentrated among Seagate, Western Digital and Toshiba, while the source-page roster is preserved separately for report-scope transparency instead of being presented as a list of equivalent HDD OEMs.

Seagate is the clearest current HAMR leader, with Mozaic 4+ qualified and in production with two hyperscale customers at up to 44 TB. Its fiscal 2026 revenue increased 34% to USD 12.2 billion and management cited robust cloud data-center demand. The company’s competitive advantage is vertically integrated HAMR technology, including photonic components, combined with a roadmap toward 10 TB per disk and 100 TB drives.

Western Digital competes through overlapping ePMR/UltraSMR and HAMR roadmaps. Its 40 TB UltraSMR drive is in qualification, and its Q4 FY2026 deck showed 209 nearline exabytes shipped in one quarter. The company is also adding differentiated security and performance technologies, including post-quantum-ready firmware protection, power-optimized designs and dual-pivot/high-bandwidth concepts for AI storage.

Toshiba is the third major HDD manufacturer and remains particularly relevant in nearline enterprise storage. Its 2026 M12 family samples 30–34 TB SMR drives and plans 28 TB CMR variants. The source page omits Toshiba but lists Hitachi, Intel, Samsung, Sandisk, Micron and several storage brands; those names reflect historical or adjacent storage markets rather than current equivalent HDD manufacturing positions.

Competitive tier Companies Why they matter
Current global HDD OEMs Seagate; Western Digital; Toshiba These three companies manufacture current HDD product families at global scale and invest in recording heads, media, firmware and mechanical platforms. Competition is concentrated in nearline capacity, areal density, fleet reliability and hyperscale qualification, with technology paths spanning HAMR, ePMR and SMR.
Historical / adjacent storage names from source page Hitachi; Intel; Samsung; Sandisk; Micron Hitachi GST was acquired by Western Digital, while Intel, Samsung, Sandisk and Micron are primarily semiconductor or flash-storage suppliers rather than equivalent current HDD OEMs. They are retained because the source page lists them, but they should not be ranked as direct HDD manufacturers in 2026.
Channel / SSD-oriented brands from source page Liteon; Kingston Digital; Corsair; Plextor; Galaxy Technology; Shinedisk; Biwin; ADATA These brands participate in broader storage hardware, SSDs or channel products. Their commercial presence may overlap external storage or PC channels, but current high-capacity HDD technology and manufacturing is not centered on these companies.

Companies profiled in the report

The source page lists WD, Seagate, Hitachi, Intel, Samsung, Sandisk, Micron, Liteon, Kingston Digital, Corsair, Plextor, Galaxy Technology, Shinedisk, Biwin and ADATA. This list is preserved for source fidelity, but the competitive analysis explicitly separates current HDD manufacturers—Seagate, Western Digital and Toshiba—from historical or flash/SSD-oriented names. This distinction matters because modern cloud buyers evaluate storage at rack and fleet level, so drive capacity, firmware behavior, reliability and infrastructure efficiency are more important than standalone spindle specifications.

Production Capacity Analysis

HDD production capacity depends on recording-head output, magnetic-media processing, precision motors, mechanical assembly, controller electronics, firmware and customer qualification. Unlike commodity assembly, high-capacity drives require synchronized advances across areal density and manufacturing yield. Nearline exabyte demand can therefore increase faster than drive units because each generation stores more data per spindle.

Seagate’s HAMR platform illustrates the manufacturing challenge. The company designs and manufactures laser technology used to heat microscopic areas of the media and has moved Mozaic 4+ into production with hyperscalers. Scaling HAMR requires reliable photonics, media chemistry, heads and system-on-chip control at millions of drives, making process yield and vertical integration central to effective capacity.

Western Digital’s fiscal Q4 2026 metric of 231 total exabytes, including 209 nearline exabytes, provides a practical measure of output. The industry increasingly manages capacity in exabytes rather than units because moving from 20 TB to 40 TB drives can double shipped capacity without doubling assembly volume. Customer qualification and mix therefore determine revenue more directly than factory unit count.

Toshiba’s M12 sampling program demonstrates the role of qualification timing. A 34 TB product does not become meaningful market capacity until cloud customers complete firmware, workload, reliability and system tests. Production planning must align recording technology with the pace of customer approval, making qualified exabytes the relevant capacity measure rather than announced nameplate output.

Market Dynamics

The HDD market is driven by AI data retention, cloud storage growth, surveillance and lower cost per terabyte, while it is restrained by SSD substitution, mechanical performance limits and concentrated capital-intensive technology development. Growth is modest in revenue but technologically active because suppliers must increase capacity per drive fast enough to preserve HDD economics against flash.

Market Drivers

Driver Directional impact* Commercial mechanism
Hyperscale data growth High Cloud and AI create massive persistent datasets that must be stored economically. Nearline HDDs remain the preferred capacity tier for large object stores and archives.
Areal-density innovation High HAMR, ePMR and SMR increase terabytes per drive, improving rack density and watts per TB and protecting HDD TCO against flash.
Surveillance and video retention Medium Higher camera resolution and longer retention periods generate sequential workloads well suited to HDD economics.
Backup and archive requirements Medium Enterprises retain regulatory, business-continuity and historical data that does not justify all-flash performance.

AI creates a retention problem as well as a compute problem

AI systems generate training datasets, model checkpoints, logs, synthetic data and inference outputs that must remain retrievable after computation ends. Flash serves high-performance tiers, but retaining petabytes at acceptable cost pushes most long-horizon data toward HDD-based object storage. The result is a complementary relationship in which AI can increase both SSD and HDD demand.

Higher areal density preserves HDD cost leadership

Areal density allows suppliers to ship more terabytes with roughly the same mechanical form factor, reducing drives, racks and watts for a fixed capacity target. Seagate’s 44 TB HAMR and Western Digital’s 40 TB UltraSMR qualification demonstrate why recording technology remains strategically important even though HDD unit shipments are mature.

Surveillance remains structurally HDD-friendly

Video systems write continuously and rarely require millisecond random access. Higher resolution, more cameras and longer retention directly expand terabyte requirements, making HDDs economical in DVR/NVR and centralized surveillance. Purpose-built firmware and vibration handling create a stable application niche that is less exposed to client SSD substitution. Buyers therefore compare total cost per retained terabyte, qualification risk, power demand and long-term roadmap continuity before adopting a new recording architecture across large storage fleets.

Archive demand grows with regulation and digital preservation

Enterprises, governments and research organizations retain records for compliance, legal discovery, business continuity and historical analysis. Tape is cheaper for deep offline archive, but HDD offers easier online access and operational simplicity, supporting a large nearline tier between flash and tape. Through 2034, suppliers that raise areal density while preserving enterprise reliability can keep HDD economics attractive for AI, cloud, surveillance and archive workloads even as SSDs dominate latency-sensitive applications.

Market Restraints

Restraint Directional impact* Commercial mechanism
SSD substitution High in client markets SSDs dominate notebooks and performance PC storage because of lower latency, shock resistance and falling price per GB.
Mechanical performance limits Medium Rotating media cannot match flash random IOPS or latency, limiting HDD use in transaction-heavy or high-performance applications.
Technology concentration Medium to High Only three major HDD OEMs remain, and recording-head/media R&D is expensive. Supply shocks or qualification delays can therefore affect global capacity materially.
Long qualification cycles Medium Hyperscalers validate firmware, reliability and workload behavior extensively, slowing adoption of new recording technologies despite announced capacity.

Flash continues to remove HDDs from latency-sensitive workloads

Client notebooks, boot drives and transaction-heavy enterprise applications have largely migrated to SSDs. NAND cost declines make this substitution increasingly economical at lower capacities. HDD suppliers therefore cannot rely on unit markets that once provided enormous scale and must concentrate investment on mass-capacity use cases where terabyte economics dominate. The market implication is that an announced capacity becomes commercially meaningful only after production yield and hyperscale qualification are stable enough to support sustained exabyte shipments.

Mechanical architecture constrains random performance

HDD heads must physically seek across rotating platters, creating millisecond latency and relatively low random IOPS. Techniques such as dual actuators or higher-bandwidth designs can improve throughput, but they do not eliminate the fundamental latency gap versus NAND. HDDs therefore need workload placement strategies that exploit sequential access and capacity.

The supplier base is highly concentrated

Seagate, Western Digital and Toshiba are the only major current HDD manufacturers, and each invests heavily in proprietary heads, media and firmware. Concentration can support disciplined supply, but it also means a manufacturing disruption or delayed technology transition at one supplier can materially affect the global market. For HDD suppliers, the commercial consequence is that qualified exabytes, areal density, watts per terabyte and hyperscale allocation determine revenue quality more directly than legacy client-drive unit volumes.

New high-density drives require lengthy customer qualification

Hyperscale operators validate new capacities over long test cycles because a firmware or reliability issue can affect thousands of drives. HAMR, UltraSMR and new mechanical architectures therefore move from announcement to large revenue only after customer qualification, limiting how quickly suppliers can monetize technology. This distinction matters because modern cloud buyers evaluate storage at rack and fleet level, so drive capacity, firmware behavior, reliability and infrastructure efficiency are more important than standalone spindle specifications.

Market Opportunities

AI context and persistent data tiers

AI workloads need large online datasets outside expensive GPU memory and flash. HDD-based object stores can serve long-term context, training corpora and generated data, creating a durable mass-capacity role beneath high-performance tiers. Buyers therefore compare total cost per retained terabyte, qualification risk, power demand and long-term roadmap continuity before adopting a new recording architecture across large storage fleets.

100 TB roadmap

Seagate and Western Digital both outline paths toward 100 TB-class drives. If achieved with acceptable reliability and power, these products can lower infrastructure cost substantially and extend HDD competitiveness into the next decade. Through 2034, suppliers that raise areal density while preserving enterprise reliability can keep HDD economics attractive for AI, cloud, surveillance and archive workloads even as SSDs dominate latency-sensitive applications.

Power-optimized nearline storage

Western Digital has introduced power-optimized HDD concepts using less energy, while higher capacities reduce watts per terabyte. Operators facing data-center power constraints can use energy-optimized HDD tiers for warm or cold data rather than keeping every drive at maximum performance. The market implication is that an announced capacity becomes commercially meaningful only after production yield and hyperscale qualification are stable enough to support sustained exabyte shipments.

Secure enterprise drives

Western Digital’s post-quantum-ready secure boot and firmware protection shows that security can become a product differentiator. Large data stores need device trust, encryption and firmware integrity over long retention periods, creating value beyond raw capacity. For HDD suppliers, the commercial consequence is that qualified exabytes, areal density, watts per terabyte and hyperscale allocation determine revenue quality more directly than legacy client-drive unit volumes.

Supply Chain Analysis

Stage 1
Magnetic media & recording heads
Stage 2
Precision mechanics & electronics
Stage 3
Drive assembly, testing & qualification
Stage 4
Storage system & hyperscale integration

Magnetic media & recording heads

Platters require precisely engineered magnetic layers, while heads read and write extremely small bits. HAMR adds photonic laser components and specialized media. Manufacturing yield at this stage determines achievable areal density and cost per terabyte. This distinction matters because modern cloud buyers evaluate storage at rack and fleet level, so drive capacity, firmware behavior, reliability and infrastructure efficiency are more important than standalone spindle specifications.

Precision mechanics & electronics

Spindle motors, suspensions, actuators, enclosures and controller SoCs must operate reliably for years under vibration and thermal cycling. Enterprise drives use sophisticated servo control, error recovery and firmware tailored to large storage fleets. Buyers therefore compare total cost per retained terabyte, qualification risk, power demand and long-term roadmap continuity before adopting a new recording architecture across large storage fleets.

Drive assembly, testing & qualification

Manufacturers assemble drives, perform burn-in and reliability testing, then provide samples to OEMs and hyperscalers. New capacities can require months of qualification before large deployments, so effective supply is constrained by approved products rather than physical assembly alone. Through 2034, suppliers that raise areal density while preserving enterprise reliability can keep HDD economics attractive for AI, cloud, surveillance and archive workloads even as SSDs dominate latency-sensitive applications.

Storage system & hyperscale integration

Drives are installed into object-storage, backup, surveillance and enterprise arrays. Software determines whether SMR or other advanced recording technologies can be used efficiently, making host architecture an important part of the HDD value chain. The market implication is that an announced capacity becomes commercially meaningful only after production yield and hyperscale qualification are stable enough to support sustained exabyte shipments.

Recent Developments

Recent developments confirm that HDD innovation is concentrated on hyperscale capacity, areal density, energy efficiency and device trust. The strongest 2026 signals come from Seagate, Western Digital and Toshiba—the three current large-scale HDD manufacturers—rather than from the broader storage-brand list on the source page. For HDD suppliers, the commercial consequence is that qualified exabytes, areal density, watts per terabyte and hyperscale allocation determine revenue quality more directly than legacy client-drive unit volumes.

August 5, 2026 — Western Digital reported strong nearline shipment growth

Western Digital reported fiscal Q4 2026 revenue of USD 3.75 billion, up 44% year over year. Its accompanying business metrics showed 231 exabytes shipped, including 209 exabytes of nearline capacity. The result demonstrates the extent to which current HDD economics are driven by hyperscale capacity shipments rather than client-drive unit volume.

Source

May 18, 2026 — Western Digital added post-quantum security to high-capacity HDDs

Western Digital announced PQC-ready secure boot and firmware protection in new high-capacity Ultrastar UltraSMR drives under qualification with multiple hyperscale customers. The development adds device trust and long-term cryptographic resilience to the enterprise HDD qualification stack alongside capacity, power and reliability. This distinction matters because modern cloud buyers evaluate storage at rack and fleet level, so drive capacity, firmware behavior, reliability and infrastructure efficiency are more important than standalone spindle specifications.

Source

March 31, 2026 — Toshiba began sampling 30–34 TB SMR nearline drives

Toshiba announced M12 Series 3.5-inch nearline HDD samples at 30–34 TB using SMR, with CMR versions up to 28 TB planned for later in 2026. The products target hyperscale and cloud service providers and confirm continued multi-vendor competition in high-capacity nearline storage. Buyers therefore compare total cost per retained terabyte, qualification risk, power demand and long-term roadmap continuity before adopting a new recording architecture across large storage fleets.

Source

March 3, 2026 — Seagate qualified Mozaic 4+ at up to 44 TB

Seagate announced that its second-generation HAMR-based Mozaic 4+ platform was qualified and in production with two leading hyperscale cloud providers at capacities up to 44 TB. The company says the platform exceeds 4 TB per disk and forms part of a roadmap toward 10 TB per disk and drives up to 100 TB.

Source

Report Scope & Segmentation

Attribute Coverage
Market Hard Disk Drives (HDDs)
Base Year 2025
Estimated Year 2026
Forecast Period 2026–2034
2025 Market Size USD 26.14 billion
2034 Forecast Size USD 31.51 billion
CAGR 2.1% (2026–2034)
Largest Market in 2025 North America
By Type External Hard Drives; Internal Hard Drives
By Application Personal Use; Business Use
Regions North America; Asia Pacific; Europe; South America; Middle East & Africa
Companies Profiled WD; Seagate; Hitachi; Intel; Samsung; Sandisk; Micron; Liteon; Kingston Digital; Corsair; Plextor; Galaxy Technology; Shinedisk; Biwin; ADATA; current HDD OEM context additionally covers Toshiba

Frequently Asked Questions

What is the Hard Disk Drives market size in 2025?

The source page publishes USD 25.60 billion in 2024 and USD 30.23 billion in 2032. Those values imply a 2025 market size of approximately USD 26.14 billion. Applying the same compound rate gives an estimated USD 26.69 billion in 2026 and approximately USD 31.51 billion in 2034. Through 2034, suppliers that raise areal density while preserving enterprise reliability can keep HDD economics attractive for AI, cloud, surveillance and archive workloads even as SSDs dominate latency-sensitive applications.

What is the projected HDD market size by 2034?

The rebased 2034 HDD market is approximately USD 31.51 billion. This extends the source page’s 2024–2032 market-size anchors using the same compound growth factor. Revenue growth is modest because higher capacity per drive offsets declining unit demand in client categories. The market implication is that an announced capacity becomes commercially meaningful only after production yield and hyperscale qualification are stable enough to support sustained exabyte shipments.

Does the page’s 2.1% CAGR reconcile with its market-size anchors?

Yes. USD 25.60 billion in 2024 and USD 30.23 billion in 2032 imply approximately 2.10% compound annual growth, so the page’s printed 2.1% CAGR is mathematically consistent with the stated endpoints. For HDD suppliers, the commercial consequence is that qualified exabytes, areal density, watts per terabyte and hyperscale allocation determine revenue quality more directly than legacy client-drive unit volumes.

Which HDD type leads the market?

Internal Hard Drives lead by value because they include high-capacity nearline enterprise drives used in cloud, surveillance and storage arrays. External HDDs remain relevant for personal and small-business backup but face stronger substitution from portable SSDs and cloud services. This distinction matters because modern cloud buyers evaluate storage at rack and fleet level, so drive capacity, firmware behavior, reliability and infrastructure efficiency are more important than standalone spindle specifications.

Which application is largest?

Business Use is the largest value pool because hyperscale cloud, enterprise backup, surveillance and archive systems consume far more terabytes than individual consumers. Current vendor metrics are increasingly reported in nearline exabytes rather than drive units, reflecting this shift. Buyers therefore compare total cost per retained terabyte, qualification risk, power demand and long-term roadmap continuity before adopting a new recording architecture across large storage fleets.

Which region is the largest HDD market?

The source page is inconsistent: its FAQ says North America leads due data-center and enterprise demand, while its regional narrative says Asia Pacific dominates due manufacturing. This article uses North America as the largest end-demand market and treats Asia Pacific as the principal manufacturing cluster. Through 2034, suppliers that raise areal density while preserving enterprise reliability can keep HDD economics attractive for AI, cloud, surveillance and archive workloads even as SSDs dominate latency-sensitive applications.

Why are HDDs still relevant when SSD prices keep falling?

HDDs retain a large advantage in cost per terabyte for very large persistent datasets. AI, backup, surveillance and cloud object storage need petabytes or exabytes that do not require flash latency. Higher-density drives also improve rack and power efficiency, preserving system-level economics. The market implication is that an announced capacity becomes commercially meaningful only after production yield and hyperscale qualification are stable enough to support sustained exabyte shipments.

What technologies are increasing HDD capacity?

The main technologies are HAMR, ePMR and SMR/UltraSMR. Seagate is shipping HAMR-based Mozaic drives up to 44 TB, Western Digital is qualifying a 40 TB UltraSMR ePMR drive while continuing HAMR development, and Toshiba is sampling 30–34 TB SMR products. For HDD suppliers, the commercial consequence is that qualified exabytes, areal density, watts per terabyte and hyperscale allocation determine revenue quality more directly than legacy client-drive unit volumes.

Who are the current major HDD manufacturers?

Current large-scale HDD manufacturing is concentrated among Seagate, Western Digital and Toshiba. The source page includes a broader storage-company list containing historical and flash/SSD-oriented names such as Hitachi, Intel, Samsung, Sandisk and Micron, so those names are preserved but not treated as equivalent current HDD OEMs. This distinction matters because modern cloud buyers evaluate storage at rack and fleet level, so drive capacity, firmware behavior, reliability and infrastructure efficiency are more important than standalone spindle specifications.

What is the main strategic opportunity through 2034?

The largest opportunity is to keep increasing terabytes per drive faster than storage demand raises infrastructure cost. HAMR, UltraSMR, energy-optimized designs and secure enterprise firmware can extend HDD competitiveness in AI and cloud capacity tiers even while client PCs continue shifting toward SSDs. Buyers therefore compare total cost per retained terabyte, qualification risk, power demand and long-term roadmap continuity before adopting a new recording architecture across large storage fleets.

Global Hard Disk Drives (HDDs) Market Research Report 2026-2034

Get Sample Report PDF for Exclusive Insights

Report Sample Includes

  • Table of Contents
  • List of Tables & Figures
  • Charts, Research Methodology, and more...

PDF Icon Download Sample Report PDF

Download Sample Report

Table of Content

Table of Contents
1 Research Methodology and Statistical Scope
1.1 Market Definition and Statistical Scope of Hard Disk Drives (HDDs)
1.2 Key Market Segments
1.2.1 Hard Disk Drives (HDDs) Segment by Type
1.2.2 Hard Disk Drives (HDDs) Segment by Application
1.3 Methodology & Sources of Information
1.3.1 Research Methodology
1.3.2 Research Process
1.3.3 Market Breakdown and Data Triangulation
1.3.4 Base Year
1.3.5 Report Assumptions & Caveats
2 Hard Disk Drives (HDDs) Market Overview
2.1 Global Market Overview
2.1.1 Global Hard Disk Drives (HDDs) Market Size (M USD) Estimates and Forecasts (2019-2032)
2.1.2 Global Hard Disk Drives (HDDs) Sales Estimates and Forecasts (2019-2032)
2.2 Market Segment Executive Summary
2.3 Global Market Size by Region
3 Hard Disk Drives (HDDs) Market Competitive Landscape
3.1 Global Hard Disk Drives (HDDs) Sales by Manufacturers (2019-2025)
3.2 Global Hard Disk Drives (HDDs) Revenue Market Share by Manufacturers (2019-2025)
3.3 Hard Disk Drives (HDDs) Market Share by Company Type (Tier 1, Tier 2, and Tier 3)
3.4 Global Hard Disk Drives (HDDs) Average Price by Manufacturers (2019-2025)
3.5 Manufacturers Hard Disk Drives (HDDs) Sales Sites, Area Served, Product Type
3.6 Hard Disk Drives (HDDs) Market Competitive Situation and Trends
3.6.1 Hard Disk Drives (HDDs) Market Concentration Rate
3.6.2 Global 5 and 10 Largest Hard Disk Drives (HDDs) Players Market Share by Revenue
3.6.3 Mergers & Acquisitions, Expansion
4 Hard Disk Drives (HDDs) Industry Chain Analysis
4.1 Hard Disk Drives (HDDs) Industry Chain Analysis
4.2 Market Overview of Key Raw Materials
4.3 Midstream Market Analysis
4.4 Downstream Customer Analysis
5 The Development and Dynamics of Hard Disk Drives (HDDs) Market
5.1 Key Development Trends
5.2 Driving Factors
5.3 Market Challenges
5.4 Market Restraints
5.5 Industry News
5.5.1 New Product Developments
5.5.2 Mergers & Acquisitions
5.5.3 Expansions
5.5.4 Collaboration/Supply Contracts
5.6 Industry Policies
6 Hard Disk Drives (HDDs) Market Segmentation by Type
6.1 Evaluation Matrix of Segment Market Development Potential (Type)
6.2 Global Hard Disk Drives (HDDs) Sales Market Share by Type (2019-2025)
6.3 Global Hard Disk Drives (HDDs) Market Size Market Share by Type (2019-2025)
6.4 Global Hard Disk Drives (HDDs) Price by Type (2019-2025)
7 Hard Disk Drives (HDDs) Market Segmentation by Application
7.1 Evaluation Matrix of Segment Market Development Potential (Application)
7.2 Global Hard Disk Drives (HDDs) Market Sales by Application (2019-2025)
7.3 Global Hard Disk Drives (HDDs) Market Size (M USD) by Application (2019-2025)
7.4 Global Hard Disk Drives (HDDs) Sales Growth Rate by Application (2019-2025)
8 Hard Disk Drives (HDDs) Market Segmentation by Region
8.1 Global Hard Disk Drives (HDDs) Sales by Region
8.1.1 Global Hard Disk Drives (HDDs) Sales by Region
8.1.2 Global Hard Disk Drives (HDDs) Sales Market Share by Region
8.2 North America
8.2.1 North America Hard Disk Drives (HDDs) Sales by Country
8.2.2 U.S.
8.2.3 Canada
8.2.4 Mexico
8.3 Europe
8.3.1 Europe Hard Disk Drives (HDDs) Sales by Country
8.3.2 Germany
8.3.3 France
8.3.4 U.K.
8.3.5 Italy
8.3.6 Russia
8.4 Asia Pacific
8.4.1 Asia Pacific Hard Disk Drives (HDDs) Sales by Region
8.4.2 China
8.4.3 Japan
8.4.4 South Korea
8.4.5 India
8.4.6 Southeast Asia
8.5 South America
8.5.1 South America Hard Disk Drives (HDDs) Sales by Country
8.5.2 Brazil
8.5.3 Argentina
8.5.4 Columbia
8.6 Middle East and Africa
8.6.1 Middle East and Africa Hard Disk Drives (HDDs) Sales by Region
8.6.2 Saudi Arabia
8.6.3 UAE
8.6.4 Egypt
8.6.5 Nigeria
8.6.6 South Africa
9 Key Companies Profile
9.1 WD
9.1.1 WD Hard Disk Drives (HDDs) Basic Information
9.1.2 WD Hard Disk Drives (HDDs) Product Overview
9.1.3 WD Hard Disk Drives (HDDs) Product Market Performance
9.1.4 WD Business Overview
9.1.5 WD Hard Disk Drives (HDDs) SWOT Analysis
9.1.6 WD Recent Developments
9.2 Seagate
9.2.1 Seagate Hard Disk Drives (HDDs) Basic Information
9.2.2 Seagate Hard Disk Drives (HDDs) Product Overview
9.2.3 Seagate Hard Disk Drives (HDDs) Product Market Performance
9.2.4 Seagate Business Overview
9.2.5 Seagate Hard Disk Drives (HDDs) SWOT Analysis
9.2.6 Seagate Recent Developments
9.3 Hitachi
9.3.1 Hitachi Hard Disk Drives (HDDs) Basic Information
9.3.2 Hitachi Hard Disk Drives (HDDs) Product Overview
9.3.3 Hitachi Hard Disk Drives (HDDs) Product Market Performance
9.3.4 Hitachi Hard Disk Drives (HDDs) SWOT Analysis
9.3.5 Hitachi Business Overview
9.3.6 Hitachi Recent Developments
9.4 Intel
9.4.1 Intel Hard Disk Drives (HDDs) Basic Information
9.4.2 Intel Hard Disk Drives (HDDs) Product Overview
9.4.3 Intel Hard Disk Drives (HDDs) Product Market Performance
9.4.4 Intel Business Overview
9.4.5 Intel Recent Developments
9.5 Samsung
9.5.1 Samsung Hard Disk Drives (HDDs) Basic Information
9.5.2 Samsung Hard Disk Drives (HDDs) Product Overview
9.5.3 Samsung Hard Disk Drives (HDDs) Product Market Performance
9.5.4 Samsung Business Overview
9.5.5 Samsung Recent Developments
9.6 Sandisk
9.6.1 Sandisk Hard Disk Drives (HDDs) Basic Information
9.6.2 Sandisk Hard Disk Drives (HDDs) Product Overview
9.6.3 Sandisk Hard Disk Drives (HDDs) Product Market Performance
9.6.4 Sandisk Business Overview
9.6.5 Sandisk Recent Developments
9.7 Micron
9.7.1 Micron Hard Disk Drives (HDDs) Basic Information
9.7.2 Micron Hard Disk Drives (HDDs) Product Overview
9.7.3 Micron Hard Disk Drives (HDDs) Product Market Performance
9.7.4 Micron Business Overview
9.7.5 Micron Recent Developments
9.8 Liteon
9.8.1 Liteon Hard Disk Drives (HDDs) Basic Information
9.8.2 Liteon Hard Disk Drives (HDDs) Product Overview
9.8.3 Liteon Hard Disk Drives (HDDs) Product Market Performance
9.8.4 Liteon Business Overview
9.8.5 Liteon Recent Developments
9.9 Kingston Digital
9.9.1 Kingston Digital Hard Disk Drives (HDDs) Basic Information
9.9.2 Kingston Digital Hard Disk Drives (HDDs) Product Overview
9.9.3 Kingston Digital Hard Disk Drives (HDDs) Product Market Performance
9.9.4 Kingston Digital Business Overview
9.9.5 Kingston Digital Recent Developments
9.10 Corsair
9.10.1 Corsair Hard Disk Drives (HDDs) Basic Information
9.10.2 Corsair Hard Disk Drives (HDDs) Product Overview
9.10.3 Corsair Hard Disk Drives (HDDs) Product Market Performance
9.10.4 Corsair Business Overview
9.10.5 Corsair Recent Developments
9.11 Plextor
9.11.1 Plextor Hard Disk Drives (HDDs) Basic Information
9.11.2 Plextor Hard Disk Drives (HDDs) Product Overview
9.11.3 Plextor Hard Disk Drives (HDDs) Product Market Performance
9.11.4 Plextor Business Overview
9.11.5 Plextor Recent Developments
9.12 Galaxy Technology
9.12.1 Galaxy Technology Hard Disk Drives (HDDs) Basic Information
9.12.2 Galaxy Technology Hard Disk Drives (HDDs) Product Overview
9.12.3 Galaxy Technology Hard Disk Drives (HDDs) Product Market Performance
9.12.4 Galaxy Technology Business Overview
9.12.5 Galaxy Technology Recent Developments
9.13 Shinedisk
9.13.1 Shinedisk Hard Disk Drives (HDDs) Basic Information
9.13.2 Shinedisk Hard Disk Drives (HDDs) Product Overview
9.13.3 Shinedisk Hard Disk Drives (HDDs) Product Market Performance
9.13.4 Shinedisk Business Overview
9.13.5 Shinedisk Recent Developments
9.14 Biwin
9.14.1 Biwin Hard Disk Drives (HDDs) Basic Information
9.14.2 Biwin Hard Disk Drives (HDDs) Product Overview
9.14.3 Biwin Hard Disk Drives (HDDs) Product Market Performance
9.14.4 Biwin Business Overview
9.14.5 Biwin Recent Developments
9.15 Adata
9.15.1 Adata Hard Disk Drives (HDDs) Basic Information
9.15.2 Adata Hard Disk Drives (HDDs) Product Overview
9.15.3 Adata Hard Disk Drives (HDDs) Product Market Performance
9.15.4 Adata Business Overview
9.15.5 Adata Recent Developments
10 Hard Disk Drives (HDDs) Market Forecast by Region
10.1 Global Hard Disk Drives (HDDs) Market Size Forecast
10.2 Global Hard Disk Drives (HDDs) Market Forecast by Region
10.2.1 North America Market Size Forecast by Country
10.2.2 Europe Hard Disk Drives (HDDs) Market Size Forecast by Country
10.2.3 Asia Pacific Hard Disk Drives (HDDs) Market Size Forecast by Region
10.2.4 South America Hard Disk Drives (HDDs) Market Size Forecast by Country
10.2.5 Middle East and Africa Forecasted Consumption of Hard Disk Drives (HDDs) by Country
11 Forecast Market by Type and by Application (2025-2032)
11.1 Global Hard Disk Drives (HDDs) Market Forecast by Type (2025-2032)
11.1.1 Global Forecasted Sales of Hard Disk Drives (HDDs) by Type (2025-2032)
11.1.2 Global Hard Disk Drives (HDDs) Market Size Forecast by Type (2025-2032)
11.1.3 Global Forecasted Price of Hard Disk Drives (HDDs) by Type (2025-2032)
11.2 Global Hard Disk Drives (HDDs) Market Forecast by Application (2025-2032)
11.2.1 Global Hard Disk Drives (HDDs) Sales (K Units) Forecast by Application
11.2.2 Global Hard Disk Drives (HDDs) Market Size (M USD) Forecast by Application (2025-2032)
12 Conclusion and Key FindingsList of Tables
Table 1. Introduction of the Type
Table 2. Introduction of the Application
Table 3. Market Size (M USD) Segment Executive Summary
Table 4. Hard Disk Drives (HDDs) Market Size Comparison by Region (M USD)
Table 5. Global Hard Disk Drives (HDDs) Sales (K Units) by Manufacturers (2019-2025)
Table 6. Global Hard Disk Drives (HDDs) Sales Market Share by Manufacturers (2019-2025)
Table 7. Global Hard Disk Drives (HDDs) Revenue (M USD) by Manufacturers (2019-2025)
Table 8. Global Hard Disk Drives (HDDs) Revenue Share by Manufacturers (2019-2025)
Table 9. Company Type (Tier 1, Tier 2, and Tier 3) & (based on the Revenue in Hard Disk Drives (HDDs) as of 2022)
Table 10. Global Market Hard Disk Drives (HDDs) Average Price (USD/Unit) of Key Manufacturers (2019-2025)
Table 11. Manufacturers Hard Disk Drives (HDDs) Sales Sites and Area Served
Table 12. Manufacturers Hard Disk Drives (HDDs) Product Type
Table 13. Global Hard Disk Drives (HDDs) Manufacturers Market Concentration Ratio (CR5 and HHI)
Table 14. Mergers & Acquisitions, Expansion Plans
Table 15. Industry Chain Map of Hard Disk Drives (HDDs)
Table 16. Market Overview of Key Raw Materials
Table 17. Midstream Market Analysis
Table 18. Downstream Customer Analysis
Table 19. Key Development Trends
Table 20. Driving Factors
Table 21. Hard Disk Drives (HDDs) Market Challenges
Table 22. Global Hard Disk Drives (HDDs) Sales by Type (K Units)
Table 23. Global Hard Disk Drives (HDDs) Market Size by Type (M USD)
Table 24. Global Hard Disk Drives (HDDs) Sales (K Units) by Type (2019-2025)
Table 25. Global Hard Disk Drives (HDDs) Sales Market Share by Type (2019-2025)
Table 26. Global Hard Disk Drives (HDDs) Market Size (M USD) by Type (2019-2025)
Table 27. Global Hard Disk Drives (HDDs) Market Size Share by Type (2019-2025)
Table 28. Global Hard Disk Drives (HDDs) Price (USD/Unit) by Type (2019-2025)
Table 29. Global Hard Disk Drives (HDDs) Sales (K Units) by Application
Table 30. Global Hard Disk Drives (HDDs) Market Size by Application
Table 31. Global Hard Disk Drives (HDDs) Sales by Application (2019-2025) & (K Units)
Table 32. Global Hard Disk Drives (HDDs) Sales Market Share by Application (2019-2025)
Table 33. Global Hard Disk Drives (HDDs) Sales by Application (2019-2025) & (M USD)
Table 34. Global Hard Disk Drives (HDDs) Market Share by Application (2019-2025)
Table 35. Global Hard Disk Drives (HDDs) Sales Growth Rate by Application (2019-2025)
Table 36. Global Hard Disk Drives (HDDs) Sales by Region (2019-2025) & (K Units)
Table 37. Global Hard Disk Drives (HDDs) Sales Market Share by Region (2019-2025)
Table 38. North America Hard Disk Drives (HDDs) Sales by Country (2019-2025) & (K Units)
Table 39. Europe Hard Disk Drives (HDDs) Sales by Country (2019-2025) & (K Units)
Table 40. Asia Pacific Hard Disk Drives (HDDs) Sales by Region (2019-2025) & (K Units)
Table 41. South America Hard Disk Drives (HDDs) Sales by Country (2019-2025) & (K Units)
Table 42. Middle East and Africa Hard Disk Drives (HDDs) Sales by Region (2019-2025) & (K Units)
Table 43. WD Hard Disk Drives (HDDs) Basic Information
Table 44. WD Hard Disk Drives (HDDs) Product Overview
Table 45. WD Hard Disk Drives (HDDs) Sales (K Units), Revenue (M USD), Price (USD/Unit) and Gross Margin (2019-2025)
Table 46. WD Business Overview
Table 47. WD Hard Disk Drives (HDDs) SWOT Analysis
Table 48. WD Recent Developments
Table 49. Seagate Hard Disk Drives (HDDs) Basic Information
Table 50. Seagate Hard Disk Drives (HDDs) Product Overview
Table 51. Seagate Hard Disk Drives (HDDs) Sales (K Units), Revenue (M USD), Price (USD/Unit) and Gross Margin (2019-2025)
Table 52. Seagate Business Overview
Table 53. Seagate Hard Disk Drives (HDDs) SWOT Analysis
Table 54. Seagate Recent Developments
Table 55. Hitachi Hard Disk Drives (HDDs) Basic Information
Table 56. Hitachi Hard Disk Drives (HDDs) Product Overview
Table 57. Hitachi Hard Disk Drives (HDDs) Sales (K Units), Revenue (M USD), Price (USD/Unit) and Gross Margin (2019-2025)
Table 58. Hitachi Hard Disk Drives (HDDs) SWOT Analysis
Table 59. Hitachi Business Overview
Table 60. Hitachi Recent Developments
Table 61. Intel Hard Disk Drives (HDDs) Basic Information
Table 62. Intel Hard Disk Drives (HDDs) Product Overview
Table 63. Intel Hard Disk Drives (HDDs) Sales (K Units), Revenue (M USD), Price (USD/Unit) and Gross Margin (2019-2025)
Table 64. Intel Business Overview
Table 65. Intel Recent Developments
Table 66. Samsung Hard Disk Drives (HDDs) Basic Information
Table 67. Samsung Hard Disk Drives (HDDs) Product Overview
Table 68. Samsung Hard Disk Drives (HDDs) Sales (K Units), Revenue (M USD), Price (USD/Unit) and Gross Margin (2019-2025)
Table 69. Samsung Business Overview
Table 70. Samsung Recent Developments
Table 71. Sandisk Hard Disk Drives (HDDs) Basic Information
Table 72. Sandisk Hard Disk Drives (HDDs) Product Overview
Table 73. Sandisk Hard Disk Drives (HDDs) Sales (K Units), Revenue (M USD), Price (USD/Unit) and Gross Margin (2019-2025)
Table 74. Sandisk Business Overview
Table 75. Sandisk Recent Developments
Table 76. Micron Hard Disk Drives (HDDs) Basic Information
Table 77. Micron Hard Disk Drives (HDDs) Product Overview
Table 78. Micron Hard Disk Drives (HDDs) Sales (K Units), Revenue (M USD), Price (USD/Unit) and Gross Margin (2019-2025)
Table 79. Micron Business Overview
Table 80. Micron Recent Developments
Table 81. Liteon Hard Disk Drives (HDDs) Basic Information
Table 82. Liteon Hard Disk Drives (HDDs) Product Overview
Table 83. Liteon Hard Disk Drives (HDDs) Sales (K Units), Revenue (M USD), Price (USD/Unit) and Gross Margin (2019-2025)
Table 84. Liteon Business Overview
Table 85. Liteon Recent Developments
Table 86. Kingston Digital Hard Disk Drives (HDDs) Basic Information
Table 87. Kingston Digital Hard Disk Drives (HDDs) Product Overview
Table 88. Kingston Digital Hard Disk Drives (HDDs) Sales (K Units), Revenue (M USD), Price (USD/Unit) and Gross Margin (2019-2025)
Table 89. Kingston Digital Business Overview
Table 90. Kingston Digital Recent Developments
Table 91. Corsair Hard Disk Drives (HDDs) Basic Information
Table 92. Corsair Hard Disk Drives (HDDs) Product Overview
Table 93. Corsair Hard Disk Drives (HDDs) Sales (K Units), Revenue (M USD), Price (USD/Unit) and Gross Margin (2019-2025)
Table 94. Corsair Business Overview
Table 95. Corsair Recent Developments
Table 96. Plextor Hard Disk Drives (HDDs) Basic Information
Table 97. Plextor Hard Disk Drives (HDDs) Product Overview
Table 98. Plextor Hard Disk Drives (HDDs) Sales (K Units), Revenue (M USD), Price (USD/Unit) and Gross Margin (2019-2025)
Table 99. Plextor Business Overview
Table 100. Plextor Recent Developments
Table 101. Galaxy Technology Hard Disk Drives (HDDs) Basic Information
Table 102. Galaxy Technology Hard Disk Drives (HDDs) Product Overview
Table 103. Galaxy Technology Hard Disk Drives (HDDs) Sales (K Units), Revenue (M USD), Price (USD/Unit) and Gross Margin (2019-2025)
Table 104. Galaxy Technology Business Overview
Table 105. Galaxy Technology Recent Developments
Table 106. Shinedisk Hard Disk Drives (HDDs) Basic Information
Table 107. Shinedisk Hard Disk Drives (HDDs) Product Overview
Table 108. Shinedisk Hard Disk Drives (HDDs) Sales (K Units), Revenue (M USD), Price (USD/Unit) and Gross Margin (2019-2025)
Table 109. Shinedisk Business Overview
Table 110. Shinedisk Recent Developments
Table 111. Biwin Hard Disk Drives (HDDs) Basic Information
Table 112. Biwin Hard Disk Drives (HDDs) Product Overview
Table 113. Biwin Hard Disk Drives (HDDs) Sales (K Units), Revenue (M USD), Price (USD/Unit) and Gross Margin (2019-2025)
Table 114. Biwin Business Overview
Table 115. Biwin Recent Developments
Table 116. Adata Hard Disk Drives (HDDs) Basic Information
Table 117. Adata Hard Disk Drives (HDDs) Product Overview
Table 118. Adata Hard Disk Drives (HDDs) Sales (K Units), Revenue (M USD), Price (USD/Unit) and Gross Margin (2019-2025)
Table 119. Adata Business Overview
Table 120. Adata Recent Developments
Table 121. Global Hard Disk Drives (HDDs) Sales Forecast by Region (2025-2032) & (K Units)
Table 122. Global Hard Disk Drives (HDDs) Market Size Forecast by Region (2025-2032) & (M USD)
Table 123. North America Hard Disk Drives (HDDs) Sales Forecast by Country (2025-2032) & (K Units)
Table 124. North America Hard Disk Drives (HDDs) Market Size Forecast by Country (2025-2032) & (M USD)
Table 125. Europe Hard Disk Drives (HDDs) Sales Forecast by Country (2025-2032) & (K Units)
Table 126. Europe Hard Disk Drives (HDDs) Market Size Forecast by Country (2025-2032) & (M USD)
Table 127. Asia Pacific Hard Disk Drives (HDDs) Sales Forecast by Region (2025-2032) & (K Units)
Table 128. Asia Pacific Hard Disk Drives (HDDs) Market Size Forecast by Region (2025-2032) & (M USD)
Table 129. South America Hard Disk Drives (HDDs) Sales Forecast by Country (2025-2032) & (K Units)
Table 130. South America Hard Disk Drives (HDDs) Market Size Forecast by Country (2025-2032) & (M USD)
Table 131. Middle East and Africa Hard Disk Drives (HDDs) Consumption Forecast by Country (2025-2032) & (Units)
Table 132. Middle East and Africa Hard Disk Drives (HDDs) Market Size Forecast by Country (2025-2032) & (M USD)
Table 133. Global Hard Disk Drives (HDDs) Sales Forecast by Type (2025-2032) & (K Units)
Table 134. Global Hard Disk Drives (HDDs) Market Size Forecast by Type (2025-2032) & (M USD)
Table 135. Global Hard Disk Drives (HDDs) Price Forecast by Type (2025-2032) & (USD/Unit)
Table 136. Global Hard Disk Drives (HDDs) Sales (K Units) Forecast by Application (2025-2032)
Table 137. Global Hard Disk Drives (HDDs) Market Size Forecast by Application (2025-2032) & (M USD)
List of Figures
Figure 1. Product Picture of Hard Disk Drives (HDDs)
Figure 2. Data Triangulation
Figure 3. Key Caveats
Figure 4. Global Hard Disk Drives (HDDs) Market Size (M USD), 2019-2032
Figure 5. Global Hard Disk Drives (HDDs) Market Size (M USD) (2019-2032)
Figure 6. Global Hard Disk Drives (HDDs) Sales (K Units) & (2019-2032)
Figure 7. Evaluation Matrix of Segment Market Development Potential (Type)
Figure 8. Evaluation Matrix of Segment Market Development Potential (Application)
Figure 9. Evaluation Matrix of Regional Market Development Potential
Figure 10. Hard Disk Drives (HDDs) Market Size by Country (M USD)
Figure 11. Hard Disk Drives (HDDs) Sales Share by Manufacturers in 2023
Figure 12. Global Hard Disk Drives (HDDs) Revenue Share by Manufacturers in 2023
Figure 13. Hard Disk Drives (HDDs) Market Share by Company Type (Tier 1, Tier 2 and Tier 3): 2023
Figure 14. Global Market Hard Disk Drives (HDDs) Average Price (USD/Unit) of Key Manufacturers in 2023
Figure 15. The Global 5 and 10 Largest Players: Market Share by Hard Disk Drives (HDDs) Revenue in 2023
Figure 16. Evaluation Matrix of Segment Market Development Potential (Type)
Figure 17. Global Hard Disk Drives (HDDs) Market Share by Type
Figure 18. Sales Market Share of Hard Disk Drives (HDDs) by Type (2019-2025)
Figure 19. Sales Market Share of Hard Disk Drives (HDDs) by Type in 2023
Figure 20. Market Size Share of Hard Disk Drives (HDDs) by Type (2019-2025)
Figure 21. Market Size Market Share of Hard Disk Drives (HDDs) by Type in 2023
Figure 22. Evaluation Matrix of Segment Market Development Potential (Application)
Figure 23. Global Hard Disk Drives (HDDs) Market Share by Application
Figure 24. Global Hard Disk Drives (HDDs) Sales Market Share by Application (2019-2025)
Figure 25. Global Hard Disk Drives (HDDs) Sales Market Share by Application in 2023
Figure 26. Global Hard Disk Drives (HDDs) Market Share by Application (2019-2025)
Figure 27. Global Hard Disk Drives (HDDs) Market Share by Application in 2023
Figure 28. Global Hard Disk Drives (HDDs) Sales Growth Rate by Application (2019-2025)
Figure 29. Global Hard Disk Drives (HDDs) Sales Market Share by Region (2019-2025)
Figure 30. North America Hard Disk Drives (HDDs) Sales and Growth Rate (2019-2025) & (K Units)
Figure 31. North America Hard Disk Drives (HDDs) Sales Market Share by Country in 2023
Figure 32. U.S. Hard Disk Drives (HDDs) Sales and Growth Rate (2019-2025) & (K Units)
Figure 33. Canada Hard Disk Drives (HDDs) Sales (K Units) and Growth Rate (2019-2025)
Figure 34. Mexico Hard Disk Drives (HDDs) Sales (Units) and Growth Rate (2019-2025)
Figure 35. Europe Hard Disk Drives (HDDs) Sales and Growth Rate (2019-2025) & (K Units)
Figure 36. Europe Hard Disk Drives (HDDs) Sales Market Share by Country in 2023
Figure 37. Germany Hard Disk Drives (HDDs) Sales and Growth Rate (2019-2025) & (K Units)
Figure 38. France Hard Disk Drives (HDDs) Sales and Growth Rate (2019-2025) & (K Units)
Figure 39. U.K. Hard Disk Drives (HDDs) Sales and Growth Rate (2019-2025) & (K Units)
Figure 40. Italy Hard Disk Drives (HDDs) Sales and Growth Rate (2019-2025) & (K Units)
Figure 41. Russia Hard Disk Drives (HDDs) Sales and Growth Rate (2019-2025) & (K Units)
Figure 42. Asia Pacific Hard Disk Drives (HDDs) Sales and Growth Rate (K Units)
Figure 43. Asia Pacific Hard Disk Drives (HDDs) Sales Market Share by Region in 2023
Figure 44. China Hard Disk Drives (HDDs) Sales and Growth Rate (2019-2025) & (K Units)
Figure 45. Japan Hard Disk Drives (HDDs) Sales and Growth Rate (2019-2025) & (K Units)
Figure 46. South Korea Hard Disk Drives (HDDs) Sales and Growth Rate (2019-2025) & (K Units)
Figure 47. India Hard Disk Drives (HDDs) Sales and Growth Rate (2019-2025) & (K Units)
Figure 48. Southeast Asia Hard Disk Drives (HDDs) Sales and Growth Rate (2019-2025) & (K Units)
Figure 49. South America Hard Disk Drives (HDDs) Sales and Growth Rate (K Units)
Figure 50. South America Hard Disk Drives (HDDs) Sales Market Share by Country in 2023
Figure 51. Brazil Hard Disk Drives (HDDs) Sales and Growth Rate (2019-2025) & (K Units)
Figure 52. Argentina Hard Disk Drives (HDDs) Sales and Growth Rate (2019-2025) & (K Units)
Figure 53. Columbia Hard Disk Drives (HDDs) Sales and Growth Rate (2019-2025) & (K Units)
Figure 54. Middle East and Africa Hard Disk Drives (HDDs) Sales and Growth Rate (K Units)
Figure 55. Middle East and Africa Hard Disk Drives (HDDs) Sales Market Share by Region in 2023
Figure 56. Saudi Arabia Hard Disk Drives (HDDs) Sales and Growth Rate (2019-2025) & (K Units)
Figure 57. UAE Hard Disk Drives (HDDs) Sales and Growth Rate (2019-2025) & (K Units)
Figure 58. Egypt Hard Disk Drives (HDDs) Sales and Growth Rate (2019-2025) & (K Units)
Figure 59. Nigeria Hard Disk Drives (HDDs) Sales and Growth Rate (2019-2025) & (K Units)
Figure 60. South Africa Hard Disk Drives (HDDs) Sales and Growth Rate (2019-2025) & (K Units)
Figure 61. Global Hard Disk Drives (HDDs) Sales Forecast by Volume (2019-2032) & (K Units)
Figure 62. Global Hard Disk Drives (HDDs) Market Size Forecast by Value (2019-2032) & (M USD)
Figure 63. Global Hard Disk Drives (HDDs) Sales Market Share Forecast by Type (2025-2032)
Figure 64. Global Hard Disk Drives (HDDs) Market Share Forecast by Type (2025-2032)
Figure 65. Global Hard Disk Drives (HDDs) Sales Forecast by Application (2025-2032)
Figure 66. Global Hard Disk Drives (HDDs) Market Share Forecast by Application (2025-2032)