Key Statistics
Key Takeaways
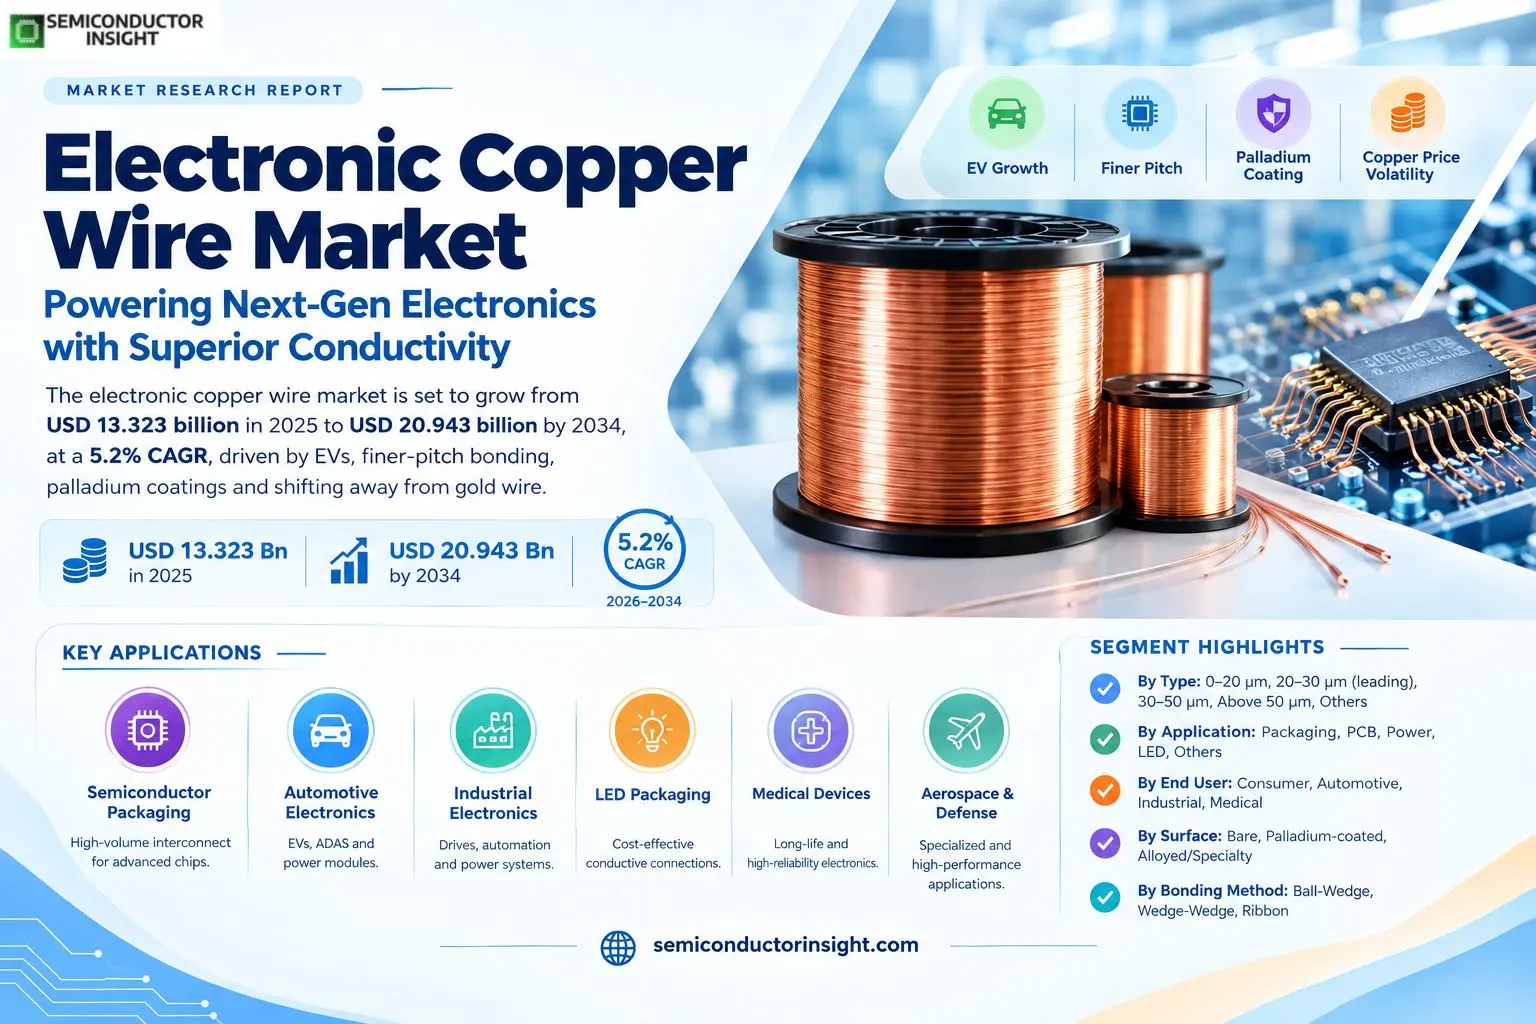
- Market size and growth: the market is valued at USD 13.323 billion in 2025 and is projected to reach USD 20.943 billion by 2034, representing a 5.2% CAGR over 2026–2034.
- 20-30 µm leads by type because this diameter range balances fine-pitch capability, mechanical strength, bond reliability and high-volume manufacturability across mainstream semiconductor packages.
- Semiconductor Packaging leads application demand because wire bonding remains a high-volume interconnect method across analog, power, memory, sensors and many mature semiconductor packages.
- Asia Pacific is the largest regional market, while Asia Pacific has the strongest incremental growth profile.
- Primary driver: semiconductor packaging, EV power electronics and substitution away from expensive gold bonding wire continue to expand copper use
- Principal restraint: copper oxidation, bonding hardness, raw-material price volatility and advanced-package substitution can limit wire-bonding growth
Market Overview
The electronic copper wire market was valued at USD 13.323 billion in 2025 and is projected to reach USD 20.943 billion by 2034, expanding at a 5.2% CAGR over 2026–2034. Asia Pacific leads in 2025, while the market is being reshaped by finer-pitch copper bonding, palladium-coated copper, EV power modules, copper-price volatility and ongoing substitution away from gold bonding wire.. Commercial decisions therefore balance performance, qualification, lifecycle support and total system cost rather than relying on one headline specification.
Electronic copper wire serves as a conductive interconnect in semiconductor packaging, power modules, electronics and selected PCB or LED applications, combining high electrical conductivity with much lower raw-material cost than gold. Heraeus currently supplies bare and coated copper fine bonding wire down to 15 micrometers and positions copper as a high-temperature, high-conductivity alternative to gold, while TANAKA also offers ultra-fine high-purity copper and palladium-coated copper products. These portfolios show why copper has become a standard interconnect material rather than a niche cost-reduction option.
Copper’s role extends from fine wire bonding to thick power interconnects. Heraeus PowerCu products are designed for EV drivetrains, IGBT, SiC and GaN power modules, while TANAKA’s CP-1 copper bonding wire is offered in 200–500 micrometer diameters for power devices and batteries. The electrical and thermal advantages are attractive as current density rises, but copper is harder than gold or aluminum and oxidizes readily, so bonding equipment, protective atmosphere, coatings and package metallurgy must be optimized to preserve yield and long-term reliability.
Raw-material economics remain strategically important because the market sits downstream of the global copper supply chain. The U.S. Geological Survey’s 2026 copper summary reported a projected 2025 COMEX price of $4.80 per pound and highlighted refined-copper supply constraints and new production projects. Electronic-grade wire represents only a small share of total copper use, but price swings still affect inventory, contract negotiations and the economics of high-volume bonding, reinforcing supplier interest in recycling, thinner wire, palladium coatings and higher-yield manufacturing.
Segment Analysis: By Type
By type, the market is segmented into 0-20 µm, 20-30 µm, 30-50 µm, Above 50 µm, Others. 20-30 µm holds the leading position because this diameter range balances fine-pitch capability, mechanical strength, bond reliability and high-volume manufacturability across mainstream semiconductor packages. Commercial decisions therefore balance performance, qualification, lifecycle support and total system cost rather than relying on one headline specification. As deployment scales, repeatable manufacturing, application engineering and supplier support become increasingly important to customer confidence and ownership economics.
| Type | Function / role | Market position |
|---|---|---|
| 0-20 µm | Ultra-fine wire for tight-pitch IC and advanced package bonding. | High-growth premium segment but more difficult to draw and bond reliably. |
| 20-30 µm | Mainstream fine wire balancing pitch, strength and process stability. | Leading segment across high-volume semiconductor packaging. |
| 30-50 µm | Standard and heavier fine wire for conventional packages. | Stable demand in analog, power and mature semiconductor devices. |
| Above 50 µm | Heavy wire for high-current electronics and power modules. | Growing with EV and industrial power electronics. |
| Others | Coated, alloyed and ribbon variants. | Used where oxidation resistance, current capacity or bondability require specialized metallurgy. |
Commercial implications by type
Wire diameter directly affects loop control, current capacity, mechanical strength and bonding pitch, so no single size can serve every package. Ultra-fine wire enables dense I/O but becomes harder to draw, handle and bond consistently, while heavier copper is increasingly valuable in power modules where current and thermal cycling dominate. Coatings such as palladium improve oxidation resistance and stitch-bond stability, allowing suppliers to differentiate through metallurgy, surface quality and process window rather than competing only on copper purity or spool price.
Segment Analysis: By Application
By application, demand is segmented into Semiconductor Packaging, PCB Interconnects, Power Electronics, LED Packaging, Others. Semiconductor Packaging leads because wire bonding remains a high-volume interconnect method across analog, power, memory, sensors and many mature semiconductor packages. Commercial decisions therefore balance performance, qualification, lifecycle support and total system cost rather than relying on one headline specification. As deployment scales, repeatable manufacturing, application engineering and supplier support become increasingly important to customer confidence and ownership economics. This combination is shaping product roadmaps, procurement priorities and investment decisions across both established customers and newer application segments.
| Application | Demand characteristics |
|---|---|
| Semiconductor Packaging | Largest application across analog, memory, sensors, power devices and mature-node ICs. |
| PCB Interconnects | Specialty fine wire and jumper applications supplement etched copper traces. |
| Power Electronics | Heavy copper wires and ribbons carry high current in EV, industrial and renewable-energy modules. |
| LED Packaging | Copper wire provides cost-effective conductive connections in high-volume optoelectronics. |
| Others | Medical, aerospace and specialized electronic assemblies create qualified niche demand. |
By End User
| End User | Commercial relevance |
|---|---|
| Consumer Electronics | Largest high-volume buyer through smartphones, PCs, wearables and appliances. |
| Automotive Electronics | Fast-growing through EVs, ADAS, body electronics and power modules. |
| Industrial Electronics | Drives, automation and power conversion require reliable copper interconnects. |
| Medical Devices | Qualification and corrosion control matter in long-life electronics. |
By Wire Surface
| Wire Surface | Commercial relevance |
|---|---|
| Bare Copper | Lowest material cost where protective bonding atmosphere and storage control are available. |
| Palladium-Coated Copper | Improves oxidation resistance and second-bond performance. |
| Alloyed / Specialty Copper | Optimizes hardness, thermal cycling or package-specific metallurgy. |
By Bonding Method
| Bonding Method | Commercial relevance |
|---|---|
| Ball-Wedge | Mainstream IC packaging uses copper free-air balls and stitch bonds. |
| Wedge-Wedge | Fine and heavy wire bonding serves power and specialized modules. |
| Ribbon Bonding | Copper ribbon reduces inductance and improves current capacity in power electronics. |
Regional Analysis
Asia Pacific leads the market because China, Japan, South Korea and Taiwan combine the world’s largest semiconductor packaging, consumer-electronics and automotive-electronics manufacturing base. Asia Pacific has the strongest growth profile as demand expands through new semiconductor assembly capacity, EV electronics and advanced packaging investment are expanding across China, India and Southeast Asia. Commercial decisions therefore balance performance, qualification, lifecycle support and total system cost rather than relying on one headline specification. As deployment scales, repeatable manufacturing, application engineering and supplier support become increasingly important to customer confidence and ownership economics.
How does regional demand differ across this market?
Asia Pacific dominates demand because most semiconductor assembly, consumer electronics and wire-bonding production is concentrated in the region. North America and Europe remain high-value markets for automotive, aerospace, medical and power electronics, while South America and the Middle East & Africa are more import-dependent. The regional picture is influenced by both semiconductor packaging and upstream copper economics: fine wire is manufactured from tightly controlled electronic-grade material, yet global refined-copper pricing and availability still influence working capital, inventory strategy and customer contract pricing.
| Region | Position | Growth outlook | Demand profile | Supplier selection |
|---|---|---|---|---|
| Asia Pacific | Largest | Fastest | Semiconductor packaging and electronics | Cost, fine-wire quality, local supply |
| North America | Second | Moderate | High-value semiconductor and power electronics | Reliability, supply security, price stability |
| Europe | Third | Strong | Automotive and industrial power | Qualification, reliability, metallurgy |
| South America | Smaller | Moderate | Electronics assembly and automotive | Cost and import availability |
| Middle East & Africa | Emerging | Selective | Industrial and downstream electronics | Availability, cost, technical support |
Competitive Landscape
Competition is led by materials companies with strong metallurgy, precision wire drawing, surface treatment and application-engineering support for high-speed bonding processes. Commercial decisions therefore balance performance, qualification, lifecycle support and total system cost rather than relying on one headline specification. As deployment scales, repeatable manufacturing, application engineering and supplier support become increasingly important to customer confidence and ownership economics. This combination is shaping product roadmaps, procurement priorities and investment decisions across both established customers and newer application segments.
Heraeus and TANAKA are prominent technology leaders because both span fine copper bonding and high-current power-device interconnects. Heraeus offers bare and coated copper down to 15 micrometers and heavy PowerCu wire for EV, SiC and GaN power systems, while TANAKA supplies ultra-fine oxygen-free copper, palladium-coated copper and heavy CP-1 power wire. Their product ranges illustrate how competition is segmented between cost-sensitive high-volume IC packaging and premium automotive or power modules requiring stronger thermal-cycle and current-carrying performance.
Palladium-coated copper is an important competitive technology because bare copper oxidizes and can create second-bond or storage challenges. A thin palladium layer improves surface stability while preserving most of copper’s raw-material cost advantage, allowing manufacturers to expand the bonding process window and reliability. Suppliers differentiate through coating uniformity, wire hardness, elongation, free-air-ball behavior and spool consistency, all of which affect bonder throughput and package yield more directly than nominal copper purity alone in high-volume manufacturing.
Advanced packaging is both an opportunity and a threat. Wire bonding remains economical for analog, power, memory and many mature packages, but copper pillars, redistribution layers and hybrid bonding displace wire in the highest-density logic products. Suppliers are responding by moving toward ultra-fine pitches, vertical-wire applications, ribbons and thick power interconnects where wire continues to offer manufacturing flexibility and low cost. The market therefore grows with electronics output while its application mix gradually shifts toward power, automotive and qualified mature-package segments.
| Competitive group | Representative participants | Competitive focus |
|---|---|---|
| Global bonding-material leaders | Heraeus, TANAKA | Fine copper, coated copper and power-wire portfolios |
| Asian semiconductor-wire specialists | Sumitomo Metal Mining, MK Electron and others | High-volume packaging wire and regional OSAT relationships |
| Power-interconnect specialists | Heraeus, TANAKA and module-material suppliers | Heavy wire and ribbons for EV, SiC and industrial power |
Companies Profiled
The companies profiled include Heraeus Electronics, TANAKA Electronics, Sumitomo Metal Mining, MK Electron, AMETEK / specialty wire suppliers. They span materials, semiconductor design, component manufacturing, packaging or system integration depending on the market. Competitive positions differ by technology depth, manufacturing scale, customer qualification and geographic reach, so the strongest suppliers combine differentiated engineering with repeatable volume production, application support and long-term product availability. Commercial decisions therefore balance performance, qualification, lifecycle support and total system cost rather than relying on one headline specification.
Production Capacity Analysis
Production requires electronic-grade copper feedstock, precision wire drawing, annealing, coating, spool winding, surface inspection and application-specific reliability testing across diameters from ultra-fine wire to heavy power products. Commercial decisions therefore balance performance, qualification, lifecycle support and total system cost rather than relying on one headline specification. As deployment scales, repeatable manufacturing, application engineering and supplier support become increasingly important to customer confidence and ownership economics. This combination is shaping product roadmaps, procurement priorities and investment decisions across both established customers and newer application segments.
Fine copper bonding wire is manufactured through repeated drawing and annealing steps that reduce diameter while controlling grain structure, tensile strength and elongation. At 15–30 micrometers, very small dimensional variation can alter free-air-ball formation, loop stability and breakage, so inline inspection and precise spool handling are critical. Palladium-coated products add another process step that must maintain uniform surface chemistry without making the wire too hard for bond-pad metallurgy, increasing equipment and process-control requirements compared with commodity copper wire.
Heavy copper wire and ribbon require different equipment and customer qualification because the target is high current rather than ultra-fine pitch. TANAKA’s CP-1 range extends to 500 micrometers, while Heraeus supplies thick copper wire and ribbon for EV, SiC, GaN and industrial power modules. These products need controlled softness, low resistance and strong ultrasonic bondability on thick metallization, and they are often qualified through extensive thermal cycling because interconnect fatigue can determine the lifetime of a high-value power module.
Market Dynamics
The market is balancing continued gold-to-copper substitution and EV growth against the gradual migration of leading-edge packages toward bump, pillar and hybrid-bonded interconnects. Commercial decisions therefore balance performance, qualification, lifecycle support and total system cost rather than relying on one headline specification. As deployment scales, repeatable manufacturing, application engineering and supplier support become increasingly important to customer confidence and ownership economics. This combination is shaping product roadmaps, procurement priorities and investment decisions across both established customers and newer application segments.
Copper bonding wire retains a broad cost and manufacturing advantage across mature semiconductors, analog, sensors, LEDs and power applications, so it remains resilient even as the most advanced logic packages move away from wire bonding. The value mix is shifting toward coated fine wire and heavy power interconnects, both of which require more materials engineering than commodity bare wire. Copper-price volatility adds another layer because suppliers must manage raw-material inventory while customers expect stable pricing, long qualifications and reliable continuity of supply.
Market Drivers
Drivers Impact Analysis
| Driver | Impact | Commercial mechanism |
|---|---|---|
| Gold-to-copper substitution | High | Copper has much lower raw-material cost than gold while providing excellent electrical and thermal conductivity, creating a durable economic incentive for semiconductor manufacturers to qualify it. Heraeus and TANAKA both position copper and coated copper as cost-effective alternatives to gold, with product families designed to address oxidation and bondability. Once an OSAT or IDM has qualified the wire, high package volumes can create substantial recurring savings, making substitution one of the most persistent long-term drivers in mainstream semiconductor assembly. |
| Semiconductor packaging volume | High | Wire bonding remains one of the highest-volume semiconductor interconnect methods, particularly for analog, power, sensors, discrete devices and many memory packages. Every increase in packaged-unit output creates direct consumption of fine bonding wire, even when leading-edge CPUs and GPUs use flip-chip or hybrid-bonded architectures. Growth in automotive, industrial, IoT and power semiconductors therefore supports copper-wire demand even if the application mix shifts away from conventional consumer ICs and toward longer-lifecycle or higher-reliability device categories. |
| EV and power electronics | High | Electric vehicles, renewable-energy inverters and industrial drives require power modules that can use thick copper wire or ribbon for lower resistance and strong thermal performance. Heraeus positions PowerCu products for SiC, GaN, drivetrain and renewable-energy systems, while TANAKA offers thick copper for power devices and batteries. As wide-bandgap semiconductors raise switching frequency and power density, robust copper interconnects become more valuable because package resistance and thermal cycling increasingly affect module efficiency, reliability and achievable current density. |
| Miniaturization | Medium | Shrinking package pitch creates demand for finer wire that can connect dense bond-pad layouts without shorting or excessive loop height. Heraeus and TANAKA offer commercial copper wire at very small diameters, demonstrating that fine-pitch use is technically viable. Smaller diameter raises breakage and process-control risk, so suppliers that provide optimized metallurgy, coatings, capillary guidance and application support can capture premium value even while the total copper mass per package declines with each generation of smaller electronic devices. |
Gold-to-copper substitution
Copper has much lower raw-material cost than gold while providing excellent electrical and thermal conductivity, creating a durable economic incentive for semiconductor manufacturers to qualify it. Heraeus and TANAKA both position copper and coated copper as cost-effective alternatives to gold, with product families designed to address oxidation and bondability. Once an OSAT or IDM has qualified the wire, high package volumes can create substantial recurring savings, making substitution one of the most persistent long-term drivers in mainstream semiconductor assembly.
Semiconductor packaging volume
Wire bonding remains one of the highest-volume semiconductor interconnect methods, particularly for analog, power, sensors, discrete devices and many memory packages. Every increase in packaged-unit output creates direct consumption of fine bonding wire, even when leading-edge CPUs and GPUs use flip-chip or hybrid-bonded architectures. Growth in automotive, industrial, IoT and power semiconductors therefore supports copper-wire demand even if the application mix shifts away from conventional consumer ICs and toward longer-lifecycle or higher-reliability device categories. Commercial decisions therefore balance performance, qualification, lifecycle support and total system cost rather than relying on one headline specification.
EV and power electronics
Electric vehicles, renewable-energy inverters and industrial drives require power modules that can use thick copper wire or ribbon for lower resistance and strong thermal performance. Heraeus positions PowerCu products for SiC, GaN, drivetrain and renewable-energy systems, while TANAKA offers thick copper for power devices and batteries. As wide-bandgap semiconductors raise switching frequency and power density, robust copper interconnects become more valuable because package resistance and thermal cycling increasingly affect module efficiency, reliability and achievable current density.
Miniaturization
Shrinking package pitch creates demand for finer wire that can connect dense bond-pad layouts without shorting or excessive loop height. Heraeus and TANAKA offer commercial copper wire at very small diameters, demonstrating that fine-pitch use is technically viable. Smaller diameter raises breakage and process-control risk, so suppliers that provide optimized metallurgy, coatings, capillary guidance and application support can capture premium value even while the total copper mass per package declines with each generation of smaller electronic devices.
Market Restraints
Restraints Impact Analysis
| Restraint | Impact | Commercial mechanism |
|---|---|---|
| Copper price volatility | High | Electronic wire uses only a small fraction of global copper production, but suppliers still purchase refined metal in a commodity market where price and availability can change quickly. USGS reported a high projected U.S. copper price for 2025 and identified supply and production developments affecting the market. Wire manufacturers must therefore manage working capital, inventory and customer price agreements while maintaining the purity and traceability required for semiconductor use, making raw-material volatility a persistent commercial challenge. |
| Oxidation and bondability | High | Copper oxidizes more readily than gold, so bare wire often requires controlled atmosphere, storage and bonding conditions. Palladium coatings and optimized alloys improve surface stability, but they add process cost and can change wire hardness or bonding behavior. Package manufacturers need to qualify capillary design, forming-gas conditions, pad metallurgy and molding compounds together, making a wire-material change more complex than a simple commodity substitution and raising the value of supplier process support during production ramps. |
| Advanced-package substitution | Medium | The highest-density logic and memory packages increasingly use copper pillars, redistribution layers, TSVs and hybrid bonding to achieve shorter interconnects than wire loops can provide. This reduces the long-term addressable share of conventional wire in flagship processors and advanced 3D integration. Bonding-wire suppliers are offsetting the pressure by focusing on analog, power, sensors, automotive and heavy-wire applications where wire remains economical and where direct die-to-substrate interconnect technologies are less compelling or unnecessarily expensive. |
| Precision manufacturing burden | Medium | Ultra-fine electronic wire requires tight diameter, surface and mechanical-property control across very long spool lengths. Small deviations can create wire breaks, unstable free-air balls, weak second bonds or bonder stoppage, directly affecting OSAT throughput and package yield. Achieving these tolerances requires specialized drawing dies, annealing, coating and metrology, so new entrants face a larger process-know-how barrier than the apparent simplicity of a copper wire product might suggest, especially below conventional fine-wire diameters. |
Copper price volatility
Electronic wire uses only a small fraction of global copper production, but suppliers still purchase refined metal in a commodity market where price and availability can change quickly. USGS reported a high projected U.S. copper price for 2025 and identified supply and production developments affecting the market. Wire manufacturers must therefore manage working capital, inventory and customer price agreements while maintaining the purity and traceability required for semiconductor use, making raw-material volatility a persistent commercial challenge.
Oxidation and bondability
Copper oxidizes more readily than gold, so bare wire often requires controlled atmosphere, storage and bonding conditions. Palladium coatings and optimized alloys improve surface stability, but they add process cost and can change wire hardness or bonding behavior. Package manufacturers need to qualify capillary design, forming-gas conditions, pad metallurgy and molding compounds together, making a wire-material change more complex than a simple commodity substitution and raising the value of supplier process support during production ramps.
Advanced-package substitution
The highest-density logic and memory packages increasingly use copper pillars, redistribution layers, TSVs and hybrid bonding to achieve shorter interconnects than wire loops can provide. This reduces the long-term addressable share of conventional wire in flagship processors and advanced 3D integration. Bonding-wire suppliers are offsetting the pressure by focusing on analog, power, sensors, automotive and heavy-wire applications where wire remains economical and where direct die-to-substrate interconnect technologies are less compelling or unnecessarily expensive. Commercial decisions therefore balance performance, qualification, lifecycle support and total system cost rather than relying on one headline specification.
Precision manufacturing burden
Ultra-fine electronic wire requires tight diameter, surface and mechanical-property control across very long spool lengths. Small deviations can create wire breaks, unstable free-air balls, weak second bonds or bonder stoppage, directly affecting OSAT throughput and package yield. Achieving these tolerances requires specialized drawing dies, annealing, coating and metrology, so new entrants face a larger process-know-how barrier than the apparent simplicity of a copper wire product might suggest, especially below conventional fine-wire diameters. Commercial decisions therefore balance performance, qualification, lifecycle support and total system cost rather than relying on one headline specification.
Market Opportunities
Palladium-coated copper
Coated copper addresses a primary weakness of bare copper by improving oxidation resistance and second-bond stability while retaining a large cost advantage over gold. As OSATs move to finer pitches and longer storage or logistics chains, surface stability becomes more important. Suppliers that control palladium thickness, copper hardness and free-air-ball behavior can expand into high-reliability automotive and consumer packages that might otherwise remain on more expensive gold or silver-based alternatives, supporting premium product mix within a cost-sensitive market.
EV power modules
Electric drivetrains, onboard chargers and renewable-energy converters use power modules that must carry high current through repeated thermal cycles. Thick copper wires and ribbons offer low resistance and strong heat conduction, making them attractive for SiC and GaN modules operating at higher junction temperature and switching frequency. This segment can grow faster than conventional fine bonding because the copper mass and value per module are higher, and reliability requirements support premium materials, process development and application engineering rather than commodity pricing alone.
Ultra-fine bonding
Smartphones, sensors and compact packages continue to reduce bond-pad pitch, creating demand for copper wire below 20 micrometers with stable loop control and low breakage. Commercial products at 15 micrometers show that the technology is viable, but yield sensitivity remains high. Suppliers that combine fine drawing with coatings and process-development support can capture share as more packages seek gold-like fine-pitch capability at copper-like material cost, especially in high-volume products where small per-package savings become substantial annual value.
Regional packaging expansion
New semiconductor assembly and test investment in India, Southeast Asia and North America creates an opportunity for bonding-wire suppliers to establish local technical service, inventory and qualification support. Wire bonding is often among the first package technologies used by expanding OSAT ecosystems because it is flexible and capital-efficient. Being qualified early with a new packaging site can create long recurring revenue because changing bond wire later requires process revalidation, customer approval and reliability testing that manufacturers generally prefer to avoid.
Supply Chain Analysis
High-purity refined copper and alloy additions
Drawing, annealing, coating and spooling
Capillaries, forming gas and ultrasonic bonding
OSAT, IDM, automotive and power-module assembly
Copper feedstock
Electronic bonding wire starts with high-purity copper because trace impurities affect electrical resistance, grain growth and bond behavior. USGS data show that global refined copper production is large relative to electronic-wire demand, but mining, refining and price changes still affect procurement. Manufacturers must convert commodity-scale metal into tightly specified semiconductor-grade feedstock with controlled chemistry, so upstream traceability and quality agreements remain important even though the final wire diameter is extremely small and the material mass per package is low.
Wire manufacturing
Precision drawing reduces copper to fine diameters while annealing controls hardness and elongation for stable looping and bonding. Coated products add palladium or other surface layers, and every stage must avoid scratches or contamination that could initiate wire breaks. Manufacturers also control spool tension and cleanliness because high-speed automatic bonders can consume long wire lengths continuously, making consistency over the entire spool a direct productivity requirement for semiconductor assembly customers and a meaningful supplier-quality differentiator.
Bonding process
Copper wire requires optimized capillaries, ultrasonic energy, bond force and often protective gas to form consistent balls and stitch bonds without damaging pads. The harder wire can increase stress on fragile aluminum metallization or low-k structures if the process window is poorly tuned. Materials suppliers therefore work closely with bonder and capillary companies because the commercial value of the wire depends on a stable assembly process, not only laboratory mechanical properties or nominal electrical conductivity.
Electronics packaging
OSATs and IDMs qualify bonding wire together with die pad, leadframe, mold compound and reliability conditions for each package family. Automotive and power modules demand especially long thermal-cycle and high-temperature tests, while consumer packages emphasize throughput and cost. Once qualified, a wire product can remain in production for years, creating sticky customer relationships but also making new-product adoption slower because any material change can trigger extensive revalidation and end-customer approval. Commercial decisions therefore balance performance, qualification, lifecycle support and total system cost rather than relying on one headline specification.
Recent Developments
2026 — USGS reports current copper supply and pricing context
The 2026 Mineral Commodity Summary provides current copper price, production and refining context relevant to electronic-wire raw-material economics. Source
Current — Heraeus supplies fine copper and coated copper bonding wire
Current products extend to 15 micrometer diameter and address consumer, automotive, communications and energy applications. Source
Current — TANAKA supports heavy copper wire for power devices
The CP-1 portfolio spans 200–500 micrometer copper wire for high-current power-device and battery connections. Source
Report Scope & Segmentation
| Attribute | Coverage |
|---|---|
| Market | Electronic Copper Wire |
| Base Year | 2025 |
| Estimated Year | 2026 |
| Forecast Period | 2026–2034 |
| 2025 Market Size | USD 13.323 billion |
| 2026 Estimated Size | USD 14.010 billion |
| 2034 Forecast Size | USD 20.943 billion |
| CAGR | 5.2% (2026–2034) |
| By Type | 0-20 µm, 20-30 µm, 30-50 µm, Above 50 µm, Others |
| By Application | Semiconductor Packaging, PCB Interconnects, Power Electronics, LED Packaging, Others |
| By End User | Consumer Electronics, Automotive Electronics, Industrial Electronics, Medical Devices |
| By Wire Surface | Bare Copper, Palladium-Coated Copper, Alloyed / Specialty Copper |
| By Bonding Method | Ball-Wedge, Wedge-Wedge, Ribbon Bonding |
| Regions | Asia Pacific, North America, Europe, South America, Middle East & Africa |
| Companies Profiled | Heraeus Electronics, TANAKA Electronics, Sumitomo Metal Mining, MK Electron, AMETEK / specialty wire suppliers |
Frequently Asked Questions
What is the electronic copper wire market size in 2025?
The market is valued at USD 13.323 billion in 2025.
What is the projected market size by 2034?
The market is projected to reach USD 20.943 billion by 2034.
What is the CAGR from 2026 to 2034?
The market is expected to expand at a 5.2% CAGR.
Which region leads the market?
Asia Pacific is the largest regional market in 2025.
Which type leads the market?
20-30 µm is the leading type.
Which application leads demand?
Semiconductor Packaging is the leading application.
What is the primary growth driver?
semiconductor packaging, EV power electronics and substitution away from expensive gold bonding wire continue to expand copper use.
What is the principal restraint?
copper oxidation, bonding hardness, raw-material price volatility and advanced-package substitution can limit wire-bonding growth.
Where are the strongest opportunities?
palladium-coated copper, ultra-fine wire, EV power-module copper and high-reliability heavy-wire interconnects.
Which companies are active in the market?
Heraeus Electronics, TANAKA Electronics, Sumitomo Metal Mining, MK Electron, AMETEK / specialty wire suppliers.
Research Sources & Evidence Base
View primary and authoritative evidence used in this overview
- Heraeus Electronics: Copper and Coated Copper Fine Bonding Wires — Fine copper diameter, reliability and application coverage.
- Heraeus Electronics: Copper Power Bonding Wires — Heavy copper wire for EV, SiC, GaN and power modules.
- TANAKA: Bonding Wires — Copper, coated copper and power-device bonding portfolio.
- TANAKA: Copper Bonding Wire for Power Devices — Heavy copper wire sizes and power-device applications.
- U.S. Geological Survey: Copper Statistics and Information — Copper properties, supply and major end-use context.
- U.S. Geological Survey: Mineral Commodity Summaries 2026 — Copper — 2025 price, production, refining and supply-chain evidence.

Get Sample Report PDF for Exclusive Insights
Report Sample Includes
- Table of Contents
- List of Tables & Figures
- Charts, Research Methodology, and more...