MARKET INSIGHTS
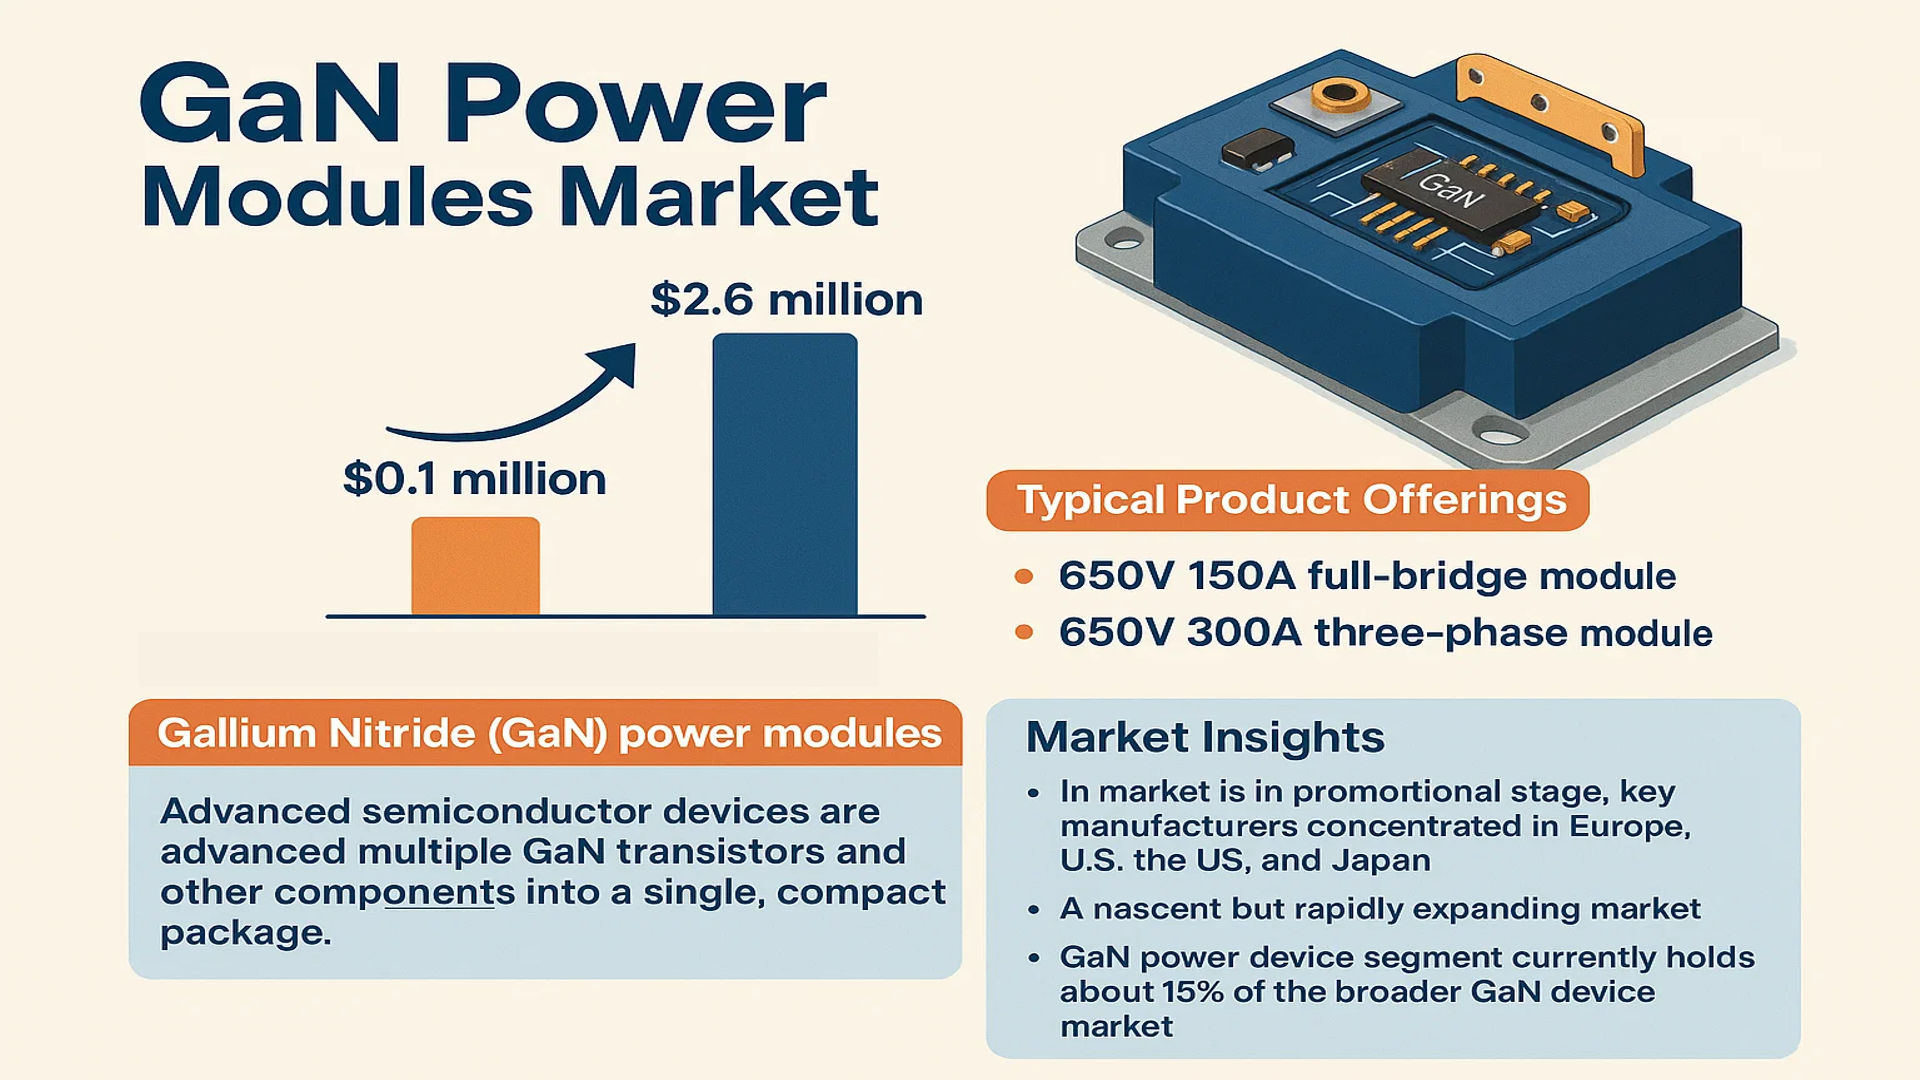
The global GaN Power Modules Market was valued at 0.1 million in 2024 and is projected to reach US$ 2.6 million by 2032, at a CAGR of 38.8% during the forecast period.
Gallium Nitride (GaN) power modules are advanced semiconductor devices that integrate multiple GaN transistors and other components into a single, compact package. These modules are engineered to handle high power levels efficiently, offering superior performance in switching speed, thermal management, and power density compared to traditional silicon-based solutions. Typical product offerings include full-bridge modules, such as the 650V 150A module, and three-phase modules, like the 650V 300A variant, which are primarily used to convert and control electrical power in high-frequency applications.
The market is currently in a promotional stage, with key manufacturers concentrated in Europe, the United States, and Japan. This nascent but rapidly expanding market is being propelled by the overarching growth of the GaN power device segment, which currently holds about 15% of the broader GaN device market. Growth is further driven by the relentless pursuit of energy efficiency across industries and the accelerating adoption of electric vehicles, which require advanced power electronics. Leading companies such as Infineon (GaN Systems), Texas Instruments, and Efficient Power Conversion Corporation (EPC) are actively developing and commercializing these modules to capture opportunities in motor drives, solar inverters, and server power supplies.
MARKET DYNAMICS
MARKET DRIVERS
Rising Demand for Energy-Efficient Power Solutions to Accelerate GaN Power Modules Adoption
The global push for energy efficiency is significantly driving the adoption of Gallium Nitride (GaN) power modules. These modules offer superior performance compared to traditional silicon-based solutions, with switching frequencies up to ten times higher and energy losses reduced by nearly 50%. The increasing emphasis on reducing carbon footprints across industries has created substantial demand for high-efficiency power conversion systems. GaN power modules enable more compact designs with higher power density, making them ideal for applications where space and efficiency are critical. The consumer electronics sector alone is projected to require 30% more efficient power adapters by 2026, creating immediate market opportunities for GaN technology.
Expansion of Electric Vehicle Infrastructure to Fuel Market Growth
The rapid global expansion of electric vehicle infrastructure represents a major growth driver for GaN power modules. Electric vehicle charging stations require high-power, high-efficiency converters that can operate at elevated temperatures with minimal energy loss. GaN power modules demonstrate up to 99% efficiency in power conversion applications, significantly outperforming silicon-based alternatives. With the global electric vehicle market projected to grow at a compound annual growth rate exceeding 25% through 2030, the demand for efficient charging infrastructure is creating substantial opportunities. Major automotive manufacturers are increasingly incorporating GaN technology into onboard chargers and DC-DC converters, driving market expansion.
5G Infrastructure Deployment to Drive High-Frequency Power Demands
The global rollout of 5G networks is creating unprecedented demand for high-frequency power solutions where GaN power modules excel. 5G base stations require power amplifiers that operate efficiently at millimeter-wave frequencies, a domain where GaN technology demonstrates clear advantages over silicon. The power density requirements for 5G infrastructure are approximately three times higher than previous generations, necessitating more efficient thermal management and power delivery systems. With over 70% of mobile network operators worldwide planning substantial 5G deployments through 2027, the addressable market for GaN power modules in telecommunications infrastructure continues to expand rapidly.
MARKET CHALLENGES
High Initial Production Costs and Manufacturing Complexities to Challenge Market Penetration
Despite the superior performance characteristics, GaN power modules face significant challenges related to production costs and manufacturing complexities. The fabrication of GaN semiconductors requires specialized equipment and processes that are more expensive than traditional silicon manufacturing. Current production yields for high-quality GaN wafers remain approximately 20-30% lower than established silicon processes, contributing to higher per-unit costs. The need for specialized packaging materials capable of handling higher operating temperatures and power densities adds approximately 35% to the overall module cost compared to silicon alternatives.
Other Challenges
Thermal Management Requirements
The high power density of GaN modules creates thermal management challenges that require advanced cooling solutions. Operating temperatures can reach 200°C, necessitating sophisticated heat dissipation systems that add complexity and cost to end applications. The thermal interface materials and cooling systems required for optimal performance can increase the total system cost by up to 40%, presenting adoption barriers in cost-sensitive markets.
Supply Chain Constraints
The GaN power module market faces supply chain challenges related to specialized substrate availability and manufacturing capacity. High-quality GaN substrates remain relatively scarce, with global production capacity meeting only approximately 60% of current demand. The specialized equipment required for GaN fabrication has lead times extending beyond 12 months, creating bottlenecks in production scaling and potentially limiting market growth in the near term.
MARKET RESTRAINTS
Technical Standardization and Compatibility Issues to Hinder Widespread Adoption
The lack of industry-wide technical standards presents significant restraints for GaN power module market growth. Unlike mature silicon power devices that benefit from decades of standardization, GaN modules face compatibility challenges with existing system architectures. Many power system designers require extensive redesign of control circuits and gate drivers when transitioning from silicon to GaN technology. The absence of standardized packaging formats creates interoperability issues, with different manufacturers utilizing proprietary pin configurations and form factors that limit component interchangeability.
Reliability Concerns and Limited Field Data to Slow Market Acceptance
Market adoption is restrained by concerns regarding long-term reliability and limited field performance data. While laboratory tests show excellent performance characteristics, the relatively recent commercial introduction of GaN power modules means that long-term reliability data spanning 10-15 years of operation is not yet available. This data gap creates hesitation among conservative industries such as automotive and industrial manufacturing, where product lifetimes often exceed 15 years. The potential failure modes under extreme operating conditions remain incompletely characterized, leading to design conservatism and slower adoption rates in critical applications.
Intellectual Property Barriers and Patent Constraints to Limit Market Competition
The GaN power module market faces restraints from intellectual property concentrations and patent barriers that limit competitive dynamics. Key technological innovations are protected by extensive patent portfolios held by a limited number of companies, creating entry barriers for new market participants. The licensing requirements for fundamental GaN fabrication techniques can add 15-20% to production costs for new entrants. This intellectual property landscape potentially slows innovation pace and maintains higher price points than would exist in a more competitive environment.
MARKET OPPORTUNITIES
Renewable Energy Integration to Create Substantial Growth Opportunities
The global transition toward renewable energy systems presents significant opportunities for GaN power modules. Solar inverters and wind power converters require high-efficiency power conversion at increasingly higher voltages and power levels. GaN technology enables solar inverter efficiencies exceeding 99%, compared to 97-98% for silicon-based solutions, representing meaningful energy savings in large-scale installations. The growing adoption of microinverters and power optimizers in residential solar installations creates additional market opportunities where the size and efficiency advantages of GaN modules provide competitive benefits.
Data Center Power Infrastructure Modernization to Drive Demand
The ongoing modernization of data center power infrastructure represents a substantial growth opportunity for GaN power modules. Data centers increasingly require more efficient power distribution systems to manage escalating energy costs and sustainability targets. GaN-based power supplies demonstrate 2-3% higher efficiency in server power units and uninterruptible power supplies, translating to significant energy savings at scale. With global data center electricity consumption projected to increase by 50% over the next five years, the demand for more efficient power conversion technology creates a substantial addressable market for GaN modules.
Industrial Automation and Motor Drive Applications to Expand Market Reach
The increasing automation of industrial processes creates expanding opportunities for GaN power modules in motor drive applications. Industrial motor drives require high switching frequencies for precise control, a domain where GaN technology offers clear advantages. The ability to operate at higher temperatures without derating makes GaN modules suitable for harsh industrial environments. The trend toward more compact motor drives with integrated intelligence creates design opportunities where the size and performance benefits of GaN technology align perfectly with market requirements.
GAN POWER MODULES MARKET TRENDS
Accelerated Adoption in Electric Vehicle Powertrains to Emerge as a Dominant Trend
The global GaN power modules market is witnessing a transformative shift driven by the rapid electrification of the automotive sector. GaN (Gallium Nitride) technology offers superior performance over traditional silicon-based solutions, including higher switching frequencies, reduced switching losses, and higher temperature operation, which are critical for electric vehicle (EV) powertrains. This has led to a surge in demand from EV manufacturers seeking to improve efficiency and reduce the size and weight of onboard chargers (OBCs) and DC-DC converters. The market is projected to grow from approximately 0.1 million in 2024 to over 2.6 million by 2032, representing a staggering compound annual growth rate (CAGR) of 38.8%. This explosive growth is largely fueled by the need for more efficient power conversion systems in next-generation electric vehicles, where even a single percentage point gain in efficiency can significantly extend driving range.
Other Trends
Expansion into Renewable Energy Infrastructure
Beyond automotive applications, GaN power modules are gaining significant traction in renewable energy infrastructure, particularly in solar inverters. The high-frequency capability of GaN allows for the design of smaller, lighter, and more efficient inverters, which is crucial for both residential and commercial solar installations. This trend is accelerating as the global push for decarbonization intensifies, with investments in solar capacity growing annually. The superior thermal performance of GaN also enables more robust systems capable of operating in harsh environments, further solidifying its position as a key enabling technology for the green energy transition.
Technological Miniaturization and Integration Driving Market Penetration
A pivotal trend shaping the GaN power modules market is the relentless drive towards higher power density and system integration. Manufacturers are developing advanced module packaging technologies that integrate multiple GaN dies, gate drivers, and protection circuits into a single, compact package. This level of integration simplifies design-in for engineers and reduces the overall system footprint, which is a critical factor for space-constrained applications like server power supplies, telecommunications equipment, and consumer electronics. While GaN power devices currently hold about 15% of the broader GaN device market, their growth rate far outpaces that of the more established GaN RF segment. This trend towards integrated modules, as opposed to discrete components, is a key indicator of the technology’s maturation and its readiness for mass adoption across industrial sectors.
COMPETITIVE LANDSCAPE
Key Industry Players
Companies Accelerate Innovation and Strategic Expansion to Capture High-Growth Opportunities
The global GaN Power Modules market exhibits a dynamic and evolving competitive structure, characterized by a mix of established semiconductor giants, specialized technology firms, and emerging innovators. While still in its early commercialization phase, the market is becoming increasingly competitive as companies recognize its substantial long-term potential across applications like electric vehicles, renewable energy, and data centers. The landscape is semi-consolidated, with a handful of leaders driving technological standards while numerous smaller players focus on niche applications and custom solutions.
Infineon Technologies AG (through its acquisition of GaN Systems) has established itself as a dominant force. This leadership is largely due to its comprehensive product portfolio, including high-performance 650V full-bridge and 3-phase modules, and its extensive global manufacturing and distribution network. The company’s deep expertise in power semiconductors and significant R&D investments, which totaled approximately €1.73 billion in its 2023 fiscal year, solidify its market position and enable continuous innovation.
Similarly, Texas Instruments and Efficient Power Conversion Corporation (EPC) hold significant market shares. Their growth is propelled by a strong focus on integrated module solutions that offer higher power density and efficiency, which are critical for space-constrained applications like onboard chargers in EVs and server power supplies. Both companies have been aggressive in ramping up production capacity to meet the anticipated surge in demand.
Furthermore, these leading players are actively pursuing growth through strategic initiatives. This includes geographical expansion into high-growth regions like Asia-Pacific, forging partnerships with automotive OEMs and industrial equipment manufacturers, and a consistent pipeline of new product launches. For instance, the development of modules tailored for specific voltage and current requirements in solar inverters and motor drives is a key focus area, aiming to provide optimized solutions rather than generic components.
Meanwhile, other crucial participants like Navitas Semiconductor and Mitsubishi Electric (operating through Vincotech) are strengthening their market presence through significant investments in research and development and the creation of strategic alliances. Companies are also focusing on vertical integration and securing robust supply chains for gallium nitride substrates to mitigate production bottlenecks and ensure scalability, which is vital for transitioning from niche to mass-market adoption.
List of Key GaN Power Modules Companies Profiled
- Infineon Technologies AG (GaN Systems) (Germany)
- Texas Instruments Inc. (U.S.)
- Efficient Power Conversion Corporation (EPC) (U.S.)
- Kyocera AVX (Japan)
- Mitsubishi Electric (Vincotech) (Japan)
- Fujitsu General Electronics Limited (Japan)
- Navitas Semiconductor (U.S.)
- VisIC Technologies (Israel)
Segment Analysis:
By Type
GaN Half-Bridge Module Segment Leads Due to High Adoption in Motor Drives and Consumer Electronics
The market is segmented based on type into:
- GaN-Full Bridge Module
- GaN Half-Bridge Module
By Application
Electric Vehicles (EVs) Segment Exhibits Strong Growth Potential Driven by Global Electrification Trends
The market is segmented based on application into:
- Home Appliances/Consumer
- Servers/UPS
- Solar Inverters
- Motor Drives
- Electric Vehicles (EVs)
- HVAC
- Others
By Voltage Rating
650V Segment Dominates Market Share Owing to Wide Industrial and Automotive Applications
The market is segmented based on voltage rating into:
- 650V
- 900V
- 1200V
- Others
By Packaging Technology
Module Packaging Gains Traction for Enhanced Thermal Management and System Integration
The market is segmented based on packaging technology into:
- Discrete Packaging
- Module Packaging
Regional Analysis: GaN Power Modules Market
Asia-Pacific
The Asia-Pacific region is the dominant force in the GaN power modules market, driven by its massive electronics manufacturing base and aggressive adoption of new energy technologies. China, as the world’s largest market for electric vehicles and consumer electronics, is a primary catalyst, with domestic giants like Innoscience leading global GaN power device production. Japan and South Korea contribute significantly through their technologically advanced semiconductor industries, with key players such as Fujitsu General Electronics and Kyocera AVX actively developing and commercializing modules. The region’s focus on motor drives, solar inverters, and consumer appliances fuels demand, though cost sensitivity remains a factor influencing the pace of adoption for some advanced applications.
North America
North America is a key innovation hub for GaN technology, characterized by strong R&D initiatives and early adoption in high-performance applications. The presence of leading companies like Texas Instruments and Efficient Power Conversion Corporation (EPC) underscores the region’s technological leadership. Demand is significantly driven by the data center and server/UPS sectors, where the need for energy efficiency is paramount, as well as by the growing electric vehicle infrastructure. Supportive government policies and investments in next-generation power electronics further accelerate market development, making North America a critical region for high-value, advanced GaN power modules.
Europe
Europe’s market is propelled by stringent energy efficiency regulations and a strong industrial focus on sustainability and green technology. The automotive sector, particularly electric vehicles (EVs) and associated charging infrastructure, is a major driver, with European OEMs integrating GaN modules for improved power density and thermal performance. Industrial applications, including motor drives and renewable energy systems like solar inverters, also present significant opportunities. Key European players, such as Infineon (through its acquisition of GaN Systems) and Vincotech (part of Mitsubishi Electric), are central to the region’s supply chain, ensuring a robust ecosystem for module development and deployment.
South America
The GaN power modules market in South America is in a nascent stage of development. Growth is primarily opportunistic and linked to specific industrial modernization projects and the gradual expansion of renewable energy installations, particularly in countries like Brazil and Argentina. However, economic volatility and limited local semiconductor manufacturing capabilities restrain widespread adoption. The market currently relies on imports, and cost remains a significant barrier for many potential end-users. While long-term potential exists in sectors like HVAC and motor drives, progress is expected to be measured and closely tied to regional economic stability and foreign investment.
Middle East & Africa
This region represents an emerging market with growth potential linked to infrastructure development and diversification away from traditional energy sources. Investments in data centers, telecommunications, and renewable energy projects in nations like Israel, Saudi Arabia, and the UAE are creating initial demand for efficient power solutions like GaN modules. However, the market is constrained by a lack of local manufacturing, leading to dependence on international suppliers, and by a focus on conventional, cost-effective technologies. The adoption of advanced GaN power modules is therefore gradual, with growth anticipated over the long term as infrastructure projects mature and energy efficiency becomes a higher priority.
Report Scope
This market research report provides a comprehensive analysis of the global GaN Power Modules market, covering the forecast period 2025–2032. It offers detailed insights into market dynamics, technological advancements, competitive landscape, and key trends shaping the industry.
Key focus areas of the report include:
- Market Size & Forecast: Historical data and future projections for revenue, unit shipments, and market value across major regions and segments.
- Segmentation Analysis: Detailed breakdown by product type, technology, application, and end-user industry to identify high-growth segments and investment opportunities.
- Regional Outlook: Insights into market performance across North America, Europe, Asia-Pacific, Latin America, and the Middle East & Africa, including country-level analysis where relevant.
- Competitive Landscape: Profiles of leading market participants, including their product offerings, R&D focus, manufacturing capacity, pricing strategies, and recent developments such as mergers, acquisitions, and partnerships.
- Technology Trends & Innovation: Assessment of emerging technologies, integration of AI/IoT, semiconductor design trends, fabrication techniques, and evolving industry standards.
- Market Drivers & Restraints: Evaluation of factors driving market growth along with challenges, supply chain constraints, regulatory issues, and market-entry barriers.
- Stakeholder Analysis: Insights for component suppliers, OEMs, system integrators, investors, and policymakers regarding the evolving ecosystem and strategic opportunities.
Primary and secondary research methods are employed, including interviews with industry experts, data from verified sources, and real-time market intelligence to ensure the accuracy and reliability of the insights presented.
FREQUENTLY ASKED QUESTIONS:
What is the current market size of Global GaN Power Modules Market?
-> GaN Power Modules Market was valued at 0.1 million in 2024 and is projected to reach US$ 2.6 million by 2032, at a CAGR of 38.8% during the forecast period by 2032.
Which key companies operate in Global GaN Power Modules Market?
-> Key players include Infineon (GaN Systems), Kyocera AVX, Mitsubishi Electric (Vincotech), Fujitsu General Electronics Limited, Sensitron Semiconductor, VisIC Technologies, NJSM Electronics, and X-IPM Technology, among others.
What are the key growth drivers?
-> Key growth drivers include demand for energy-efficient power electronics, expansion of electric vehicles, growth in renewable energy infrastructure, and increasing adoption in data centers and industrial motor drives.
Which region dominates the market?
-> Asia-Pacific is the fastest-growing region, while North America and Europe remain dominant markets due to strong semiconductor manufacturing and R&D presence.
What are the emerging trends?
-> Emerging trends include integration of GaN in automotive power systems, development of higher voltage modules, increased focus on thermal management solutions, and adoption in 5G infrastructure and aerospace applications.

Get Sample Report PDF for Exclusive Insights
Report Sample Includes
- Table of Contents
- List of Tables & Figures
- Charts, Research Methodology, and more...