GaN Bare-die Market Overview
Gallium nitride (GaN) transistors offer fundamental advantages over silicon. In particular, the higher critical electrical field makes it very attractive for power semiconductor devices with outstanding specific dynamic on-state resistance and smaller capacitances compared to silicon MOSFETs, which makes GaN HEMTs great for high speed switching applications. Gallium nitride transistors can then be operated with reduced dead-times which results in higher efficiency and enables passive cooling. Operation at high switching frequencies allows the volume of passive components to shrink which improves GaN HEMTs reliability and overall power density.
This report provides a deep insight into the global GaN Bare-die market covering all its essential aspects. This ranges from a macro overview of the market to micro details of the market size, competitive landscape, development trend, niche market, key market drivers and challenges, SWOT analysis, value chain analysis, etc.
The analysis helps the reader to shape the competition within the industries and strategies for the competitive environment to enhance the potential profit. Furthermore, it provides a simple framework for evaluating and accessing the position of the business organization. The report structure also focuses on the competitive landscape of the Global GaN Bare-die Market, this report introduces in detail the market share, market performance, product situation, operation situation, etc. of the main players, which helps the readers in the industry to identify the main competitors and deeply understand the competition pattern of the market.
In a word, this report is a must-read for industry players, investors, researchers, consultants, business strategists, and all those who have any kind of stake or are planning to foray into the GaN Bare-die market in any manner.
GaN Bare-die Market Analysis:
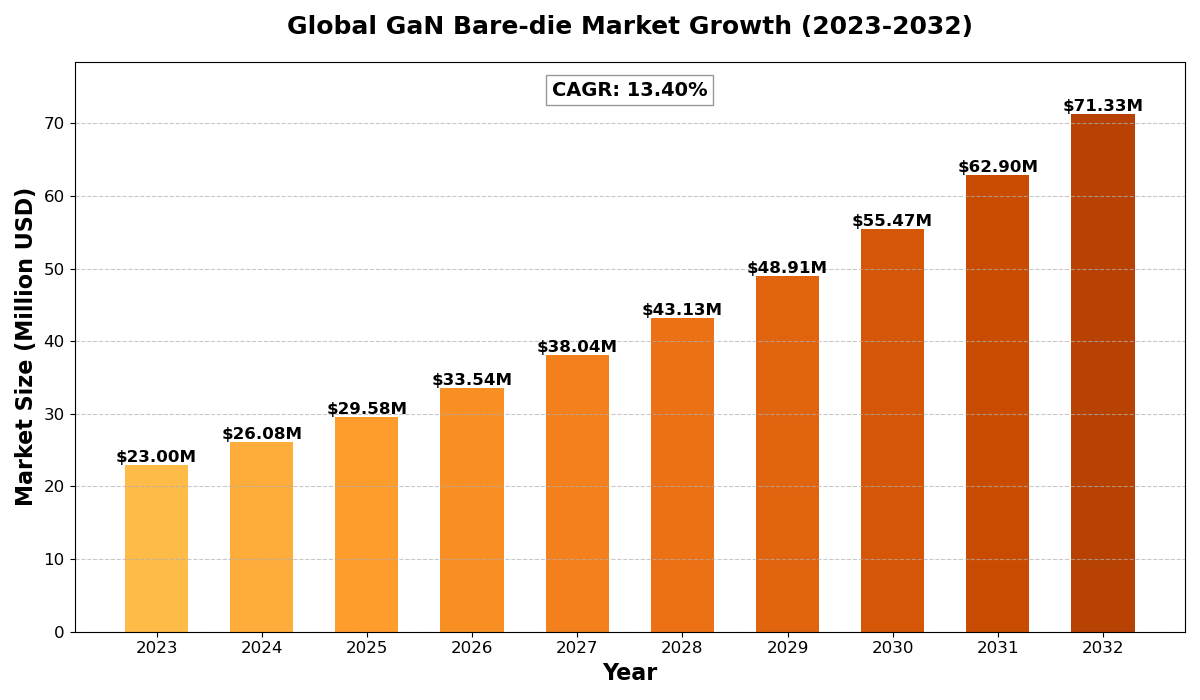
The global GaN Bare-die market size was estimated at USD 23 million in 2023 and is projected to reach USD 71.33 million by 2032, exhibiting a CAGR of 13.40% during the forecast period.
North America GaN Bare-die market size was estimated at USD 7.45 million in 2023, at a CAGR of 11.49% during the forecast period of 2025 through 2032.
GaN Bare-die Key Market Trends :
- Rising Demand for High-Efficiency Power Devices
The increasing need for energy-efficient power solutions is driving the adoption of GaN transistors due to their superior performance over silicon-based alternatives. - Growth in 5G and Telecom Infrastructure
GaN-based components are widely used in 5G base stations and advanced communication networks, boosting market demand. - Advancements in Radar and Satellite Communication
The expansion of military and commercial radar systems, along with satellite communication, is creating new opportunities for GaN Bare-die applications. - Expansion in the Automotive Sector
The rising adoption of electric vehicles (EVs) is fueling demand for GaN-based power electronics, improving efficiency and reducing energy loss. - Emergence of GaN-on-Si Technology
Technological advancements in GaN-on-Silicon (GaN-on-Si) manufacturing are making these semiconductors more cost-effective and accessible.
GaN Bare-die Market Regional Analysis :

North America:
Strong demand driven by EVs, 5G infrastructure, and renewable energy, with the U.S. leading the market.
Europe:
Growth fueled by automotive electrification, renewable energy, and strong regulatory support, with Germany as a key player.
Asia-Pacific:
Dominates the market due to large-scale manufacturing in China and Japan, with growing demand from EVs, 5G, and semiconductors.
South America:
Emerging market, driven by renewable energy and EV adoption, with Brazil leading growth.
Middle East & Africa:
Gradual growth, mainly due to investments in renewable energy and EV infrastructure, with Saudi Arabia and UAE as key contributors.
GaN Bare-die Market Segmentation :
The research report includes specific segments by region (country), manufacturers, Type, and Application. Market segmentation creates subsets of a market based on product type, end-user or application, Geographic, and other factors. By understanding the market segments, the decision-maker can leverage this targeting in the product, sales, and marketing strategies. Market segments can power your product development cycles by informing how you create product offerings for different segments.
Key Company
- Wolfspeed
- WAVEPIA Co.
- Ltd
- GeneSiC (Navitas Semiconductor)
- Macom
- EPC
- Microchip
- NewSemi Technology
- WAVICE
Market Segmentation (by Type)
- 8W
- 15W
- 35W
- 50W
- 60W
- 20W
- 25W
Market Segmentation (by Application)
- Ku-band, U/VHF & Broadband Amplifiers
- Base Station
- Drone & UAV
- Radar & Satellite
- WiMAX, LTE, WCDMA, GSM
- Others
Market Drivers
- Growing Demand for High-Speed Switching Applications
GaN Bare-die devices enable high-speed switching, reducing power loss and improving efficiency in power electronics applications. - Increasing Adoption in Telecom and Data Centers
The rapid expansion of 5G networks and data centers is boosting the need for GaN-based components to handle high-frequency operations. - Advancements in Aerospace and Defense Technologies
Rising investments in radar systems, UAVs, and satellite communications are driving the adoption of GaN-based semiconductors.
Market Restraints
- High Manufacturing Costs
The complex fabrication process and material costs of GaN-based semiconductors make them more expensive than traditional silicon-based devices. - Limited Awareness and Adoption
Many industries are still in the early stages of adopting GaN technology, slowing market penetration. - Competition from Silicon and SiC Alternatives
Silicon and silicon carbide (SiC) continue to be strong competitors, especially in cost-sensitive applications.
Market Opportunities
- Rising Demand in Electric Vehicles (EVs)
The shift toward EVs is increasing demand for GaN-based power devices to enhance battery performance and efficiency. - Growing Investments in Renewable Energy
The expansion of solar and wind energy systems is driving the need for efficient power conversion solutions using GaN semiconductors. - Miniaturization of Electronic Devices
GaN technology enables smaller and more efficient power devices, supporting trends in compact and portable electronics.
Market Challenges
- Thermal Management Issues
GaN-based devices generate significant heat, requiring advanced cooling techniques to maintain performance. - Complex Manufacturing Process
GaN fabrication is more complex than silicon, posing challenges in large-scale production. - Regulatory and Standardization Issues
The lack of global standards for GaN-based devices may create regulatory challenges for manufacturers.
Key Benefits of This Market Research:
- Industry drivers, restraints, and opportunities covered in the study
- Neutral perspective on the market performance
- Recent industry trends and developments
- Competitive landscape & strategies of key players
- Potential & niche segments and regions exhibiting promising growth covered
- Historical, current, and projected market size, in terms of value
- In-depth analysis of the GaN Bare-die Market
- Overview of the regional outlook of the GaN Bare-die Market:
Key Reasons to Buy this Report:
- Access to date statistics compiled by our researchers. These provide you with historical and forecast data, which is analyzed to tell you why your market is set to change
- This enables you to anticipate market changes to remain ahead of your competitors
- You will be able to copy data from the Excel spreadsheet straight into your marketing plans, business presentations, or other strategic documents
- The concise analysis, clear graph, and table format will enable you to pinpoint the information you require quickly
- Provision of market value data for each segment and sub-segment
- Indicates the region and segment that is expected to witness the fastest growth as well as to dominate the market
- Provides insight into the market through Value Chain
- Market dynamics scenario, along with growth opportunities of the market in the years to come
- 6-month post-sales analyst support
Customization of the Report
In case of any queries or customization requirements, please connect with our sales team, who will ensure that your requirements are met.
FAQs
Q: What are the key driving factors and opportunities in the GaN Bare-die market?
A: The key drivers include growing demand for high-speed switching, expansion in telecom and data centers, and advancements in defense technologies. Opportunities lie in EV adoption, renewable energy investments, and the miniaturization of electronics.
Q: Which region is projected to have the largest market share?
A: North America is expected to hold the largest market share due to strong demand in telecom, aerospace, and defense industries, along with technological advancements.
Q: Who are the top players in the global GaN Bare-die market?
A: Major players include Wolfspeed, WAVEPIA Co. Ltd, GeneSiC (Navitas Semiconductor), Macom, EPC, Microchip, NewSemi Technology, and WAVICE.
Q: What are the latest technological advancements in the industry?
A: Key advancements include GaN-on-Si technology, improved thermal management solutions, and higher efficiency GaN transistors for telecom and automotive applications.
Q: What is the current size of the global GaN Bare-die market?
A: The global GaN Bare-die market was valued at USD 23 million in 2023 and is projected to reach USD 71.33 million by 2032, with a CAGR of 13.40% during the forecast period.
Get Sample Report PDF for Exclusive Insights
Report Sample Includes
- Table of Contents
- List of Tables & Figures
- Charts, Research Methodology, and more...