SEMICONDUCTOR INSIGHT
MARKET RESEARCH REPORT

Gallium Nitride Single Crystal Substrates Market

2026 to 2034
MARKET INTELLIGENCE
ACROSS KEY REGIONS
2026 EDITION
POWER ELECTRONICS Semiconductor Market Research

Gallium Nitride Single Crystal Substrates Market

Size, Trends, Business Strategies 2026-2034

◷
UPDATED 30 October 2026
▤
REPORT LENGTH Detailed Report
▣
REPORT CODE fcf32355e77b
▯
FORMATS PDF

Gallium nitride single crystal substrates market was valued at USD 20.11 million in 2025 and is projected to reach USD 93.39 million by 2034, representing a CAGR of 18.6% during 2026–2034. Asia-Pacific led the base-year market with an estimated ~43% share, supported by native GaN crystal growth and optoelectronic manufacturing.

Get the sample PDF with study scope, segmentation and methodology details.

Key Statistics

2025 Market Size
USD 20.11 million
2034 Projected Size
USD 93.39 million
CAGR (2026–2034)
18.6%
Largest Market in 2025
Asia-Pacific (~43%)

Key Takeaways

  • Market trajectory: the native GaN single-crystal substrate market reached USD 20.11 million in 2025 and is projected to expand to USD 93.39 million in 2034, implying a 18.6% CAGR during 2026–2034 as larger wafers and better crystal quality support laser and electronic devices.
  • Wafer-size structure: 2 Inches retains the largest estimated type share at ~58% in 2025, reflecting established laser-diode manufacturing, while 4 Inches represents ~33% and advances at ~21.5% CAGR as processing equipment and substrate availability improve.
  • Application mix: Laser Diodes lead with an estimated ~45% of 2025 revenue; Power Electronic Devices account for ~18% but grow fastest at ~23.0% CAGR because native GaN-on-GaN structures are being developed for demanding vertical and high-voltage devices.
  • Regional outlook: Asia-Pacific represents an estimated ~43% of base-year value and the fastest growth at ~19.7% CAGR, followed by North America at ~26% and Europe at ~20%, reflecting Japanese and Chinese wafer supply and research activity in the United States and Poland.
  • Technical bottlenecks: defect density, large-diameter boule growth, wafer slicing losses and dopant control determine achievable output more than simple production-line expansion, while sapphire, silicon and SiC remain practical alternative carrier materials for many GaN epitaxial devices.

Gallium Nitride Single Crystal Substrates Market Overview

Gallium nitride single crystal substrates market was valued at USD 20.11 million in 2025 and is projected to reach USD 93.39 million by 2034, representing a CAGR of 18.6% during 2026–2034. Asia-Pacific led the base-year market with an estimated ~43% share, supported by native GaN crystal growth and optoelectronic manufacturing.

Base year: 2025 · Estimated year: 2026 · Forecast period: 2026–2034 · Historical context: 2021–2024 · Values in USD million

A gallium nitride single-crystal substrate is a freestanding wafer cut from a bulk GaN crystal rather than a thin GaN film grown on a foreign carrier. Its lattice compatibility with subsequent GaN device layers can improve the material quality available to laser diodes and specialized power electronics. The trade-off is a more demanding crystal-growth process and higher substrate cost compared with mature silicon or sapphire platforms used across many semiconductor applications.

The commercial boundary covers native bulk GaN wafers sold as substrates, including conducting and semi-insulating material in the published 2-inch, 4-inch and residual diameter categories. It excludes silicon, sapphire and silicon-carbide carrier wafers, separately sold GaN-on-foreign-substrate epitaxial products, finished LEDs and laser diodes, and the value of downstream power devices. A GaN-on-GaN epitaxial wafer can provide demand context without implying that its full device-layer processing revenue belongs to the bare substrate market.

Growth methods include hydride vapor phase epitaxy for thick GaN crystal material and ammonothermal techniques that develop crystals in a high-pressure chemical environment. After growth, the boule must be oriented, sliced, polished and inspected for defects and bow. Yield losses at each step influence the cost of saleable wafers, so a supplier with larger crystal diameters still needs reproducible surface preparation and low defect densities before an electronic-device customer can adopt the product.

Native GaN has a strong historical connection with violet, blue and green laser diodes, where high-quality material supports optical performance and device lifetime. Electronic-device opportunities are broader but require additional advances in wafer diameter, conductivity and defect control. Suppliers therefore maintain different product specifications for optoelectronic and power-device customers, and progress in one end use does not automatically establish qualification in another.

Commercialization is changing as companies move from established 2-inch supply toward 4-inch production and experimental 6-inch substrates. Larger diameters can lower cost per processed device if crystal quality and wafer yield remain acceptable, but a larger wafer with high defect density may offer little economic advantage. The market is consequently shaped by the interaction of crystal-growth research, industrial processing equipment and customer qualification rather than a simple forecast of wafer area. Under a constant-rate interpolation, market value progresses from USD 23.86 million in 2026 to USD 28.29 million in 2027, USD 33.56 million in 2028, USD 39.80 million in 2029, USD 47.20 million in 2030, USD 55.98 million in 2031, USD 66.39 million in 2032, USD 78.74 million in 2033 and 93.39m in 2034. These intermediate values describe the geometric growth path rather than independently observed annual market measurements.

Segment Analysis: By Type

Native GaN wafer diameter is a primary determinant of device economics and available fabrication capacity. The 2 Inches class holds an estimated ~58% share in 2025, 4 Inches represents ~33%, and Other sizes ~9%; 4 Inches expands fastest at ~21.5% CAGR as crystal suppliers pursue higher-throughput device processing. The resulting purchase mix reflects different levels of wafer-handling maturity and process qualification.

Type Function Market position
2 Inches Two-inch GaN wafers serve mature native-substrate device flows, particularly blue and green laser diodes and specialized optoelectronic components. Existing process experience supports material qualification, and smaller crystals are easier to grow with consistent quality than large boules. However, fewer die can be processed per wafer, and handling or polishing costs do not fall proportionally with the wafer area. The 2 Inches category leads with an estimated ~58% of 2025 revenue and a modeled ~16.6% CAGR. Its installed manufacturing base provides recurring orders, but the shift to larger wafer formats limits relative growth. Customers may retain this diameter where proven optical quality and process stability outweigh potential economies from migration.
4 Inches Four-inch substrates offer a larger device-processing surface and a bridge between established laser manufacturing and emerging power semiconductor fabrication. Sumitomo Chemical has described mass-produced 4-inch GaN substrates, showing that the diameter is commercially available. The economic case still depends on defect distribution across the full wafer and the capability of downstream equipment to maintain uniform epitaxy and lithography. An estimated ~33% base-year share is allocated to 4 Inches, with ~21.5% CAGR making it the fastest-growing named type. Customers can gain processing productivity when they qualify the format, but the transition requires new wafer handling, inspection and device yield evidence. The category is important to the forecast even without assuming universal migration.
Other The residual category includes nonstandard research substrates, small crystalline pieces and diameters beyond the established two principal classes, including development-stage 6-inch material. These products support device prototyping and new growth processes but are not equivalent to mass-qualified large-diameter wafer supply. Purchasers often evaluate structural defects and electrical characteristics on limited sample quantities before committing to full production flows. Other sizes hold an estimated ~9% share in 2025 and follow ~19.0% CAGR in the model. Development activity can produce high unit prices but limited commercial volume, while some experimental formats may never reach economical scale. The category therefore captures technical diversity without treating every demonstration wafer as established production capacity.

Why does wafer diameter matter beyond surface area?

A larger native GaN substrate offers more usable die only when crystalline quality, edge exclusion and downstream processing yield are maintained. Crystal growth must control stress and dislocation distribution over a wider area, while slicing and polishing become more demanding as wafer bow increases. Device makers therefore evaluate effective usable area rather than nominal diameter, and a smaller high-quality wafer can remain economically preferable for sensitive laser applications.

Electrical characteristics add another dimension to wafer qualification. Conducting n-type GaN is suitable for some vertical device and laser structures, whereas semi-insulating material serves other high-frequency designs. A diameter label alone cannot describe dopant concentration, resistivity, orientation or defect density, so substrate vendors differentiate through detailed specifications and the ability to reproduce them across multiple growth batches.

Segment Analysis: By Application

Laser Diodes account for an estimated ~45% of 2025 substrate demand, LED production ~30%, Power Electronic Devices ~18% and Others ~7%. Power electronics is the fastest-growing application at ~23.0% CAGR, although optoelectronic manufacturing remains the main commercial foundation for native bulk GaN supply. Research uses remain smaller and more fragmented than established laser purchasing channels.

Application Demand characteristics
LED High-performance LEDs can use native GaN material when crystalline quality and device requirements justify the substrate premium. The estimated ~30% application share reflects specialized optoelectronic demand rather than all LED production, much of which uses GaN epitaxy on sapphire or other foreign substrates. Purchasing decisions weigh brightness, wavelength stability, yield and wafer cost, with established lower-cost carriers remaining strong alternatives in volume lighting.
Laser Diodes Blue, green and violet laser diodes are established applications for bulk GaN wafers because optical device performance benefits from suitable native crystalline material. Laser Diodes lead with an estimated ~45% of 2025 market value and advance at ~18.4% CAGR. Suppliers compete on low dislocation density, surface finish and repeatable electrical properties, while downstream customers often maintain long qualification cycles for optical reliability.
Power Electronic Devices Native GaN substrates can support device architectures seeking high breakdown capability and improved crystalline compatibility, including emerging vertical structures. This application accounts for an estimated ~18% of 2025 value but expands fastest at ~23.0% CAGR as larger-diameter development progresses. Qualification requires more than demonstrating a substrate: device makers must establish suitable doping, defect behavior, wafer yield and manufacturing economics against mature silicon and SiC alternatives.
Others Research devices, specialized sensors and selected high-frequency electronics make up an estimated ~7% of substrate revenue. Purchases may involve semi-insulating wafers, unusual orientations or small lots for process development rather than stable production schedules. Modeled growth of ~17.0% CAGR reflects technical experimentation, but adoption remains sensitive to project funding and the ability to move from sample characterization to a repeatable device flow.

The purchasing channel differs between an established laser-diode manufacturer and a university developing a vertical GaN switch. Production customers typically require repeatable wafer specifications and supply continuity across multiple quarters, whereas research users may accept higher prices for specialized material properties. This distinction explains why prototype substrate activity can grow before it translates into substantial volume, and why supplier capability should be assessed by qualified wafer output rather than catalog breadth alone.
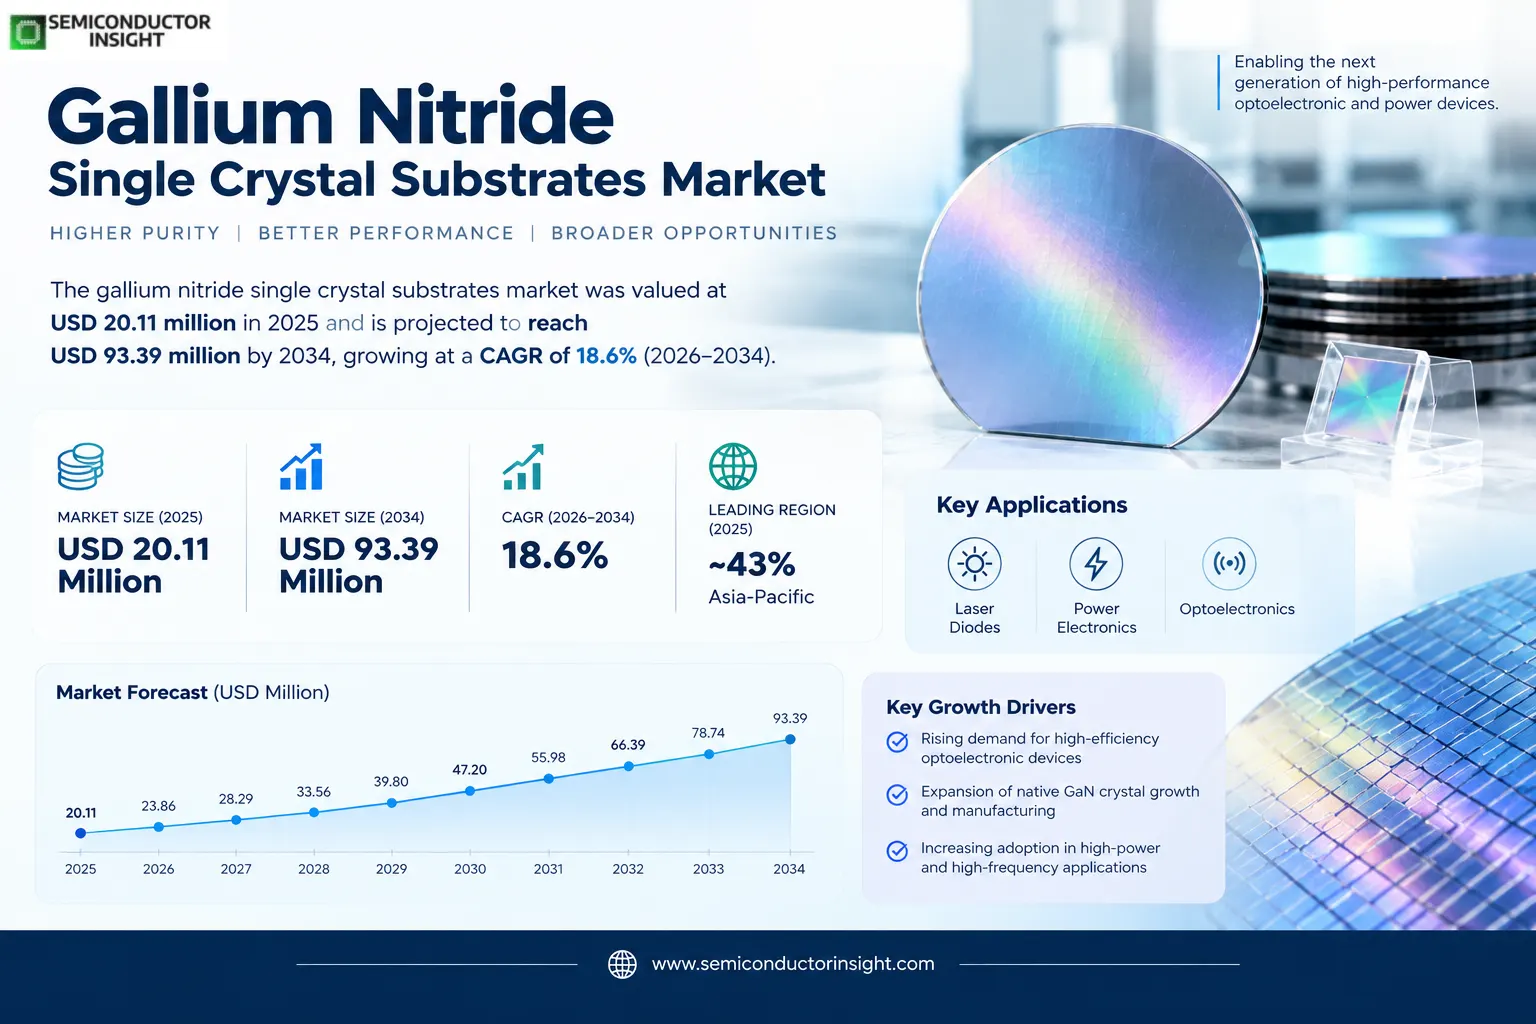
Gallium Nitride Single Crystal Substrates Market, Size, Trends, Business Strategies 2026-2034

Regional Analysis

Asia-Pacific leads with an estimated ~43% share and ~19.7% CAGR, followed by North America at ~26% and Europe at ~20%; South America and the Middle East & Africa represent ~6% and ~5%. Japan and China anchor commercial wafer supply, while research institutes and device developers across the other regions shape demand for specialized native GaN material.

Where is bulk GaN wafer commercialization concentrated?

Regional market position reflects where native crystals are grown, where device makers qualify them and where specialty wafers are purchased. Japanese suppliers have established laser-oriented production and large-diameter development programs, Chinese manufacturers offer self-supporting GaN products, and European institutes investigate crystal defect control. North American customers contribute specialist research and device demand, while smaller regions depend more on imported material and international technical partnerships.

Region Position Growth outlook Demand profile What decides supplier selection
Asia-Pacific Largest (~43%) Fastest (~19.7% CAGR) Native crystal growth and optoelectronic production Commercial crystal quality, diameter and wafer-processing yield determine supplier preference.
North America Second (~26%) Developing (~17.0% CAGR) Research programs and specialized device qualification Traceable materials, research partnerships and sample characterization drive access.
Europe Third (~20%) Balanced (~18.0% CAGR) Ammonothermal crystal science and compound semiconductors Defect metrology, long project horizons and specialty wafer specifications matter.
South America Small (~6%) Selective (~18.7% CAGR) Imported laboratory and optoelectronic materials Distribution, sample availability and research financing shape demand.
Middle East & Africa Emerging (~5%) Project-led (~19.2% CAGR) Academic research and selected high-performance devices International partnerships and specialized material procurement are central.

Asia-Pacific LARGEST · ~43% SHARE · FASTEST-GROWING

What makes Asia-Pacific the core native GaN substrate market?

Asia-Pacific has an estimated ~43% of 2025 revenue and the highest modeled regional growth at ~19.7% CAGR. Japanese manufacturers provide established native GaN products for laser diodes and are developing larger formats for power devices, while Chinese suppliers contribute commercial self-supporting wafer capacity. Regional device makers can qualify material close to fabrication operations, reducing development-cycle friction.

Market positionLargest (~43%)
Growth outlookFastest (~19.7% CAGR)
Demand profileCrystal supply and laser devices
Market access gateLow-defect yield at commercial diameter
Country Position in region What drives demand
Japan Established native GaN supply Japanese chemical and semiconductor materials companies have long supplied GaN substrates for optical applications, with newer work directed toward larger wafers and power-device structures. Sumitomo Chemical and Mitsubishi Chemical document different growth and processing approaches, including HVPE and ammonothermal research. The commercial challenge is to maintain low defects while increasing diameter, not simply to produce larger demonstration crystals.
China Expanding domestic production Chinese suppliers including Suzhou Nanowin advertise self-supporting GaN wafers with multiple doping options and diameters. These products serve laser, electronic and research applications where customers need specific electrical properties. Scaling the market depends on reproducible wafer quality and downstream qualification, and the availability of domestic crystal material can shorten engineering cycles for regional device manufacturers.
South Korea and Taiwan Device and process expertise South Korea and Taiwan host sophisticated semiconductor and optoelectronic engineering ecosystems, creating potential demand for native GaN substrates in research and selected device flows. Many high-volume GaN processes still use foreign carrier materials, so local semiconductor production cannot be equated directly with native bulk wafer consumption. Suppliers must demonstrate performance gains sufficient to offset the higher material price.
Market instances

  • Two commercial diameters coexist with a larger development target. Sumitomo Chemical identified mass-produced 2-inch and 4-inch GaN substrates while describing 6-inch wafers as under development in its 2026 PCIM materials. This distinction is commercially important because a prototype diameter is not evidence of qualified volume supply. Device manufacturers need consistent crystal quality, handling compatibility and measured yield before they can migrate established fabrication processes.
  • Doping options create distinct substrate products. Suzhou Nanowin offers undoped, silicon-doped and iron-doped self-supporting GaN material in its public product range. These variants address different electrical characteristics rather than interchangeable wafer commodities. Customers selecting material for a laser or high-frequency device must align resistivity and defect behavior with the intended epitaxial stack, so supplier differentiation extends beyond wafer diameter.
  • Laser manufacturing remains an important reference market. Native GaN has an established role in high-performance blue and green laser applications, providing suppliers with process experience before emerging power electronics reaches comparable maturity. Optical manufacturers value substrate uniformity and stable defect density because these affect device yield and operating life. This installed technical base can support further crystal-growth investment even when power-device projects remain in development.
In the full report: native GaN substrate shipments, diameter mix, growth technology and qualified suppliers across Japan, China, South Korea, Taiwan and other Asian markets.

North America SECOND LARGEST · ~26% SHARE

Why is North American demand concentrated in qualification?

North America contributes an estimated ~26% of the 2025 market and expands at ~17.0% CAGR. The region includes specialist compound-semiconductor research, device development and high-reliability electronics programs that can justify native GaN material despite a cost premium. Purchasing tends to be application-led, with substrate characterization and intellectual-property collaboration preceding any large production commitment.

Market positionSecond (~26%)
Growth outlookDeveloping (~17.0% CAGR)
Demand profileResearch and high-value devices
Market access gateMaterial traceability and application proof
Country Position in region What drives demand
United States Specialty device development American universities, national laboratories and semiconductor companies investigate GaN materials for optical, high-frequency and power-device applications. Native substrates can help isolate the effects of lattice mismatch in experimental structures, but the choice depends on device architecture and budget. Research orders are often small, with extensive metrology requirements and close interaction between material vendors and process engineers.
Canada University and materials research Canadian academic and technology organizations contribute to compound-semiconductor characterization and selected optoelectronic projects. Their substrate demand is more likely to be specialized research procurement than broad commercial wafer fabrication. Vendors serving this channel need reliable sample specifications, documentation of orientation and doping, and access to technical staff who can help interpret defects or growth-related variations.
Mexico Downstream electronics links Mexico is important to North American electronics assembly, but that position does not imply a large domestic bulk GaN crystal-growth industry. Native substrate purchasing is more likely to arise through research partnerships or imported device programs than through high-volume local wafer production. Market access therefore depends on international supply routes and collaboration with semiconductor developers elsewhere in the region.
Market instances

  • Native substrates offer a controlled research platform. Researchers comparing GaN device structures can use a GaN wafer to reduce lattice-mismatch effects associated with foreign substrates. The benefit is not automatic commercial superiority, because native material remains expensive and many lateral GaN technologies perform well on silicon or SiC. North American laboratories therefore evaluate crystal quality against the precise electrical or optical property being studied.
  • Small orders can have demanding acceptance specifications. A research institute may purchase only a few wafers while requesting detailed defect maps, crystallographic orientation and electrical resistivity data. Suppliers cannot judge this channel solely by wafer count, since custom preparation and characterization create value. The path to repeat orders often depends on whether the material supports reproducible experimental results across multiple device fabrication runs.
  • Power electronics adoption depends on process economics. Developers of vertical GaN devices may prefer native material for selected high-voltage structures, but production decisions must account for wafer area, crystal yield and processing cost. A successful laboratory demonstration does not guarantee a commercially viable substrate supply chain. This gap between technical feasibility and production qualification is a defining characteristic of North American demand.
In the full report: United States, Canadian and Mexican research and device-manufacturing demand, including material qualification, supplier access and native-wafer adoption barriers.

Europe THIRD LARGEST · ~20% SHARE

How does European crystal science influence commercial supply?

Europe represents an estimated ~20% of global 2025 revenue and follows ~18.0% CAGR. The region has strong compound-semiconductor research and specialist crystal-growth expertise, including Polish ammonothermal GaN programs and German device institutes. Its market role combines direct material development with purchases for high-performance electronics, where technical specifications and funded research milestones often determine procurement timing.

Market positionThird (~20%)
Growth outlookBalanced (~18.0% CAGR)
Demand profileCrystal science and device R&D
Market access gateDefect control and funded program continuity
Country Position in region What drives demand
Poland Ammonothermal crystal expertise Polish research institutes investigate bulk GaN growth, doping and point defects, including methods to obtain semi-insulating material. Such work is relevant because electrical properties must be controlled throughout a crystal rather than only in a deposited surface layer. Research results can influence future substrate specifications, but public project funding should not be interpreted as immediate commercial wafer sales.
Germany Device research and metrology German compound-semiconductor institutes operate GaN epitaxy and device-processing programs that can use native GaN among several substrate options. Their work on high-frequency and power components provides technical demand context for bulk crystal suppliers. Equipment makers and research laboratories need detailed surface and electrical characterization before transferring a wafer technology into an industrial device flow.
France and United Kingdom Specialist research networks French and British materials and electronics research groups participate in wide-bandgap semiconductor development, often through collaborative European programs. Native GaN substrate demand is concentrated in selected experiments and specialized optical or electronic devices rather than every GaN fabrication line. Vendors need to meet procurement documentation, cross-border shipment and reproducibility requirements to support multiyear research partnerships.
Market instances

  • Ammonothermal defect research addresses a commercialization bottleneck. The Polish Institute of High Pressure Physics describes projects investigating point defects and conductivity in bulk GaN crystals. These properties matter because compensating impurities and vacancies can alter the electrical behavior of a substrate after growth. Better understanding of defect formation may improve the reliability of future semi-insulating or conducting wafers, supporting more demanding electronic applications.
  • European device lines use several substrate materials. Fraunhofer IAF describes GaN electronic technologies built with options including silicon carbide, aluminum nitride and GaN substrates. This range illustrates why demand for GaN devices cannot be converted directly into demand for native GaN wafers. A crystal supplier must demonstrate a clear device-level advantage before a fabrication process replaces an established foreign carrier.
  • Research collaboration reduces the cost of specialized experiments. Universities and public laboratories can share characterization tools, growth expertise and device testing when developing new GaN substrates. Such collaborations help suppliers understand whether defect density, doping or surface preparation limits a proposed application. Commercial volume still depends on successful transfer into a qualified manufacturing line, which can take longer than the original materials-science project.
In the full report: Polish, German, French and British native GaN research programs, device-process applications and pathways from crystal growth to commercial substrate qualification.

South America DEVELOPING · ~6% SHARE

Where does South America purchase native GaN material?

South America accounts for an estimated ~6% of 2025 market revenue and grows at ~18.7% CAGR from a small base. Most opportunities involve imported research substrates and selected optoelectronic development rather than an extensive local bulk crystal industry. Access to technical documentation, international shipping and institutional research budgets can be more important than wafer price alone.

Market positionDeveloping (~6%)
Growth outlookSelective (~18.7% CAGR)
Demand profileResearch and imported materials
Market access gateAvailability of small qualified lots
Country Position in region What drives demand
Brazil Academic and industrial research Brazilian universities and electronics research organizations can purchase native GaN wafers for materials science and prototype device fabrication. The opportunity is generally project-specific because commercial crystal growth is less developed than in leading Asian supply centers. Buyers require clear import arrangements and characterization data, especially when a wafer will be processed in shared laboratory equipment.
Argentina Specialized laboratory demand Argentine semiconductor and photonics research may use small quantities of bulk GaN material to study optical or electrical behavior. Funding cycles and currency constraints can influence procurement schedules, making consistent access to samples important. Suppliers that provide precise wafer specifications and remote application support are better placed than vendors relying on large minimum order quantities.
Chile and Colombia Emerging university users Universities and specialized laboratories in Chile and Colombia may source GaN substrates for experimental optoelectronics and advanced materials programs. The demand is small compared with established industrial laser manufacturing, but it can support high-value sample orders. Cross-border distribution and access to suitable epitaxial or inspection equipment shape whether research purchases become recurring requirements.
Market instances

  • Research procurement is not equivalent to factory capacity. A laboratory can import a handful of GaN wafers without possessing the infrastructure needed for commercial boule growth or device manufacturing. This distinction matters when comparing regional research activity with substrate revenue. Suppliers should evaluate customer equipment capabilities and likely repeat purchases rather than assuming that every research grant creates a new industrial wafer production line.
  • Detailed wafer characterization supports remote customers. For institutions located far from the original crystal-growth facility, defect maps, orientation data and surface-quality records reduce the risk of unusable experiments. A shipment of expensive native GaN material can be difficult to replace quickly if specifications are unclear. Technical transparency and sample consistency therefore influence repeat business in smaller South American research markets.
  • Cost-effective sample programs can widen participation. Offering smaller lots or specialized crystal pieces can make native GaN accessible to groups that do not require full production wafers. Such arrangements help researchers test device concepts before investing in larger processing runs. Commercial revenue remains limited by project scale, but early experimentation can create future demand for better-controlled substrates as laboratory processes mature.
In the full report: research-led demand in Brazil, Argentina, Chile and Colombia, including imported native GaN samples, institutional procurement and technical-support requirements.

Middle East & Africa EMERGING · ~5% SHARE

What limits the market outside established crystal-growth hubs?

Middle East & Africa holds an estimated ~5% of 2025 revenue and grows near ~19.2% CAGR as selected universities and technology programs explore wide-bandgap materials. The region has relatively limited native GaN crystal production, so procurement depends on international suppliers, funded research and access to semiconductor processing infrastructure. Large end-market electronics investments do not automatically translate into local bulk substrate purchases.

Market positionEmerging (~5%)
Growth outlookProject-led (~19.2% CAGR)
Demand profileUniversity and specialist electronics work
Market access gateImport channels and laboratory readiness
Country Position in region What drives demand
Saudi Arabia Advanced materials programs Saudi academic and industrial technology initiatives may create opportunities for specialized GaN substrate research, particularly where energy-efficient electronics and photonics are priorities. Bulk crystal procurement remains distinct from purchasing finished power devices or telecommunications equipment. Suppliers need to assess whether prospective customers have epitaxy, inspection and device-processing access before forecasting sustained wafer demand.
United Arab Emirates Research partnerships The UAE has invested in advanced technology and university research capabilities that can support compound-semiconductor experimentation. Native GaN wafer purchases are likely to be specialized and dependent on collaboration with international material suppliers. Procurement may favor fully characterized samples and application support rather than high-volume contracts, especially during early device feasibility studies.
South Africa and North Africa Distributed scientific demand Research institutions in South Africa and parts of North Africa can participate in materials characterization and semiconductor device studies, but domestic native GaN boule production remains limited. Orders therefore tend to rely on imported samples, grant funding and shared equipment access. Suppliers serving these laboratories benefit from clear technical specifications and realistic delivery schedules for specialized material.
Market instances

  • Laboratory infrastructure determines attainable wafer demand. A project focused on GaN electronics may need a native substrate only if its process can deposit suitable device layers and characterize the resulting material. Without these capabilities, the same project may purchase finished components or foreign-substrate epiwafers instead. Regional substrate sales should therefore be linked to practical processing capacity rather than broad semiconductor policy announcements.
  • International collaboration can open specialized markets. A university working with an overseas crystal-growth institute may gain access to high-quality GaN samples and defect-characterization expertise that would be costly to reproduce locally. Such partnerships can generate recurring technical orders while remaining small in absolute value. Commercial expansion depends on sustained funding and on successful progression from materials testing to demonstrable device results.
  • Long supply routes increase the value of specification certainty. Shipping a small lot of expensive native GaN wafers across regions creates lead-time and replacement risks, especially when the customer needs a rare doping or orientation specification. Buyers may accept a premium for verified characterization and predictable logistics. Suppliers that document wafer properties before shipment can reduce experimental delays and improve the likelihood of repeat procurement.
In the full report: research and technology demand in Gulf states, South Africa and North Africa, with imported substrate procurement, laboratory capability and international collaboration analysis.

Competitive Landscape of the Gallium Nitride Single Crystal Substrates Market

Native GaN substrate competition centers on crystal-growth capability, wafer diameter, dislocation density, electrical properties and repeatable polishing. The supplier list includes established Japanese materials producers, Chinese wafer specialists and smaller technology developers. Their commercial roles differ from device manufacturers that merely consume GaN-on-silicon or GaN-on-SiC epiwafers, so a broad GaN semiconductor portfolio does not by itself establish bulk single-crystal substrate supply.

Sumitomo Chemical, including its SCIOCS substrate activities, has documented commercial 2-inch and 4-inch native GaN products while pursuing 6-inch development for power electronics. Its ability to draw on experience in laser-oriented material production provides an established qualification base. The principal scaling challenge is to translate crystal-growth know-how into larger wafers with consistent usable area and electrical properties, which determines whether new customers can adopt the format.

Mitsubishi Chemical describes HVPE-grown GaN substrates with emphasis on crystalline uniformity and surface quality, alongside ammonothermal technologies under development. These approaches are not interchangeable manufacturing recipes, and each must meet customer requirements for defect distribution and resistivity. Suzhou Nanowin markets several self-supporting GaN wafer variants, illustrating the importance of offering different doping configurations as well as different nominal diameters.

The publisher supplier universe also includes Sanan Optoelectronics, Toyoda Gosei, WAFER WORKS, Kyma Technologies and other regional or specialist names. Not every named company should be assumed to sell the same volume of native bulk GaN wafers, and some participate in adjacent substrate or device supply chains. Competitive positioning must distinguish demonstrated product offerings from broader compound-semiconductor manufacturing and research activities.

For high-value native substrates, the technical sales process often includes sample characterization, defect mapping and device trials before a production contract is awarded. Customers may retain a qualified source for years because changing crystal material can affect epitaxial growth and device yield. Manufacturers able to provide stable lots, traceability and detailed material specifications can therefore compete on reliability and engineering support even without the largest stated crystal diameter.

Tier structure

Tier Companies Basis of competition
Tier 1 Sumitomo Chemical / SCIOCS; Mitsubishi Chemical Documented commercial native GaN substrate portfolios and established materials processing capabilities support these suppliers in optical and emerging electronic uses. Their competitive advantage is not just crystal size but reproducibility of quality, surface preparation and the ability to support long customer qualification programs.
Tier 2 Suzhou Nanowin Science and Technology; selected specialist GaN crystal growers Specialized suppliers offer self-supporting GaN wafers with varying diameters and electrical properties, creating alternatives for laser and research customers. Their ability to convert development expertise into steady industrial shipments depends on defect control, wafer finishing and responsive technical support during customer device trials.
Tier 3 Kyma Technologies; other research-stage and regional materials specialists Emerging and niche participants may supply limited lots, custom orientations or specialized crystal-growth services rather than large-scale commodity wafers. They can influence technology development and address difficult research requirements, but their position should be evaluated by actual substrate capability instead of unrelated device or equipment revenue.

Key companies profiled

  • Sumitomo Electric Device Innovations (SCIOCS)
  • Okmetic
  • BTOZ
  • Suzhou Nanowin Science and Technology
  • Sanan Optoelectronics
  • Sino Nitride Semiconductor
  • WAFER WORKS
  • Toyoda Gosei
  • Mitsubishi Chemical
  • Kyma Technologies
  • Eta Research Ltd
  • Goetsu Semiconductor Wuxi

Production Capacity and Crystal-Growth Analysis

Saleable native GaN wafer capacity is governed by the output of bulk crystal growth, usable boule dimensions and the yield of slicing, grinding and polishing. A crystal-growth reactor cannot be evaluated solely by the nominal diameter it can produce. Dislocations, cracks, bow and electrical nonuniformity determine how many wafers reach the specifications required by laser or power-device customers.

HVPE can grow thick GaN material at comparatively high rates, but manufacturers must manage stress, impurities and crystalline defects before a boule becomes a useful substrate. Ammonothermal growth offers another route with different chemistry, pressure and impurity challenges. The Polish Institute of High Pressure Physics has documented research into point defects in ammonothermal crystals, showing why a low nominal dislocation count alone does not fully characterize electrical suitability.

Wafering converts grown crystal into saleable substrate area through orientation, slicing and surface finishing. Kerf loss consumes valuable material, while polishing removes damaged layers and establishes the surface needed for subsequent epitaxy. Research on laser-assisted GaN slicing has examined how substrate reuse might reduce consumption of expensive native material, although industrial adoption requires proof of reliable wafer recovery and device compatibility.

Large-diameter production increases the possible number of devices per processing cycle, but only when uniformity and downstream equipment readiness keep pace. Development programs for 6-inch GaN-on-GaN material seek a format more compatible with power semiconductor manufacturing, while established 2-inch and 4-inch supply supports current demand. The transition will depend on defect density, cost per usable area and customer qualification rather than a single laboratory demonstration. In the 2025 model, the 2-inch class represents ~58%, the 4-inch class ~33% and other diameters ~9%, while applications allocate ~45% to lasers, ~30% to LEDs, ~18% to power devices and ~7% to other uses.

Market Dynamics, Drivers, Restraints and Opportunities

The outlook reflects increasing demand for high-quality native GaN in lasers and selected electronics, tempered by crystal-growth cost and the availability of foreign carrier alternatives. Diameter scaling, defect control and new device structures can expand the addressable market, but commercial qualification remains slow. Impact contributions represent a modeled allocation to the 2026–2034 CAGR rather than directly measured supplier revenue changes.

MARKET DRIVERS

Drivers Impact Analysis*

Market Drivers Impact Rank CAGR Contribution (%) 2026–2028 2029–2031 2032–2034
Native GaN laser diode substrate demand High +6.40% High High Medium
Four-inch wafer migration and usable area Medium-High +5.60% Medium High High
Vertical GaN power device development Medium +4.70% Low Medium High
Crystal defect reduction and surface processing Low-Medium +3.20% Medium High High
Others (specialty research and high-frequency device trials) Low +1.80% Low Medium Medium

Optoelectronic devices sustain an industrial base

Native GaN wafers have an established application in demanding laser diodes, where crystalline quality affects device operation and reliability. This provides recurring substrate demand and practical process knowledge for manufacturers investing in future wafer sizes. Improvements in laser technology can create value even without a wholesale migration of general LED production away from less expensive sapphire-based platforms.

Larger wafers improve potential processing economics

Moving from 2-inch to 4-inch GaN material increases the surface available for device fabrication, potentially lowering per-device handling cost when yield remains stable. Customers must first qualify equipment compatibility, wafer bow and defect uniformity. Substrate suppliers that can deliver repeatable larger wafers are positioned to serve new device programs, but a nominal diameter increase without usable area gains has limited commercial benefit.

Power electronics expands the long-term use case

GaN-on-GaN device research explores structures that may exploit native crystalline compatibility and high breakdown characteristics. Power device developers need material with suitable conductivity, thickness and defect behavior, often differing from established laser requirements. If these processes become economically manufacturable, they can create new substrate demand beyond optoelectronics, although early device prototypes should not be confused with current mass-market wafer shipments.

Improved defect control strengthens customer confidence

Crystal dislocations, vacancies and unintended impurities can affect optical output, leakage behavior and device lifetime. Growth-process refinements and better wafer characterization help manufacturers produce lots with narrower property distributions. This reduces the burden on device makers during qualification and can make native substrates viable for applications that previously tolerated only small research samples.

MARKET RESTRAINTS

Restraints Impact Analysis*

Market Restraints Impact Rank CAGR Contribution (%) 2026–2028 2029–2031 2032–2034
High cost of bulk GaN crystal growth and wafering High -1.40% High High Medium
Defects and electrical property variation Medium-High -0.90% High Medium Medium
Competition from sapphire, silicon and SiC carriers Medium -0.50% High High High
Others (qualification time and specialized equipment) Low -0.30% Medium Medium Low
*CAGR contribution shows the percentage points each factor adds to or removes from the forecast CAGR for 2026–2034; driver contributions less restraint contributions equal the market CAGR. For native gallium nitride substrates, the period columns show how each commercial influence changes over the forecast horizon.

Crystal growth remains capital and expertise intensive

Producing a thick single crystal requires specialized equipment and sustained control of temperature, chemistry and stress. Material lost during boule preparation and wafer slicing adds to the effective cost of each accepted substrate. Device manufacturers compare this premium with established foreign-substrate processes, limiting adoption where native GaN does not provide a measurable improvement in performance or yield.

Defect behavior is more complex than a headline metric

A low threading dislocation density is valuable, but electrical impurities, vacancy complexes and surface damage can still limit device performance. Conducting and semi-insulating wafers require different specifications, and one growth process may not optimize both simultaneously. Suppliers must provide detailed characterization rather than relying on a single material-quality number to secure high-reliability customer acceptance.

Alternative carriers remain deeply embedded in fabrication

Many GaN electronic devices are manufactured through epitaxy on silicon, sapphire or silicon carbide because these substrates offer established processing capacity and favorable cost structures. Native GaN must deliver enough benefit to justify process changes, new qualification and higher material expense. This competition restrains the conversion of broad GaN semiconductor growth into direct bulk GaN substrate revenue.

Qualification and equipment compatibility delay adoption

A new wafer diameter or electrical specification can require changes to epitaxial reactors, handling tools, metrology and device recipes. Customers may spend several development cycles confirming yield before authorizing production orders. Even when a supplier has demonstrated a promising crystal, the transition to a commercially accepted wafer depends on repeatable batches and validated downstream processing.

MARKET OPPORTUNITIES

Six-inch development could unlock new processing lines

Research toward 6-inch native GaN wafers aims to improve compatibility with higher-throughput semiconductor manufacturing. If crystal quality and cost per usable area become competitive, the larger format may attract device makers that cannot economically use smaller wafers. The opportunity is substantial but remains conditional on industrial-scale yield rather than the mere existence of demonstration samples.

Specialized conductivity grades support new device structures

Semi-insulating and deliberately doped native GaN substrates can enable experiments in high-frequency or vertical electronic devices that need specific electrical behavior. Materials companies can differentiate by controlling impurities and resistivity over the wafer area. Customers may pay for these specifications even in low volumes, creating a technically demanding specialty segment within the broader substrate market.

Lower-loss slicing may improve wafer economics

Improved crystal cutting and substrate recovery could reduce the amount of expensive bulk GaN consumed for each usable device layer. Research into laser-assisted slicing illustrates one approach, although the cost benefit depends on surface recovery and repeated processing yield. Manufacturers that combine growth improvements with better wafering can lower the barrier to native substrate adoption.

Joint materials and device qualification can accelerate demand

A substrate supplier working directly with laser or power-device developers can identify which crystal defects and surface characteristics matter most to commercial yield. Shared test programs reduce the risk of optimizing properties that do not translate into device benefits. These partnerships can also create longer-term purchasing relationships when a specific wafer specification becomes embedded in an approved manufacturing process.

Supply Chain Analysis

The native GaN substrate chain runs from gallium and nitrogen precursors through bulk crystal growth, boule preparation, wafer slicing, polishing and inspection. Customers then use the accepted wafer as the base for epitaxial layers and semiconductor device fabrication. A supplier may specialize in only one stage, so the value of a finished laser or power device must not be counted as bulk substrate revenue.

UpstreamHigh-purity gallium precursors, nitrogen chemistry, growth equipment and seed crystals establish the material and process inputs for native GaN crystal production.
Crystal growthHVPE and ammonothermal processes produce bulk GaN material with properties determined by growth conditions, impurity control and crystallographic orientation.
Wafer preparationBoule slicing, grinding, chemical-mechanical polishing and defect inspection convert grown material into specified conducting or semi-insulating substrates.
DownstreamLaser-diode, LED, power-device and research fabs deposit device structures onto native wafers and qualify electrical or optical performance.

Feedstock and seeds. Bulk GaN production begins with appropriate growth chemistry and crystalline seeds, whose purity and orientation influence the resulting boule. Suppliers must control process conditions to avoid introducing unwanted defects or electrical impurities. Reliable upstream materials support consistent wafer lots, while changes in precursor quality may require additional characterization before a customer accepts the output.

Growth-process differentiation. HVPE and ammonothermal crystal growth have different operating conditions and manufacturing trade-offs. High growth rates can improve throughput, but crystal stress, defects and impurity incorporation still determine usable material. Vendors develop proprietary process expertise over many years, and technical advantages must be demonstrated on finished wafers rather than inferred solely from growth equipment specifications.

Finishing and metrology. Cutting a crystal into wafers introduces surface damage that must be removed before device epitaxy. Polishing quality, thickness variation and wafer bow can influence subsequent processing, making inspection a commercial necessity. A substrate vendor capable of supplying detailed maps of defects and electrical properties reduces uncertainty for customers working with expensive or highly sensitive device structures.

Device integration. The final wafer purchaser chooses native GaN when the expected optical or electrical benefits outweigh the substrate premium and process changes. Laser manufacturers may have established recipes, whereas emerging vertical power-device teams often need experimental structures and extended reliability studies. These different requirements produce distinct sales cycles within the same materials category.

Recent Developments in the Gallium Nitride Single Crystal Substrates Market

  • 18 May 2026 Announced
    Sumitomo Chemical confirmed plans to exhibit native GaN substrates and high-purity GaN-on-GaN epitaxial wafers at PCIM Europe 2026. The company distinguished its mass-produced 2-inch and 4-inch GaN substrates from 6-inch material still under development. This provides a useful indication of the commercial diameter transition while avoiding the assumption that a larger prototype format already represents high-volume substrate supply. Source
  • 29 April 2025 Reported
    Fraunhofer IAF described a 1200V bidirectional GaN switch developed with its GaN-on-insulator technology, together with broader power electronics research. The announcement is adjacent evidence of expanding GaN device engineering rather than a native bulk substrate shipment. It illustrates why substrate demand forecasts must distinguish GaN devices grown on foreign carriers from applications that specifically require a single-crystal GaN wafer. Source
  • 11 April 2025 Announced
    Sumitomo Chemical outlined its GaN substrate and GaN-on-GaN epitaxial wafer exhibit for PCIM Europe 2025, describing larger-diameter crystal development alongside established laser-oriented production. The announcement indicates continued investment in wafer size and material quality. It does not provide an audited global market value or demonstrate that every displayed wafer format had completed qualification for commercial power-device manufacturing. Source
  • 19 March 2025 Published
    A Nature Materials paper reported wafer-scale hexagonal boron nitride growth on a GaN substrate, demonstrating a research use of GaN material as a crystalline platform for additional structures. The finding is relevant to future materials engineering and interface quality, but it should be treated as an adjacent scientific development rather than evidence of broad commercial demand for native GaN substrates. Source
  • 11 March 2025 Announced
    Sumitomo Chemical said it would show GaN substrates and high-purity GaN-on-GaN epitaxial wafers at the APEC 2025 exposition, with potential applications in next-generation power electronics. The material portfolio linked existing laser-substrate expertise to emerging electrical devices. Commercial significance depends on customer process qualification and repeatable wafer quality, not on the number of prospective application categories described at a trade event. Source
  • 20 November 2024 Announced
    Sumitomo Chemical reported that a project to accelerate large-diameter GaN-on-GaN wafer technology had been selected for support under a Japanese NEDO energy-conservation program. The effort targets production technology for 6-inch material suitable for power electronics. Public research support reduces development barriers, but industrial availability still requires reliable boule growth, wafer preparation and qualification at the intended device maker. Source
  • 2024–2027 Published
    The Polish Institute of High Pressure Physics described a multiyear project investigating semi-insulating and potentially p-type native GaN substrates through implantation and high-pressure annealing. The research addresses electrical-property control after crystal growth, an issue relevant to specialized electronic applications. Project objectives should be distinguished from commercially qualified wafer specifications, and public grant funding is not counted as market sales. Source

REPORT SCOPE & SEGMENTATION

Attribute Details
Study Period 2021–2034
Base Year 2025
Estimated Year 2026
Forecast Period 2026–2034
Historical Period 2021–2024
Market Size 2025 USD 20.11 million
Market Size 2026 USD 23.86 million
Market Size 2034 USD 93.39 million
Growth Rate CAGR of 18.6% during 2026–2034
Unit Value (USD Million), wafer diameter in inches
Segmentation By Type, By Application, and By Region
By Type 2 Inches · 4 Inches · Other
By Application LED · Laser Diodes · Power Electronic Devices · Others
By Region Each region analyzed by wafer size, application and principal customer country
North AmericaUnited States, Canada, Mexico
EuropeGermany, Poland, France, United Kingdom, Rest of Europe
Asia-PacificJapan, China, South Korea, Taiwan, Rest of Asia-Pacific
South AmericaBrazil, Argentina, Chile, Colombia, Rest of South America
Middle East & AfricaSaudi Arabia, UAE, South Africa, Egypt, Rest of Middle East & Africa
Key Companies Profiled Sumitomo Electric Device Innovations (SCIOCS), Okmetic, BTOZ, Suzhou Nanowin Science and Technology, Sanan Optoelectronics, Sino Nitride Semiconductor, WAFER WORKS, Toyoda Gosei, Mitsubishi Chemical, Kyma Technologies, Eta Research Ltd, Goetsu Semiconductor Wuxi
Customization Scope Customized analysis can isolate bulk crystal growth, conducting or semi-insulating grades, wafer diameter, optical versus power-device applications and selected country markets, with the transaction boundary specified for each project.

Frequently Asked Questions

What is the size of the native GaN single-crystal substrate market?

The global market was valued at USD 20.11 million in 2025 and is projected to reach USD 93.39 million by 2034, growing at a 18.6% CAGR during 2026–2034. These values concern native bulk GaN substrates rather than every GaN epitaxial wafer or finished device. The forecast reflects laser demand and development of larger, higher-quality material for electronic applications.

What distinguishes a single-crystal GaN substrate from an epiwafer?

A native GaN substrate is a freestanding wafer made from bulk gallium nitride crystal, while an epiwafer includes a semiconductor layer grown on a carrier that may be silicon, sapphire, SiC or GaN. The distinction matters commercially because epitaxial processing adds value beyond the bare substrate. Native GaN can reduce lattice mismatch for selected device structures, but its fabrication cost is generally higher.

Which substrate diameter has the largest share?

The 2 Inches class leads with an estimated ~58% of 2025 revenue because of established laser-diode production and proven handling processes. Four-inch wafers account for ~33% and grow faster at ~21.5% CAGR as larger-format production develops. Other sizes hold ~9%, including specialized research pieces and larger demonstration formats that have not necessarily reached qualified mass production.

Which application consumes the most native GaN wafers?

Laser Diodes hold an estimated ~45% of 2025 demand, followed by LED uses at ~30%, Power Electronic Devices at ~18% and other specialized applications at ~7%. The laser market has established material specifications, while power electronics offers faster modeled growth near ~23.0% CAGR. Most general GaN semiconductor output still uses alternative carrier technologies rather than native bulk GaN.

Which region leads substrate production and demand?

Asia-Pacific accounts for an estimated ~43% of the base-year market and grows near ~19.7% CAGR. Japanese suppliers have commercial native GaN wafer experience, and Chinese manufacturers provide additional self-supporting substrate options. North America follows at ~26% through specialized device and research demand, while Europe holds ~20% with crystal-growth science and compound-semiconductor development.

Why are native GaN substrates more expensive than silicon wafers?

Bulk GaN crystal growth requires specialized chemistry, equipment and defect control, and saleable wafers must be sliced and polished from expensive boules. Lower yields and smaller qualified diameters raise effective cost per usable device area. Silicon benefits from far more mature, large-scale production infrastructure, so native GaN must deliver meaningful optical or electrical advantages to justify its premium.

What manufacturing methods are used for bulk GaN?

Hydride vapor phase epitaxy can produce thick GaN crystal material, while ammonothermal methods grow crystals in high-pressure chemical environments. Each process has different trade-offs involving growth rate, impurity incorporation, stress and defect density. Subsequent wafering and polishing are essential because even a high-quality boule can produce substrates with unacceptable bow, surface damage or electrical nonuniformity.

What limits six-inch GaN wafer commercialization?

A 6-inch crystal demonstration does not establish a dependable production wafer supply. Manufacturers must reproduce acceptable defect density across the larger area, control slicing and polishing losses, and show that device fabrication tools can process the material economically. Customer qualification of electrical properties and downstream device yield is required before the larger format can displace established 2-inch or 4-inch production.

Who supplies native GaN single-crystal material?

Established product documentation is available from Sumitomo Chemical and SCIOCS, Mitsubishi Chemical and Suzhou Nanowin, with additional specialist companies active in compound-semiconductor substrates and crystal growth. Their capabilities vary by diameter, conductivity, surface specification and production maturity. A company supplying GaN power devices or GaN-on-silicon epiwafers should not automatically be classified as a bulk native GaN crystal producer.

What geographic and product coverage is included?

The analysis uses 2025 as the base year, 2026 as the estimate and 2034 as the forecast endpoint, with historical context from 2021 through 2024. It covers 2-inch, 4-inch and other native GaN substrates; LED, laser-diode, power-device and other applications; and five world regions. Crystal growth, wafer finishing, supplier positioning and customer qualification are addressed.

Research Sources & Evidence Base

View research sources used for this overview
  1. Sumitomo Chemical. PCIM Europe 2026 GaN substrate exhibit, 18 May 2026 announcement distinguishing mass-produced 2-inch and 4-inch GaN from 6-inch development.
  2. Sumitomo Chemical. PCIM Europe 2025 compound semiconductor materials, 11 April 2025 description of GaN substrate and GaN-on-GaN development.
  3. Sumitomo Chemical. APEC 2025 GaN substrate exhibit, 11 March 2025 technical and commercial context for optical and power-device wafers.
  4. Sumitomo Chemical. Large-diameter GaN-on-GaN wafer development, 20 November 2024 NEDO-backed six-inch mass-production technology program.
  5. SCIOCS. GaN substrates product specifications, available 2-inch and 4-inch n-type GaN and 2-inch semi-insulating material.
  6. Mitsubishi Chemical. GaN wafer product information, HVPE-grown single-crystal substrate and ammonothermal SCAAT development.
  7. Mitsubishi Chemical. Semiconductor solutions for power devices, GaN substrate offering and device-manufacturing material context.
  8. Suzhou Nanowin. Native GaN wafer product range, self-supporting GaN wafer sizes and dopant options.
  9. Suzhou Nanowin. Company crystal-growth capabilities, single-crystal GaN growth, wafer processing and development history.
  10. Institute of High Pressure Physics PAS. Semi-insulating GaN substrate research project, 2024–2027 research on implanted dopants and high-pressure annealing.
  11. Institute of High Pressure Physics PAS. Point defects in ammonothermal gallium nitride, bulk GaN electrical-property and impurity research.
  12. Institute of High Pressure Physics PAS. Ammonothermal GaN solubility project, high-pressure crystal-growth chemistry and substrate research.
  13. Fraunhofer IAF. GaN high-frequency electronics portfolio, device processing and substrate material options, adjacent application evidence.
  14. Scientific Reports. Laser slice thinning of GaN-on-GaN HEMTs, 2022 research on native GaN substrate reuse and wafer cost.
  15. Fraunhofer IAF. Bidirectional 1200V GaN switch, 29 April 2025 power-device research context; not direct bulk substrate revenue.
  16. Nature Materials. Wafer-scale boron nitride grown on GaN substrate, 19 March 2025 materials-science application of GaN substrates.
Gallium Nitride Single Crystal Substrates Market, Size, Trends, Business Strategies 2026-2034

Get Sample Report PDF for Exclusive Insights

Report Sample Includes

  • Table of Contents
  • List of Tables & Figures
  • Charts, Research Methodology, and more...

PDF Icon Download Sample Report PDF

Download Sample Report

Table of Content

Table of Contents
1 Research Methodology and Statistical Scope
1.1 Market Definition and Statistical Scope of Gallium Nitride Single Crystal Substrates
1.2 Key Market Segments
1.2.1 Gallium Nitride Single Crystal Substrates Segment by Type
1.2.2 Gallium Nitride Single Crystal Substrates Segment by Application
1.3 Methodology & Sources of Information
1.3.1 Research Methodology
1.3.2 Research Process
1.3.3 Market Breakdown and Data Triangulation
1.3.4 Base Year
1.3.5 Report Assumptions & Caveats
2 Gallium Nitride Single Crystal Substrates Market Overview
2.1 Global Market Overview
2.1.1 Global Gallium Nitride Single Crystal Substrates Market Size (M USD) Estimates and Forecasts (2026-2034)
2.1.2 Global Gallium Nitride Single Crystal Substrates Sales Estimates and Forecasts (2026-2034)
2.2 Market Segment Executive Summary
2.3 Global Market Size by Region
3 Gallium Nitride Single Crystal Substrates Market Competitive Landscape
3.1 Global Gallium Nitride Single Crystal Substrates Sales by Manufacturers (2019-2025)
3.2 Global Gallium Nitride Single Crystal Substrates Revenue Market Share by Manufacturers (2019-2025)
3.3 Gallium Nitride Single Crystal Substrates Market Share by Company Type (Tier 1, Tier 2, and Tier 3)
3.4 Global Gallium Nitride Single Crystal Substrates Average Price by Manufacturers (2019-2025)
3.5 Manufacturers Gallium Nitride Single Crystal Substrates Sales Sites, Area Served, Product Type
3.6 Gallium Nitride Single Crystal Substrates Market Competitive Situation and Trends
3.6.1 Gallium Nitride Single Crystal Substrates Market Concentration Rate
3.6.2 Global 5 and 10 Largest Gallium Nitride Single Crystal Substrates Players Market Share by Revenue
3.6.3 Mergers & Acquisitions, Expansion
4 Gallium Nitride Single Crystal Substrates Industry Chain Analysis
4.1 Gallium Nitride Single Crystal Substrates Industry Chain Analysis
4.2 Market Overview of Key Raw Materials
4.3 Midstream Market Analysis
4.4 Downstream Customer Analysis
5 The Development and Dynamics of Gallium Nitride Single Crystal Substrates Market
5.1 Key Development Trends
5.2 Driving Factors
5.3 Market Challenges
5.4 Market Restraints
5.5 Industry News
5.5.1 New Product Developments
5.5.2 Mergers & Acquisitions
5.5.3 Expansions
5.5.4 Collaboration/Supply Contracts
5.6 Industry Policies
6 Gallium Nitride Single Crystal Substrates Market Segmentation by Type
6.1 Evaluation Matrix of Segment Market Development Potential (Type)
6.2 Global Gallium Nitride Single Crystal Substrates Sales Market Share by Type (2019-2025)
6.3 Global Gallium Nitride Single Crystal Substrates Market Size Market Share by Type (2019-2025)
6.4 Global Gallium Nitride Single Crystal Substrates Price by Type (2019-2025)
7 Gallium Nitride Single Crystal Substrates Market Segmentation by Application
7.1 Evaluation Matrix of Segment Market Development Potential (Application)
7.2 Global Gallium Nitride Single Crystal Substrates Market Sales by Application (2019-2025)
7.3 Global Gallium Nitride Single Crystal Substrates Market Size (M USD) by Application (2019-2025)
7.4 Global Gallium Nitride Single Crystal Substrates Sales Growth Rate by Application (2019-2025)
8 Gallium Nitride Single Crystal Substrates Market Segmentation by Region
8.1 Global Gallium Nitride Single Crystal Substrates Sales by Region
8.1.1 Global Gallium Nitride Single Crystal Substrates Sales by Region
8.1.2 Global Gallium Nitride Single Crystal Substrates Sales Market Share by Region
8.2 North America
8.2.1 North America Gallium Nitride Single Crystal Substrates Sales by Country
8.2.2 U.S.
8.2.3 Canada
8.2.4 Mexico
8.3 Europe
8.3.1 Europe Gallium Nitride Single Crystal Substrates Sales by Country
8.3.2 Germany
8.3.3 France
8.3.4 U.K.
8.3.5 Italy
8.3.6 Russia
8.4 Asia Pacific
8.4.1 Asia Pacific Gallium Nitride Single Crystal Substrates Sales by Region
8.4.2 China
8.4.3 Japan
8.4.4 South Korea
8.4.5 India
8.4.6 Southeast Asia
8.5 South America
8.5.1 South America Gallium Nitride Single Crystal Substrates Sales by Country
8.5.2 Brazil
8.5.3 Argentina
8.5.4 Columbia
8.6 Middle East and Africa
8.6.1 Middle East and Africa Gallium Nitride Single Crystal Substrates Sales by Region
8.6.2 Saudi Arabia
8.6.3 UAE
8.6.4 Egypt
8.6.5 Nigeria
8.6.6 South Africa
9 Key Companies Profile
9.1 Sumitomo Electric Device Innovations (SEDI) (SCIOCS)
9.1.1 Sumitomo Electric Device Innovations (SEDI) (SCIOCS) Gallium Nitride Single Crystal Substrates Basic Information
9.1.2 Sumitomo Electric Device Innovations (SEDI) (SCIOCS) Gallium Nitride Single Crystal Substrates Product Overview
9.1.3 Sumitomo Electric Device Innovations (SEDI) (SCIOCS) Gallium Nitride Single Crystal Substrates Product Market Performance
9.1.4 Sumitomo Electric Device Innovations (SEDI) (SCIOCS) Business Overview
9.1.5 Sumitomo Electric Device Innovations (SEDI) (SCIOCS) Gallium Nitride Single Crystal Substrates SWOT Analysis
9.1.6 Sumitomo Electric Device Innovations (SEDI) (SCIOCS) Recent Developments
9.2 Okmetic
9.2.1 Okmetic Gallium Nitride Single Crystal Substrates Basic Information
9.2.2 Okmetic Gallium Nitride Single Crystal Substrates Product Overview
9.2.3 Okmetic Gallium Nitride Single Crystal Substrates Product Market Performance
9.2.4 Okmetic Business Overview
9.2.5 Okmetic Gallium Nitride Single Crystal Substrates SWOT Analysis
9.2.6 Okmetic Recent Developments
9.3 BTOZ
9.3.1 BTOZ Gallium Nitride Single Crystal Substrates Basic Information
9.3.2 BTOZ Gallium Nitride Single Crystal Substrates Product Overview
9.3.3 BTOZ Gallium Nitride Single Crystal Substrates Product Market Performance
9.3.4 BTOZ Gallium Nitride Single Crystal Substrates SWOT Analysis
9.3.5 BTOZ Business Overview
9.3.6 BTOZ Recent Developments
9.4 Suzhou Nanowin Science and Technology
9.4.1 Suzhou Nanowin Science and Technology Gallium Nitride Single Crystal Substrates Basic Information
9.4.2 Suzhou Nanowin Science and Technology Gallium Nitride Single Crystal Substrates Product Overview
9.4.3 Suzhou Nanowin Science and Technology Gallium Nitride Single Crystal Substrates Product Market Performance
9.4.4 Suzhou Nanowin Science and Technology Business Overview
9.4.5 Suzhou Nanowin Science and Technology Recent Developments
9.5 Sanan Optoelectronics
9.5.1 Sanan Optoelectronics Gallium Nitride Single Crystal Substrates Basic Information
9.5.2 Sanan Optoelectronics Gallium Nitride Single Crystal Substrates Product Overview
9.5.3 Sanan Optoelectronics Gallium Nitride Single Crystal Substrates Product Market Performance
9.5.4 Sanan Optoelectronics Business Overview
9.5.5 Sanan Optoelectronics Recent Developments
9.6 Sino Nitride Semiconductor
9.6.1 Sino Nitride Semiconductor Gallium Nitride Single Crystal Substrates Basic Information
9.6.2 Sino Nitride Semiconductor Gallium Nitride Single Crystal Substrates Product Overview
9.6.3 Sino Nitride Semiconductor Gallium Nitride Single Crystal Substrates Product Market Performance
9.6.4 Sino Nitride Semiconductor Business Overview
9.6.5 Sino Nitride Semiconductor Recent Developments
9.7 WAFER WORKS
9.7.1 WAFER WORKS Gallium Nitride Single Crystal Substrates Basic Information
9.7.2 WAFER WORKS Gallium Nitride Single Crystal Substrates Product Overview
9.7.3 WAFER WORKS Gallium Nitride Single Crystal Substrates Product Market Performance
9.7.4 WAFER WORKS Business Overview
9.7.5 WAFER WORKS Recent Developments
9.8 Toyoda Gosei
9.8.1 Toyoda Gosei Gallium Nitride Single Crystal Substrates Basic Information
9.8.2 Toyoda Gosei Gallium Nitride Single Crystal Substrates Product Overview
9.8.3 Toyoda Gosei Gallium Nitride Single Crystal Substrates Product Market Performance
9.8.4 Toyoda Gosei Business Overview
9.8.5 Toyoda Gosei Recent Developments
9.9 Mitsubishi Chemical
9.9.1 Mitsubishi Chemical Gallium Nitride Single Crystal Substrates Basic Information
9.9.2 Mitsubishi Chemical Gallium Nitride Single Crystal Substrates Product Overview
9.9.3 Mitsubishi Chemical Gallium Nitride Single Crystal Substrates Product Market Performance
9.9.4 Mitsubishi Chemical Business Overview
9.9.5 Mitsubishi Chemical Recent Developments
9.10 Kyma Technologies
9.10.1 Kyma Technologies Gallium Nitride Single Crystal Substrates Basic Information
9.10.2 Kyma Technologies Gallium Nitride Single Crystal Substrates Product Overview
9.10.3 Kyma Technologies Gallium Nitride Single Crystal Substrates Product Market Performance
9.10.4 Kyma Technologies Business Overview
9.10.5 Kyma Technologies Recent Developments
9.11 Eta Research Ltd
9.11.1 Eta Research Ltd Gallium Nitride Single Crystal Substrates Basic Information
9.11.2 Eta Research Ltd Gallium Nitride Single Crystal Substrates Product Overview
9.11.3 Eta Research Ltd Gallium Nitride Single Crystal Substrates Product Market Performance
9.11.4 Eta Research Ltd Business Overview
9.11.5 Eta Research Ltd Recent Developments
9.12 Goetsu Semiconductor Wuxi
9.12.1 Goetsu Semiconductor Wuxi Gallium Nitride Single Crystal Substrates Basic Information
9.12.2 Goetsu Semiconductor Wuxi Gallium Nitride Single Crystal Substrates Product Overview
9.12.3 Goetsu Semiconductor Wuxi Gallium Nitride Single Crystal Substrates Product Market Performance
9.12.4 Goetsu Semiconductor Wuxi Business Overview
9.12.5 Goetsu Semiconductor Wuxi Recent Developments
10 Gallium Nitride Single Crystal Substrates Market Forecast by Region
10.1 Global Gallium Nitride Single Crystal Substrates Market Size Forecast
10.2 Global Gallium Nitride Single Crystal Substrates Market Forecast by Region
10.2.1 North America Market Size Forecast by Country
10.2.2 Europe Gallium Nitride Single Crystal Substrates Market Size Forecast by Country
10.2.3 Asia Pacific Gallium Nitride Single Crystal Substrates Market Size Forecast by Region
10.2.4 South America Gallium Nitride Single Crystal Substrates Market Size Forecast by Country
10.2.5 Middle East and Africa Forecasted Consumption of Gallium Nitride Single Crystal Substrates by Country
11 Forecast Market by Type and by Application (2025-2030)
11.1 Global Gallium Nitride Single Crystal Substrates Market Forecast by Type (2025-2030)
11.1.1 Global Forecasted Sales of Gallium Nitride Single Crystal Substrates by Type (2025-2030)
11.1.2 Global Gallium Nitride Single Crystal Substrates Market Size Forecast by Type (2025-2030)
11.1.3 Global Forecasted Price of Gallium Nitride Single Crystal Substrates by Type (2025-2030)
11.2 Global Gallium Nitride Single Crystal Substrates Market Forecast by Application (2025-2030)
11.2.1 Global Gallium Nitride Single Crystal Substrates Sales (K Units) Forecast by Application
11.2.2 Global Gallium Nitride Single Crystal Substrates Market Size (M USD) Forecast by Application (2025-2030)
12 Conclusion and Key FindingsList of Tables
Table 1. Introduction of the Type
Table 2. Introduction of the Application
Table 3. Market Size (M USD) Segment Executive Summary
Table 4. Gallium Nitride Single Crystal Substrates Market Size Comparison by Region (M USD)
Table 5. Global Gallium Nitride Single Crystal Substrates Sales (K Units) by Manufacturers (2019-2025)
Table 6. Global Gallium Nitride Single Crystal Substrates Sales Market Share by Manufacturers (2019-2025)
Table 7. Global Gallium Nitride Single Crystal Substrates Revenue (M USD) by Manufacturers (2019-2025)
Table 8. Global Gallium Nitride Single Crystal Substrates Revenue Share by Manufacturers (2019-2025)
Table 9. Company Type (Tier 1, Tier 2, and Tier 3) & (based on the Revenue in Gallium Nitride Single Crystal Substrates as of 2022)
Table 10. Global Market Gallium Nitride Single Crystal Substrates Average Price (USD/Unit) of Key Manufacturers (2019-2025)
Table 11. Manufacturers Gallium Nitride Single Crystal Substrates Sales Sites and Area Served
Table 12. Manufacturers Gallium Nitride Single Crystal Substrates Product Type
Table 13. Global Gallium Nitride Single Crystal Substrates Manufacturers Market Concentration Ratio (CR5 and HHI)
Table 14. Mergers & Acquisitions, Expansion Plans
Table 15. Industry Chain Map of Gallium Nitride Single Crystal Substrates
Table 16. Market Overview of Key Raw Materials
Table 17. Midstream Market Analysis
Table 18. Downstream Customer Analysis
Table 19. Key Development Trends
Table 20. Driving Factors
Table 21. Gallium Nitride Single Crystal Substrates Market Challenges
Table 22. Global Gallium Nitride Single Crystal Substrates Sales by Type (K Units)
Table 23. Global Gallium Nitride Single Crystal Substrates Market Size by Type (M USD)
Table 24. Global Gallium Nitride Single Crystal Substrates Sales (K Units) by Type (2019-2025)
Table 25. Global Gallium Nitride Single Crystal Substrates Sales Market Share by Type (2019-2025)
Table 26. Global Gallium Nitride Single Crystal Substrates Market Size (M USD) by Type (2019-2025)
Table 27. Global Gallium Nitride Single Crystal Substrates Market Size Share by Type (2019-2025)
Table 28. Global Gallium Nitride Single Crystal Substrates Price (USD/Unit) by Type (2019-2025)
Table 29. Global Gallium Nitride Single Crystal Substrates Sales (K Units) by Application
Table 30. Global Gallium Nitride Single Crystal Substrates Market Size by Application
Table 31. Global Gallium Nitride Single Crystal Substrates Sales by Application (2019-2025) & (K Units)
Table 32. Global Gallium Nitride Single Crystal Substrates Sales Market Share by Application (2019-2025)
Table 33. Global Gallium Nitride Single Crystal Substrates Sales by Application (2019-2025) & (M USD)
Table 34. Global Gallium Nitride Single Crystal Substrates Market Share by Application (2019-2025)
Table 35. Global Gallium Nitride Single Crystal Substrates Sales Growth Rate by Application (2019-2025)
Table 36. Global Gallium Nitride Single Crystal Substrates Sales by Region (2019-2025) & (K Units)
Table 37. Global Gallium Nitride Single Crystal Substrates Sales Market Share by Region (2019-2025)
Table 38. North America Gallium Nitride Single Crystal Substrates Sales by Country (2019-2025) & (K Units)
Table 39. Europe Gallium Nitride Single Crystal Substrates Sales by Country (2019-2025) & (K Units)
Table 40. Asia Pacific Gallium Nitride Single Crystal Substrates Sales by Region (2019-2025) & (K Units)
Table 41. South America Gallium Nitride Single Crystal Substrates Sales by Country (2019-2025) & (K Units)
Table 42. Middle East and Africa Gallium Nitride Single Crystal Substrates Sales by Region (2019-2025) & (K Units)
Table 43. Sumitomo Electric Device Innovations (SEDI) (SCIOCS) Gallium Nitride Single Crystal Substrates Basic Information
Table 44. Sumitomo Electric Device Innovations (SEDI) (SCIOCS) Gallium Nitride Single Crystal Substrates Product Overview
Table 45. Sumitomo Electric Device Innovations (SEDI) (SCIOCS) Gallium Nitride Single Crystal Substrates Sales (K Units), Revenue (M USD), Price (USD/Unit) and Gross Margin (2019-2025)
Table 46. Sumitomo Electric Device Innovations (SEDI) (SCIOCS) Business Overview
Table 47. Sumitomo Electric Device Innovations (SEDI) (SCIOCS) Gallium Nitride Single Crystal Substrates SWOT Analysis
Table 48. Sumitomo Electric Device Innovations (SEDI) (SCIOCS) Recent Developments
Table 49. Okmetic Gallium Nitride Single Crystal Substrates Basic Information
Table 50. Okmetic Gallium Nitride Single Crystal Substrates Product Overview
Table 51. Okmetic Gallium Nitride Single Crystal Substrates Sales (K Units), Revenue (M USD), Price (USD/Unit) and Gross Margin (2019-2025)
Table 52. Okmetic Business Overview
Table 53. Okmetic Gallium Nitride Single Crystal Substrates SWOT Analysis
Table 54. Okmetic Recent Developments
Table 55. BTOZ Gallium Nitride Single Crystal Substrates Basic Information
Table 56. BTOZ Gallium Nitride Single Crystal Substrates Product Overview
Table 57. BTOZ Gallium Nitride Single Crystal Substrates Sales (K Units), Revenue (M USD), Price (USD/Unit) and Gross Margin (2019-2025)
Table 58. BTOZ Gallium Nitride Single Crystal Substrates SWOT Analysis
Table 59. BTOZ Business Overview
Table 60. BTOZ Recent Developments
Table 61. Suzhou Nanowin Science and Technology Gallium Nitride Single Crystal Substrates Basic Information
Table 62. Suzhou Nanowin Science and Technology Gallium Nitride Single Crystal Substrates Product Overview
Table 63. Suzhou Nanowin Science and Technology Gallium Nitride Single Crystal Substrates Sales (K Units), Revenue (M USD), Price (USD/Unit) and Gross Margin (2019-2025)
Table 64. Suzhou Nanowin Science and Technology Business Overview
Table 65. Suzhou Nanowin Science and Technology Recent Developments
Table 66. Sanan Optoelectronics Gallium Nitride Single Crystal Substrates Basic Information
Table 67. Sanan Optoelectronics Gallium Nitride Single Crystal Substrates Product Overview
Table 68. Sanan Optoelectronics Gallium Nitride Single Crystal Substrates Sales (K Units), Revenue (M USD), Price (USD/Unit) and Gross Margin (2019-2025)
Table 69. Sanan Optoelectronics Business Overview
Table 70. Sanan Optoelectronics Recent Developments
Table 71. Sino Nitride Semiconductor Gallium Nitride Single Crystal Substrates Basic Information
Table 72. Sino Nitride Semiconductor Gallium Nitride Single Crystal Substrates Product Overview
Table 73. Sino Nitride Semiconductor Gallium Nitride Single Crystal Substrates Sales (K Units), Revenue (M USD), Price (USD/Unit) and Gross Margin (2019-2025)
Table 74. Sino Nitride Semiconductor Business Overview
Table 75. Sino Nitride Semiconductor Recent Developments
Table 76. WAFER WORKS Gallium Nitride Single Crystal Substrates Basic Information
Table 77. WAFER WORKS Gallium Nitride Single Crystal Substrates Product Overview
Table 78. WAFER WORKS Gallium Nitride Single Crystal Substrates Sales (K Units), Revenue (M USD), Price (USD/Unit) and Gross Margin (2019-2025)
Table 79. WAFER WORKS Business Overview
Table 80. WAFER WORKS Recent Developments
Table 81. Toyoda Gosei Gallium Nitride Single Crystal Substrates Basic Information
Table 82. Toyoda Gosei Gallium Nitride Single Crystal Substrates Product Overview
Table 83. Toyoda Gosei Gallium Nitride Single Crystal Substrates Sales (K Units), Revenue (M USD), Price (USD/Unit) and Gross Margin (2019-2025)
Table 84. Toyoda Gosei Business Overview
Table 85. Toyoda Gosei Recent Developments
Table 86. Mitsubishi Chemical Gallium Nitride Single Crystal Substrates Basic Information
Table 87. Mitsubishi Chemical Gallium Nitride Single Crystal Substrates Product Overview
Table 88. Mitsubishi Chemical Gallium Nitride Single Crystal Substrates Sales (K Units), Revenue (M USD), Price (USD/Unit) and Gross Margin (2019-2025)
Table 89. Mitsubishi Chemical Business Overview
Table 90. Mitsubishi Chemical Recent Developments
Table 91. Kyma Technologies Gallium Nitride Single Crystal Substrates Basic Information
Table 92. Kyma Technologies Gallium Nitride Single Crystal Substrates Product Overview
Table 93. Kyma Technologies Gallium Nitride Single Crystal Substrates Sales (K Units), Revenue (M USD), Price (USD/Unit) and Gross Margin (2019-2025)
Table 94. Kyma Technologies Business Overview
Table 95. Kyma Technologies Recent Developments
Table 96. Eta Research Ltd Gallium Nitride Single Crystal Substrates Basic Information
Table 97. Eta Research Ltd Gallium Nitride Single Crystal Substrates Product Overview
Table 98. Eta Research Ltd Gallium Nitride Single Crystal Substrates Sales (K Units), Revenue (M USD), Price (USD/Unit) and Gross Margin (2019-2025)
Table 99. Eta Research Ltd Business Overview
Table 100. Eta Research Ltd Recent Developments
Table 101. Goetsu Semiconductor Wuxi Gallium Nitride Single Crystal Substrates Basic Information
Table 102. Goetsu Semiconductor Wuxi Gallium Nitride Single Crystal Substrates Product Overview
Table 103. Goetsu Semiconductor Wuxi Gallium Nitride Single Crystal Substrates Sales (K Units), Revenue (M USD), Price (USD/Unit) and Gross Margin (2019-2025)
Table 104. Goetsu Semiconductor Wuxi Business Overview
Table 105. Goetsu Semiconductor Wuxi Recent Developments
Table 106. Global Gallium Nitride Single Crystal Substrates Sales Forecast by Region (2025-2030) & (K Units)
Table 107. Global Gallium Nitride Single Crystal Substrates Market Size Forecast by Region (2025-2030) & (M USD)
Table 108. North America Gallium Nitride Single Crystal Substrates Sales Forecast by Country (2025-2030) & (K Units)
Table 109. North America Gallium Nitride Single Crystal Substrates Market Size Forecast by Country (2025-2030) & (M USD)
Table 110. Europe Gallium Nitride Single Crystal Substrates Sales Forecast by Country (2025-2030) & (K Units)
Table 111. Europe Gallium Nitride Single Crystal Substrates Market Size Forecast by Country (2025-2030) & (M USD)
Table 112. Asia Pacific Gallium Nitride Single Crystal Substrates Sales Forecast by Region (2025-2030) & (K Units)
Table 113. Asia Pacific Gallium Nitride Single Crystal Substrates Market Size Forecast by Region (2025-2030) & (M USD)
Table 114. South America Gallium Nitride Single Crystal Substrates Sales Forecast by Country (2025-2030) & (K Units)
Table 115. South America Gallium Nitride Single Crystal Substrates Market Size Forecast by Country (2025-2030) & (M USD)
Table 116. Middle East and Africa Gallium Nitride Single Crystal Substrates Consumption Forecast by Country (2025-2030) & (Units)
Table 117. Middle East and Africa Gallium Nitride Single Crystal Substrates Market Size Forecast by Country (2025-2030) & (M USD)
Table 118. Global Gallium Nitride Single Crystal Substrates Sales Forecast by Type (2025-2030) & (K Units)
Table 119. Global Gallium Nitride Single Crystal Substrates Market Size Forecast by Type (2025-2030) & (M USD)
Table 120. Global Gallium Nitride Single Crystal Substrates Price Forecast by Type (2025-2030) & (USD/Unit)
Table 121. Global Gallium Nitride Single Crystal Substrates Sales (K Units) Forecast by Application (2025-2030)
Table 122. Global Gallium Nitride Single Crystal Substrates Market Size Forecast by Application (2025-2030) & (M USD)
List of Figures
Figure 1. Product Picture of Gallium Nitride Single Crystal Substrates
Figure 2. Data Triangulation
Figure 3. Key Caveats
Figure 4. Global Gallium Nitride Single Crystal Substrates Market Size (M USD), 2026-2034
Figure 5. Global Gallium Nitride Single Crystal Substrates Market Size (M USD) (2026-2034)
Figure 6. Global Gallium Nitride Single Crystal Substrates Sales (K Units) & (2026-2034)
Figure 7. Evaluation Matrix of Segment Market Development Potential (Type)
Figure 8. Evaluation Matrix of Segment Market Development Potential (Application)
Figure 9. Evaluation Matrix of Regional Market Development Potential
Figure 10. Gallium Nitride Single Crystal Substrates Market Size by Country (M USD)
Figure 11. Gallium Nitride Single Crystal Substrates Sales Share by Manufacturers in 2023
Figure 12. Global Gallium Nitride Single Crystal Substrates Revenue Share by Manufacturers in 2023
Figure 13. Gallium Nitride Single Crystal Substrates Market Share by Company Type (Tier 1, Tier 2 and Tier 3): 2023
Figure 14. Global Market Gallium Nitride Single Crystal Substrates Average Price (USD/Unit) of Key Manufacturers in 2023
Figure 15. The Global 5 and 10 Largest Players: Market Share by Gallium Nitride Single Crystal Substrates Revenue in 2023
Figure 16. Evaluation Matrix of Segment Market Development Potential (Type)
Figure 17. Global Gallium Nitride Single Crystal Substrates Market Share by Type
Figure 18. Sales Market Share of Gallium Nitride Single Crystal Substrates by Type (2019-2025)
Figure 19. Sales Market Share of Gallium Nitride Single Crystal Substrates by Type in 2023
Figure 20. Market Size Share of Gallium Nitride Single Crystal Substrates by Type (2019-2025)
Figure 21. Market Size Market Share of Gallium Nitride Single Crystal Substrates by Type in 2023
Figure 22. Evaluation Matrix of Segment Market Development Potential (Application)
Figure 23. Global Gallium Nitride Single Crystal Substrates Market Share by Application
Figure 24. Global Gallium Nitride Single Crystal Substrates Sales Market Share by Application (2019-2025)
Figure 25. Global Gallium Nitride Single Crystal Substrates Sales Market Share by Application in 2023
Figure 26. Global Gallium Nitride Single Crystal Substrates Market Share by Application (2019-2025)
Figure 27. Global Gallium Nitride Single Crystal Substrates Market Share by Application in 2023
Figure 28. Global Gallium Nitride Single Crystal Substrates Sales Growth Rate by Application (2019-2025)
Figure 29. Global Gallium Nitride Single Crystal Substrates Sales Market Share by Region (2019-2025)
Figure 30. North America Gallium Nitride Single Crystal Substrates Sales and Growth Rate (2019-2025) & (K Units)
Figure 31. North America Gallium Nitride Single Crystal Substrates Sales Market Share by Country in 2023
Figure 32. U.S. Gallium Nitride Single Crystal Substrates Sales and Growth Rate (2019-2025) & (K Units)
Figure 33. Canada Gallium Nitride Single Crystal Substrates Sales (K Units) and Growth Rate (2019-2025)
Figure 34. Mexico Gallium Nitride Single Crystal Substrates Sales (Units) and Growth Rate (2019-2025)
Figure 35. Europe Gallium Nitride Single Crystal Substrates Sales and Growth Rate (2019-2025) & (K Units)
Figure 36. Europe Gallium Nitride Single Crystal Substrates Sales Market Share by Country in 2023
Figure 37. Germany Gallium Nitride Single Crystal Substrates Sales and Growth Rate (2019-2025) & (K Units)
Figure 38. France Gallium Nitride Single Crystal Substrates Sales and Growth Rate (2019-2025) & (K Units)
Figure 39. U.K. Gallium Nitride Single Crystal Substrates Sales and Growth Rate (2019-2025) & (K Units)
Figure 40. Italy Gallium Nitride Single Crystal Substrates Sales and Growth Rate (2019-2025) & (K Units)
Figure 41. Russia Gallium Nitride Single Crystal Substrates Sales and Growth Rate (2019-2025) & (K Units)
Figure 42. Asia Pacific Gallium Nitride Single Crystal Substrates Sales and Growth Rate (K Units)
Figure 43. Asia Pacific Gallium Nitride Single Crystal Substrates Sales Market Share by Region in 2023
Figure 44. China Gallium Nitride Single Crystal Substrates Sales and Growth Rate (2019-2025) & (K Units)
Figure 45. Japan Gallium Nitride Single Crystal Substrates Sales and Growth Rate (2019-2025) & (K Units)
Figure 46. South Korea Gallium Nitride Single Crystal Substrates Sales and Growth Rate (2019-2025) & (K Units)
Figure 47. India Gallium Nitride Single Crystal Substrates Sales and Growth Rate (2019-2025) & (K Units)
Figure 48. Southeast Asia Gallium Nitride Single Crystal Substrates Sales and Growth Rate (2019-2025) & (K Units)
Figure 49. South America Gallium Nitride Single Crystal Substrates Sales and Growth Rate (K Units)
Figure 50. South America Gallium Nitride Single Crystal Substrates Sales Market Share by Country in 2023
Figure 51. Brazil Gallium Nitride Single Crystal Substrates Sales and Growth Rate (2019-2025) & (K Units)
Figure 52. Argentina Gallium Nitride Single Crystal Substrates Sales and Growth Rate (2019-2025) & (K Units)
Figure 53. Columbia Gallium Nitride Single Crystal Substrates Sales and Growth Rate (2019-2025) & (K Units)
Figure 54. Middle East and Africa Gallium Nitride Single Crystal Substrates Sales and Growth Rate (K Units)
Figure 55. Middle East and Africa Gallium Nitride Single Crystal Substrates Sales Market Share by Region in 2023
Figure 56. Saudi Arabia Gallium Nitride Single Crystal Substrates Sales and Growth Rate (2019-2025) & (K Units)
Figure 57. UAE Gallium Nitride Single Crystal Substrates Sales and Growth Rate (2019-2025) & (K Units)
Figure 58. Egypt Gallium Nitride Single Crystal Substrates Sales and Growth Rate (2019-2025) & (K Units)
Figure 59. Nigeria Gallium Nitride Single Crystal Substrates Sales and Growth Rate (2019-2025) & (K Units)
Figure 60. South Africa Gallium Nitride Single Crystal Substrates Sales and Growth Rate (2019-2025) & (K Units)
Figure 61. Global Gallium Nitride Single Crystal Substrates Sales Forecast by Volume (2026-2034) & (K Units)
Figure 62. Global Gallium Nitride Single Crystal Substrates Market Size Forecast by Value (2026-2034) & (M USD)
Figure 63. Global Gallium Nitride Single Crystal Substrates Sales Market Share Forecast by Type (2025-2030)
Figure 64. Global Gallium Nitride Single Crystal Substrates Market Share Forecast by Type (2025-2030)
Figure 65. Global Gallium Nitride Single Crystal Substrates Sales Forecast by Application (2025-2030)
Figure 66. Global Gallium Nitride Single Crystal Substrates Market Share Forecast by Application (2025-2030)