MARKET INSIGHTS
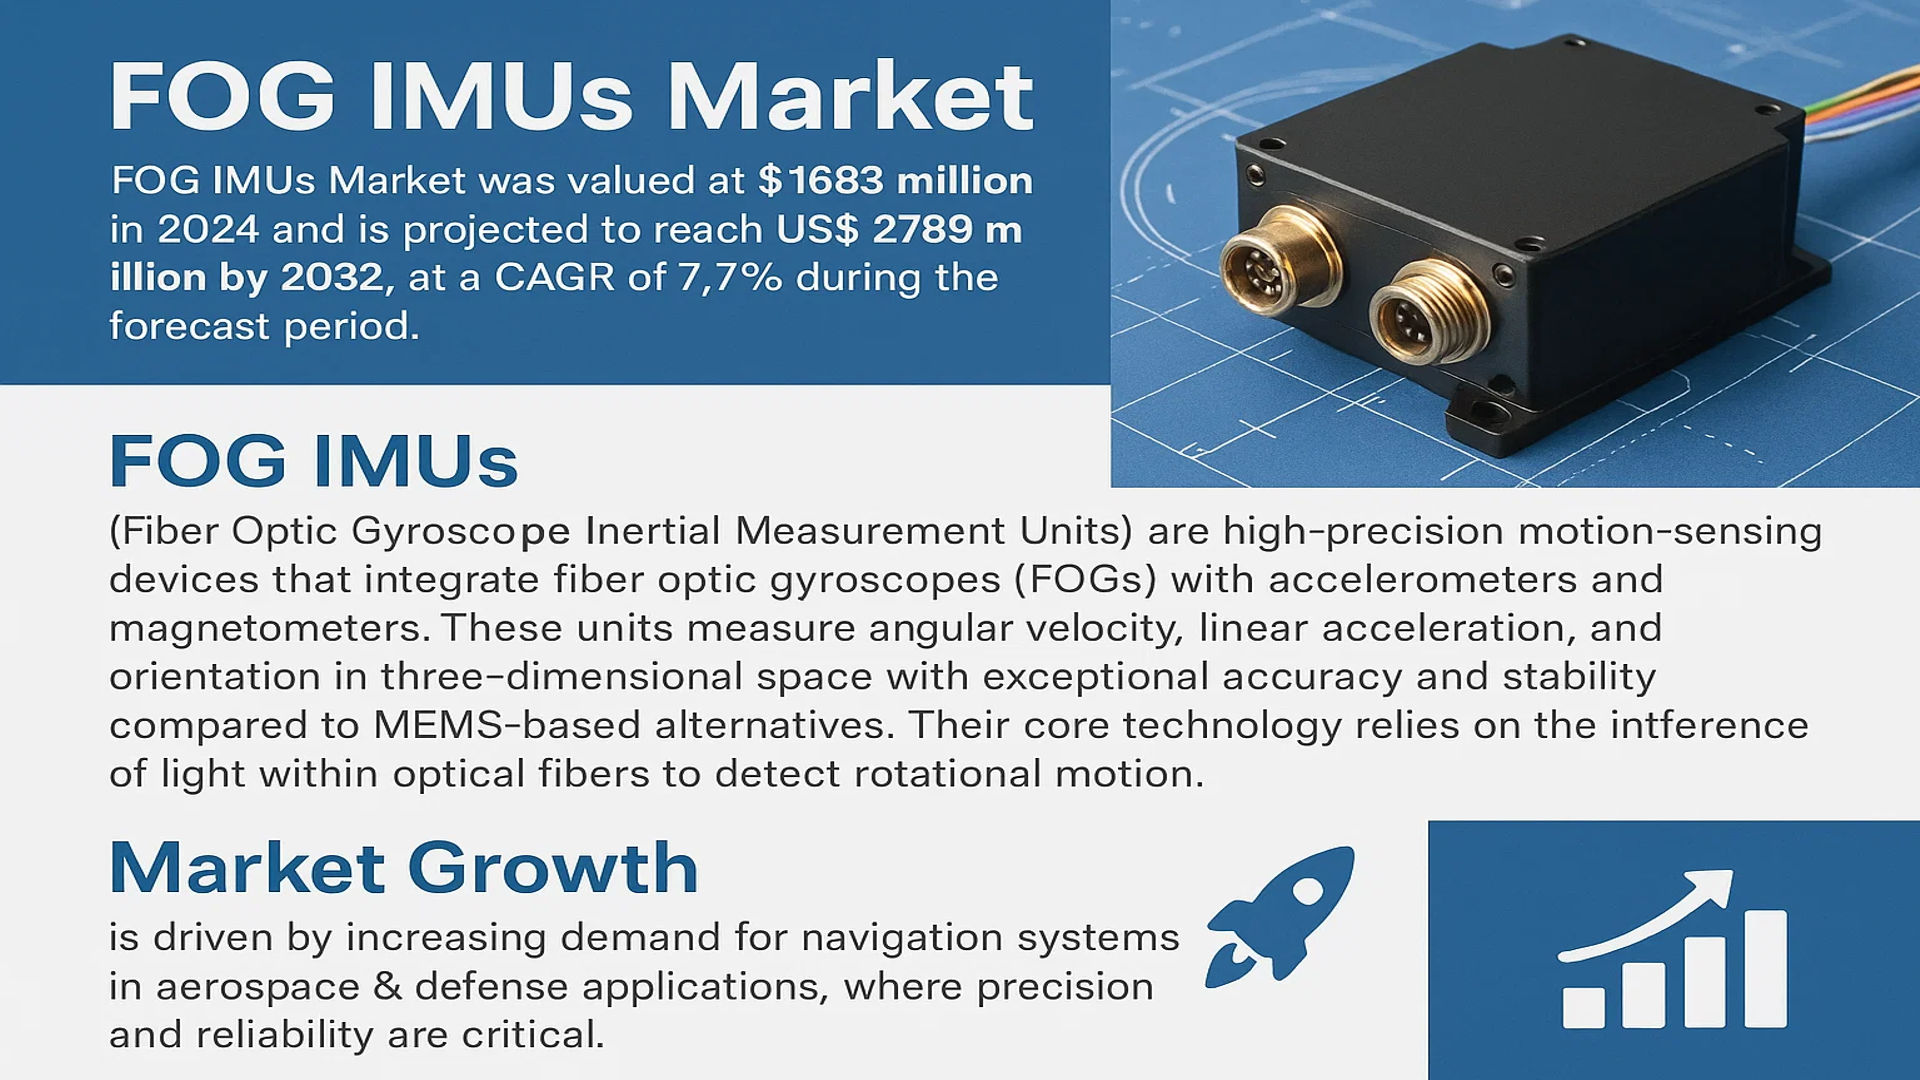
The global FOG IMUs Market was valued at 1683 million in 2024 and is projected to reach US$ 2789 million by 2032, at a CAGR of 7.7% during the forecast period.
FOG IMUs (Fiber Optic Gyroscope Inertial Measurement Units) are high-precision motion-sensing devices that integrate fiber optic gyroscopes (FOGs) with accelerometers and magnetometers. These units measure angular velocity, linear acceleration, and orientation in three-dimensional space with exceptional accuracy and stability compared to MEMS-based alternatives. Their core technology relies on the interference of light within optical fibers to detect rotational motion.
The market growth is driven by increasing demand for navigation systems in aerospace & defense applications, where precision and reliability are critical. Additionally, industrial automation and emerging applications in autonomous vehicles contribute to expansion. Key players like Honeywell Aerospace, EMCORE, and Kearfott dominate the competitive landscape, collectively holding a significant revenue share. North America currently leads in adoption, though Asia-Pacific shows rapid growth potential due to increasing defense budgets and industrialization.
MARKET DYNAMICS
MARKET DRIVERS
Rising Demand for High-Precision Navigation Systems in Aerospace & Defense
The aerospace and defense sector is a key driver for Fiber Optic Gyroscope Inertial Measurement Units (FOG IMUs) due to their unmatched precision in navigation and stabilization. Modern aircraft, unmanned aerial vehicles (UAVs), and missile guidance systems increasingly rely on FOG IMUs because they outperform traditional MEMS-based systems in accuracy and reliability. Their ability to operate in GPS-denied environments makes them indispensable for military applications. Recent contracts in defense sectors worldwide highlight this trend, with major investments in autonomous systems and advanced navigation technologies that leverage FOG IMUs for mission-critical operations.
Expansion of Autonomous Vehicles Creating New Growth Avenues
Autonomous vehicles, including self-driving cars and industrial robotics, represent a rapidly growing application area for FOG IMUs. While MEMS IMUs dominate consumer applications, high-end autonomous systems in mining, agriculture, and marine navigation increasingly adopt FOG-based solutions for their superior performance in harsh environments. The industrial segment’s FOG IMU adoption is growing at approximately 9% annually as automation penetrates heavy industries where vibration resistance and long-term stability are paramount. This shift is creating new opportunities beyond traditional aerospace applications.
Advancements in FOG technology itself are also driving adoption. The development of smaller, more power-efficient FOG IMUs has expanded their use cases, while manufacturing improvements have helped reduce costs by nearly 20% over the past five years. These technological enhancements are making FOG solutions accessible to a broader range of industrial and commercial applications where their advantages justify the premium over MEMS alternatives.
MARKET RESTRAINTS
High Production Costs Limiting Mass Market Adoption
The sophisticated manufacturing processes required for FOG IMUs result in significantly higher costs compared to MEMS alternatives, creating a barrier for price-sensitive applications. Production involves specialized optical fiber handling, precision alignment of components, and rigorous testing procedures that require expensive equipment and highly skilled technicians. These factors keep FOG IMUs priced at a premium, restricting their use to applications where performance requirements justify the cost.
Furthermore, the complex supply chain for key components like high-quality optical fibers and precision mechanical assemblies makes scaling production challenging. While economies of scale have reduced costs somewhat in recent years, FOG IMUs remain substantially more expensive than competing technologies, limiting their penetration in commercial markets where cost is a primary consideration.
MARKET CHALLENGES
Competition from Emerging Technologies Creating Market Pressure
While FOG IMUs maintain performance advantages in many applications, they face increasing competition from advanced MEMS and emerging quantum-based inertial navigation systems. Recent breakthroughs in MEMS technology have narrowed the performance gap for many applications, particularly in consumer and automotive markets. Meanwhile, quantum inertial navigation systems, though still in development, promise even greater accuracy than FOG solutions for specialized military and scientific applications.
The industry also faces technical challenges in miniaturizing FOG IMUs without compromising performance. While there have been significant achievements in reducing size and power consumption, further miniaturization is needed to address emerging applications in small UAVs and portable navigation systems. Overcoming these engineering challenges requires substantial R&D investment, which may be difficult for smaller market players to sustain.
MARKET OPPORTUNITIES
Growing Defense Modernization Programs Worldwide Present Significant Opportunities
Global increases in defense spending, particularly in Asia-Pacific and Middle Eastern countries, are creating substantial opportunities for FOG IMU manufacturers. Many nations are investing in next-generation military systems including hypersonic weapons, advanced UAVs, and secure navigation solutions – all of which require the high performance offered by FOG technology. Several multi-million dollar contracts for navigation systems incorporating FOG IMUs have been awarded recently, reflecting this growing demand.
The commercialization of space presents another significant opportunity. As more companies enter the small satellite and space exploration markets, there is increasing demand for reliable, high-performance navigation systems that can withstand the rigors of space. FOG IMUs are particularly well-suited for these applications due to their reliability in extreme environments and immunity to electromagnetic interference.
Finally, the expansion of offshore wind farms and subsea exploration is driving demand for robust navigation solutions in marine applications. FOG IMUs’ ability to maintain accuracy in underwater environments where GPS signals are unavailable makes them ideal for these growing markets. As renewable energy investments continue to increase worldwide, this represents a promising growth avenue for FOG technology.
FOG IMUs MARKET TRENDS
Growing Demand for High-Precision Navigation Systems Driving Market Expansion
The global FOG (Fiber Optic Gyroscope) IMU (Inertial Measurement Unit) market is witnessing significant growth, driven by the increasing demand for high-precision navigation systems in aerospace, defense, and industrial applications. With an estimated valuation of $1.683 billion in 2024, the market is projected to reach $2.789 billion by 2032, growing at a CAGR of 7.7%. The superior accuracy and stability of FOG IMUs over traditional MEMS-based systems are key factors fueling this demand. These devices leverage light interference in optical fibers to measure angular velocity and linear acceleration with minimal drift, making them indispensable in critical applications such as unmanned aerial vehicles (UAVs), autonomous vehicles, and underwater navigation.
Other Trends
Increasing Adoption in Autonomous Systems
The rise of autonomous vehicles and drones has necessitated the development of highly reliable inertial navigation systems. FOG IMUs are increasingly integrated into these systems due to their ability to provide accurate positioning data without relying on GPS, which can be unreliable or unavailable in certain environments. The defense sector, in particular, is leveraging FOG IMUs for precision-guided munitions and reconnaissance missions. Additionally, the industrial automation sector is adopting FOG IMUs for robotic navigation and stabilization in harsh environments where high precision is non-negotiable.
Technological Advancements and R&D Investments
Continuous advancements in fiber optic technology and miniaturization are enhancing the performance and cost-effectiveness of FOG IMUs. Leading manufacturers are investing heavily in R&D to develop next-generation IMUs with lower power consumption, improved shock resistance, and higher accuracy. The strategic-level FOG IMUs segment, used in defense and aerospace, is expected to witness robust growth due to increasing defense expenditures globally. Industrial-level FOG IMUs also show promising prospects, particularly in robotics and surveying applications, where precise motion tracking is crucial. Collaborative initiatives between industry players and research institutions are further accelerating innovation in this space.
COMPETITIVE LANDSCAPE
Key Industry Players
Innovation and Precision Drive Competition in the FOG IMU Market
The global FOG IMU (Fiber Optic Gyroscope Inertial Measurement Unit) market is characterized by a mix of established aerospace leaders and specialized technology firms competing to deliver cutting-edge motion sensing solutions. Honeywell Aerospace currently dominates the high-performance segment, leveraging decades of experience in aerospace-grade inertial navigation systems. The company’s strong contracts with defense agencies and commercial aerospace manufacturers solidify its leadership position.
European player LITEF GmbH (a subsidiary of Honeywell) maintains significant market share in industrial and defense applications across Europe, while EMCORE Corporation has emerged as a formidable competitor through its focus on miniaturized FOG IMU solutions. This technological specialization has allowed EMCORE to capture growing demand in unmanned systems and autonomous vehicle development.
Mid-sized firms like Inertial Labs and MostaTech are successfully competing through product customization and rapid prototyping capabilities. Their ability to deliver cost-effective solutions for emerging applications in robotics and autonomous navigation has enabled steady market share growth. Meanwhile, Kearfott Corporation continues to strengthen its position in strategic-level IMUs through sustained R&D investment and strategic partnerships with defense primes.
List of Key FOG IMU Manufacturers Profiled
- Honeywell Aerospace (U.S.)
- EMCORE Corporation (U.S.)
- LITEF GmbH (Germany)
- Inertial Labs, Inc. (U.S.)
- MostaTech (Israel)
- Kearfott Corporation (U.S.)
- GEM ELETTRONICA (Italy)
Segment Analysis:
By Type
Strategic-Level FOG IMUs Lead Demand Due to Critical Defense and Aerospace Applications
The market is segmented based on type into:
- Industrial-Level FOG IMUs
- Strategic-Level FOG IMUs
By Application
Aerospace & Defense Segment Dominates with Increasing Military Modernization Programs
The market is segmented based on application into:
- Aerospace & Defense
- Industrial
- Others
By Accuracy Level
High-Accuracy IMUs Drive Market Growth for Precision Navigation Systems
The market is segmented based on accuracy level into:
- Tactical Grade
- Navigation Grade
- Strategic Grade
By Component
Fiber Optic Gyroscopes Remain Core Technology Due to Superior Performance
The market is segmented based on component into:
- Fiber Optic Gyroscope (FOG)
- Accelerometers
- Magnetometers
- Processing Unit
Regional Analysis: FOG IMUs Market
North America
North America leads the FOG IMUs market, driven by strong defense spending and technological advancements in aerospace applications. The U.S. accounts for the largest market share within the region, with companies like Honeywell Aerospace and EMCORE playing pivotal roles in developing high-precision navigation systems for military and commercial aviation. The growing adoption of unmanned aerial vehicles (UAVs) and autonomous systems further accelerates demand. While stringent export controls on defense-related FOG IMUs create regulatory complexities, innovation in compact and power-efficient designs continues to strengthen the region’s market position.
Asia-Pacific
The Asia-Pacific region is experiencing the fastest growth in FOG IMU adoption, propelled by China’s expanding aerospace and defense sectors. Investments in indigenous defense technologies and space exploration programs, such as China’s BeiDou Navigation Satellite System, drive demand for locally manufactured FOG IMUs. India and Japan are also emerging as key markets, leveraging strategic partnerships with global players to enhance domestic capabilities. However, cost sensitivity in industrial applications limits widespread adoption, with MEMS-based alternatives often preferred for non-critical uses. The region’s focus on self-reliance in defense technologies suggests long-term growth potential.
Europe
Europe’s FOG IMU market is characterized by strong collaboration between defense contractors and research institutions. Countries like Germany and France dominate, with companies such as LITEF GmbH supplying high-accuracy systems for aerospace and marine navigation. The region’s emphasis on sovereign defense capabilities and UAV development fuels steady demand. However, budget constraints in some EU nations slow procurement cycles, while competition from lower-cost providers in Asia challenges local manufacturers. Regulatory alignment under EU defense initiatives may create opportunities for standardized FOG IMU solutions across member states.
Middle East & Africa
This region shows niche growth potential, particularly in defense and oil & gas applications. Countries like Israel and Saudi Arabia are investing in precision-guided munitions and autonomous systems, driving selective demand for tactical-grade FOG IMUs. Limited local manufacturing capability results in reliance on imports from North America and Europe, though partnerships with international suppliers are gradually enhancing technological transfer. Economic diversification efforts in Gulf Cooperation Council (GCC) countries may spur further adoption in industrial applications over the next decade.
South America
South America’s market remains underdeveloped but presents long-term opportunities in defense modernization programs. Brazil’s aerospace sector, including Embraer’s collaborations, demonstrates potential for FOG IMU integration in regional aircraft. Economic instability and fragmented procurement processes hinder market growth, though increasing focus on border security and natural resource exploration could stimulate future demand. The lack of domestic expertise necessitates continued dependence on foreign suppliers, positioning the region as a strategic export destination rather than a production hub.
Report Scope
This market research report provides a comprehensive analysis of the global FOG IMUs market, covering the forecast period 2024–2032. It offers detailed insights into market dynamics, technological advancements, competitive landscape, and key trends shaping the industry.
Key focus areas of the report include:
- Market Size & Forecast: Historical data and future projections for revenue, unit shipments, and market value across major regions and segments. The global FOG IMUs market was valued at USD 1,683 million in 2024 and is projected to reach USD 2,789 million by 2032, at a CAGR of 7.7%.
- Segmentation Analysis: Detailed breakdown by product type (Industrial Level, Strategic Level), application (Aerospace & Defense, Industrial, Others), and end-user industry to identify high-growth segments and investment opportunities.
- Regional Outlook: Insights into market performance across North America, Europe, Asia-Pacific, Latin America, and the Middle East & Africa. The U.S. and China are key growth markets, with Asia-Pacific expected to witness the highest CAGR.
- Competitive Landscape: Profiles of leading market participants including MostaTech, LITEF GmbH, Inertial Labs, EMCORE, Honeywell Aerospace, Kearfott, and GEM ELETTRONICA, covering their product offerings, R&D focus, and recent developments.
- Technology Trends & Innovation: Assessment of emerging technologies in fiber optic gyroscopes, integration with AI/ML, and advancements in inertial navigation systems.
- Market Drivers & Restraints: Evaluation of factors driving market growth such as increasing defense budgets and autonomous vehicle development, along with challenges like high manufacturing costs.
- Stakeholder Analysis: Insights for component suppliers, OEMs, system integrators, investors, and policymakers regarding the evolving ecosystem and strategic opportunities.
Primary and secondary research methods are employed, including interviews with industry experts, data from verified sources, and real-time market intelligence to ensure the accuracy and reliability of the insights presented.
FREQUENTLY ASKED QUESTIONS:
What is the current market size of Global FOG IMUs Market?
-> FOG IMUs Market was valued at 1683 million in 2024 and is projected to reach US$ 2789 million by 2032, at a CAGR of 7.7% during the forecast period.
Which key companies operate in Global FOG IMUs Market?
-> Key players include MostaTech, LITEF GmbH, Inertial Labs, EMCORE, Honeywell Aerospace, Kearfott, and GEM ELETTRONICA, among others.
What are the key growth drivers?
-> Key growth drivers include increasing defense expenditure, demand for precision navigation in autonomous vehicles, and growing space exploration activities.
Which region dominates the market?
-> North America currently holds the largest market share, while Asia-Pacific is expected to witness the highest growth rate during the forecast period.
What are the emerging trends?
-> Emerging trends include miniaturization of FOG IMUs, integration with AI for predictive maintenance, and development of quantum-enhanced inertial navigation systems.

Get Sample Report PDF for Exclusive Insights
Report Sample Includes
- Table of Contents
- List of Tables & Figures
- Charts, Research Methodology, and more...
 Download Sample Report PDF