Fluorometers for Water Quality Market, Trends, Business Strategies 2026-2034

Fluorometers for Water Quality Market size was valued at USD 320 million in 2025. The market is projected to grow from USD 345 million in 2026 to USD 520 million by 2034, exhibiting a CAGR of 5.3% during the forecast period.

PDF Icon Download Sample Report PDF
  • Quick Dispatch

    All Orders

  • Secure Payment

    100% Secure Payment

Price range: $1,500.00 through $4,250.00

Clear

Market Insights

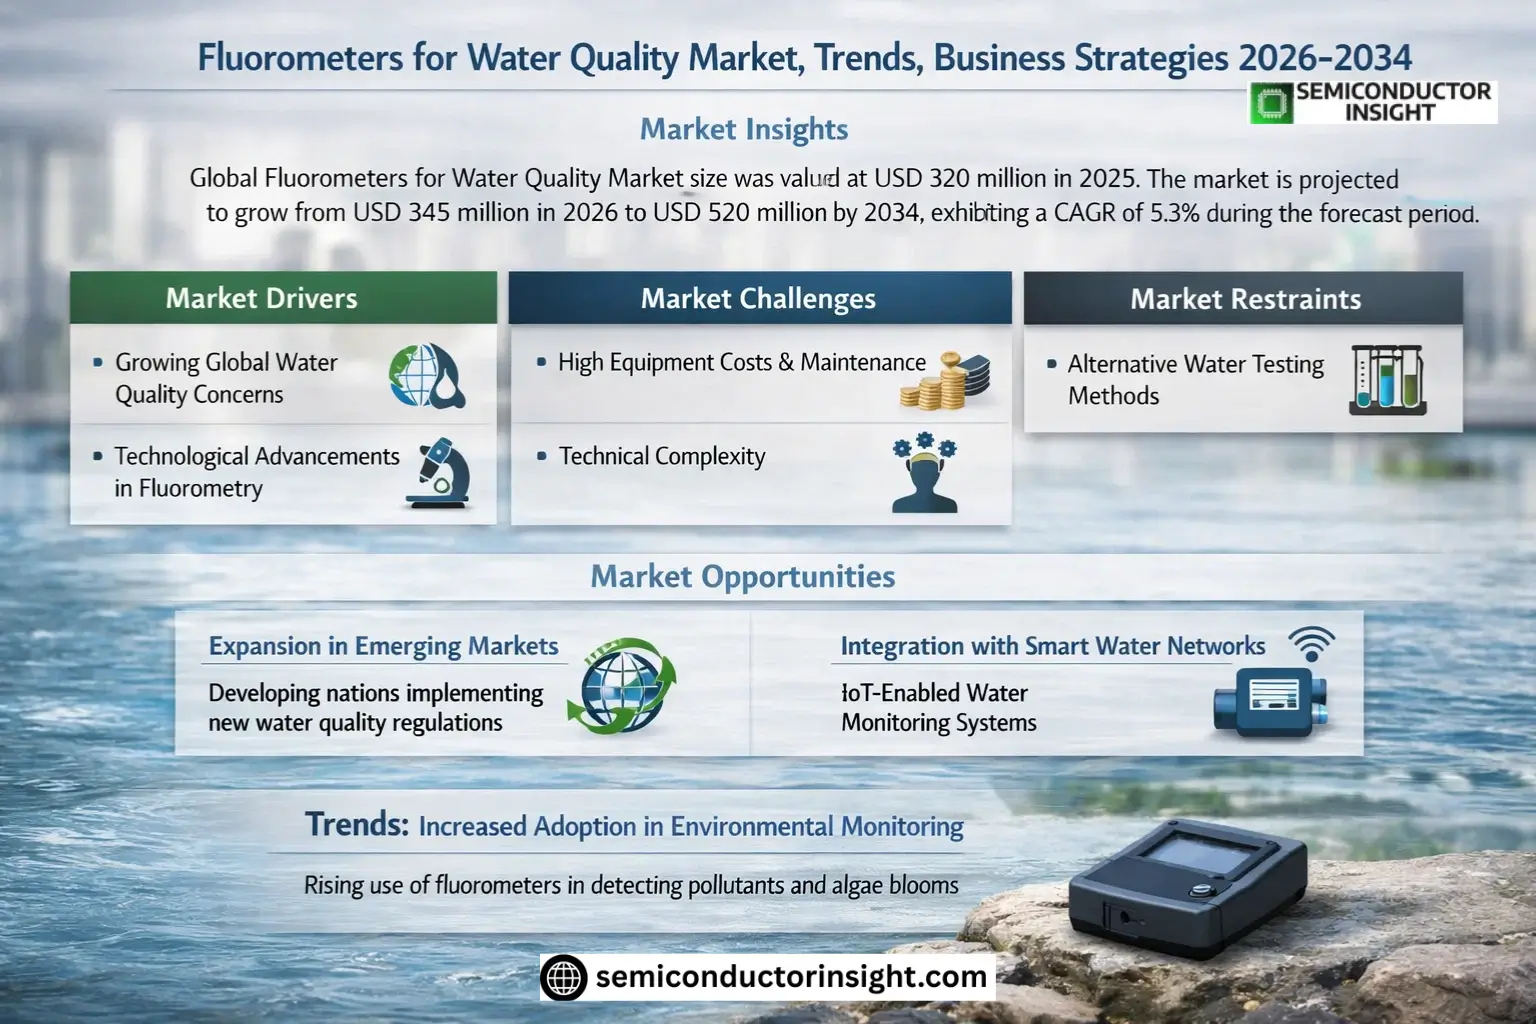
Global Fluorometers for Water Quality Market size was valued at USD 320 million in 2025. The market is projected to grow from USD 345 million in 2026 to USD 520 million by 2034, exhibiting a CAGR of 5.3% during the forecast period.

Fluorometers for water quality are specialized instruments used to measure fluorescence in water samples, enabling detection of organic compounds, chlorophyll, and pollutants. These devices play a critical role in environmental monitoring, wastewater treatment, and research applications by providing real-time data on water composition. Key product types include UV-Vis fluorometers, near-infrared models, and LED-based systems, each offering distinct advantages for specific use cases.

The market growth is driven by increasing regulatory requirements for water quality monitoring and rising industrial demand for efficient wastewater treatment solutions. Technological advancements in portable fluorometers have expanded field applications, while growing concerns about harmful algal blooms have boosted adoption in environmental agencies. Leading manufacturers like Turner Designs and Hach are developing integrated systems with advanced data analytics capabilities to meet evolving customer needs across municipal and industrial sectors.

Fluorometers for Water Quality Market Size & Forecast

MARKET DRIVERS

Growing Global Water Quality Concerns

Fluorometers for Water Quality Market is experiencing significant growth due to increasing concerns about water contamination worldwide. With over 2 billion people lacking access to safe drinking water, governments are implementing stricter regulations, driving demand for accurate monitoring solutions like fluorometers.

Technological Advancements in Fluorometry

Recent innovations in fluorometer technology have improved detection limits and measurement accuracy, making these instruments essential for comprehensive water quality assessment. Advanced models now offer real-time monitoring capabilities and reduced maintenance requirements.

Industrial expansion in emerging economies has created new demand for water quality monitoring in manufacturing sectors, particularly in food processing and pharmaceutical applications where fluorometers play a critical role.

MARKET CHALLENGES

High Equipment Costs and Maintenance

While fluorometers provide precise water quality measurements, their initial acquisition cost remains a barrier for smaller municipalities and developing regions. The average price for industrial-grade fluorometers ranges between USD 5,000-USD 15,000, with additional expenses for calibration and maintenance.

Other Challenges

Technical Complexity
Proper operation of fluorometers requires specialized training, creating workforce challenges in regions with limited technical education infrastructure.

MARKET RESTRAINTS

Alternative Water Testing Methods

Colorimetric and electrochemical testing methods continue to compete with fluorometers in water quality analysis, particularly in applications where rapid testing is prioritized over precision. These alternative methods typically offer lower upfront costs, restraining market growth for fluorometers in price-sensitive segments.

MARKET OPPORTUNITIES

Expansion in Emerging Markets

Developing nations implementing new water quality regulations present significant growth opportunities for fluorometer manufacturers. Countries in Asia-Pacific and Latin America are investing in water infrastructure, creating demand for advanced monitoring technologies including fluorometers for comprehensive water quality assessment.

Integration with Smart Water Networks

The development of smart city initiatives globally is driving integration of fluorometers into IoT-enabled water monitoring systems. This technological convergence creates new revenue streams through connected monitoring solutions and predictive maintenance services.

Fluorometers for Water Quality Market Trends
Increased Adoption in Environmental Monitoring

Environmental agencies worldwide are increasingly deploying fluorometers for water quality assessment, particularly for detecting organic pollutants and algae blooms. Government regulations on water safety standards have accelerated the adoption of these devices in both freshwater and marine monitoring programs. Portable fluorometers show notable growth due to their field applicability in rapid water analysis.

Other Trends

Technological Advancements in Sensor Design

Modern fluorometers now integrate multi-channel detection capabilities, allowing simultaneous measurement of multiple fluorescent compounds. Manufacturers are focusing on improving signal-to-noise ratios and detection limits to enhance accuracy across diverse water conditions. LED-based fluorometers are gaining traction due to their energy efficiency and longer operational lifespan compared to traditional light sources.

Expanding Industrial Applications

The wastewater treatment sector represents a growing application segment for fluorometers in water quality monitoring. Industries are implementing these systems for real-time process control and discharge compliance monitoring. Pharmaceutical and food processing plants are increasingly adopting fluorometers to track organic contaminant levels in their wastewater streams.

Regional Market Developments

North America maintains technological leadership in fluorometer development, while Asia-Pacific shows the fastest growth rate in adoption. Chinese manufacturers are making significant strides in cost-effective fluorometer production, challenging established players in price-sensitive markets.

Competitive Landscape Shifts

Fluorometers for Water Quality Market remains moderately consolidated, with Turner Designs, Hach, and HORIBA maintaining significant market shares. Recent strategic partnerships between instrumentation companies and software providers aim to enhance data integration capabilities in next-generation fluorometer systems.

COMPETITIVE LANDSCAPE

Key Industry Players

Global Fluorometers for Water Quality Market Analysis

Turner Designs and HORIBA currently dominate the fluorometers market for water quality, holding significant revenue shares as leading manufacturers. The market exhibits a moderately concentrated structure with the top five players accounting for approximately XX% of global revenue. These established players benefit from extensive product portfolios, strong distribution networks, and advanced R&D capabilities in fluorescence measurement technologies.

BBE Moldaenke and Sea-Bird Scientific represent specialized players focusing on environmental monitoring applications, while Hach and Walchem cater to industrial water treatment sectors. Emerging companies like High View Innovation are gaining traction through innovative sensor technologies and competitive pricing strategies in developing markets.

List of Key Fluorometer Companies Profiled

  • Turner Designs
  • HORIBA
  • Hach
  • BBE Moldaenke
  • Sea-Bird Scientific
  • Walchem
  • Chelsea Technologies
  • Eureka Water Probes
  • High View Innovation
  • YSI (Xylem)
  • Thermo Fisher Scientific
  • Shimadzu Corporation
  • JFE Advantech
  • Moldaenke GmbH
  • In-Situ Inc.

Segment Analysis:

Segment Category Sub-Segments Key Insights
By Type
  • UV-Vis Fluorometers
  • Near-Infrared Fluorometers
  • LED Fluorometers
UV-Vis Fluorometers dominate due to their versatility in detecting a wide range of fluorescent compounds in water.

  • Preferred for detecting organic pollutants and chlorophyll content with high accuracy
  • Widely used in both research and industrial settings due to standardized measurement protocols
  • Continuous technological improvements are enhancing sensitivity and reducing detection limits
By Application
  • Sewage Treatment
  • Environmental Monitoring
  • Laboratory Research
  • Others
Environmental Monitoring represents the most critical application area for fluorometers.

  • Essential for tracking water quality changes in rivers, lakes and coastal waters
  • Increasing regulatory requirements worldwide are driving adoption
  • Specialized fluorometers help detect toxic algal blooms and oil spills
By End User
  • Government Agencies
  • Research Institutions
  • Industrial Facilities
Government Agencies are the predominant users of water quality fluorometers.

  • Environmental protection agencies utilize fluorometers for compliance monitoring
  • Public water utilities deploy these instruments for source water protection
  • Increasing funding for water infrastructure improvements supports demand
By Measurement Parameter
  • Organic Matter Detection
  • Algal Pigments
  • Fluorescent Dyes/Tracers
Organic Matter Detection is the most common application for fluorometers in water quality.

  • Critical for assessing dissolved organic carbon and wastewater contamination
  • New fluorescence excitation-emission matrix techniques provide detailed characterization
  • Helps in tracking pollutants from agricultural runoff and industrial discharges
By Equipment Design
  • Benchtop Systems
  • Portable Handheld
  • Submersible Sensors
Portable Handheld fluorometers are seeing fastest adoption in water quality monitoring.

  • Enable real-time field measurements with laboratory-grade accuracy
  • Battery-powered options facilitate remote monitoring applications
  • Integration with GPS and data logging enhances field research capabilities

Regional Analysis: Fluorometers for Water Quality Market

North America

North America dominates the Fluorometers for Water Quality Market due to stringent environmental regulations and advanced water treatment infrastructure. The region’s focus on clean water initiatives has driven substantial adoption of fluorometers across municipal and industrial applications. U.S. EPA guidelines mandate comprehensive water quality monitoring, creating consistent demand for high-precision fluorometers. Technological advancements from key market players headquartered in the region further strengthen North America’s leadership position. The growing emphasis on real-time water monitoring systems in smart cities presents significant opportunities for fluorometer manufacturers in this market.

Regulatory Influence
Strict water quality standards in North America drive fluorometer adoption. The Clean Water Act and Safe Drinking Water Act require continuous monitoring of organic contaminants, creating sustained demand for advanced fluorometers in water treatment facilities.
Technology Adoption
North American water utilities increasingly deploy smart fluorometers with IoT connectivity for real-time data collection. This technology shift enables predictive maintenance and improves regulatory compliance across municipal water networks.
Industrial Applications
The industrial sector accounts for significant fluorometer use in North America, particularly in pharmaceutical manufacturing and chemical processing where precise water quality monitoring ensures production quality and regulatory compliance.
Market Innovation
Leading fluorometer manufacturers in North America focus on developing portable and multi-parameter devices, meeting the growing demand for field-deployable water quality solutions among environmental agencies and research institutions.

Europe
Europe represents the second-largest market for fluorometers, driven by EU water framework directives mandating comprehensive water quality assessment. Countries like Germany and France lead in adopting advanced fluorometer technologies for surface water monitoring. The region’s focus on wastewater treatment and reuse initiatives creates substantial demand for fluorometers across municipal and industrial sectors. European manufacturers emphasize energy-efficient designs to align with sustainability goals.

Asia-Pacific
The Asia-Pacific fluorometers market shows the fastest growth, fueled by expanding water treatment infrastructure and increasing environmental awareness. China’s massive investments in smart water management systems drive regional demand, while Japan leads in technological innovation for compact fluorometer designs. Emerging economies prioritize fluorometer adoption to address water pollution challenges and improve drinking water quality standards.

South America
South America’s fluorometer market grows steadily, supported by increasing government focus on water quality monitoring in urban areas. Brazil dominates regional adoption, particularly in industrial applications. Challenges remain in rural water monitoring infrastructure, presenting long-term growth opportunities for fluorometer manufacturers.

Middle East & Africa
The Middle East leads regional fluorometer adoption through desalination plant requirements, while African markets show gradual growth focused on urban water systems. GCC countries invest heavily in advanced water quality monitoring technologies, creating specialized demand for high-performance fluorometers in extreme environmental conditions.

Report Scope

This market research report provides a comprehensive analysis of the Fluorometers for Water Quality Market , covering the forecast period 2026–2034. It offers detailed insights into market dynamics, technological advancements, competitive landscape, and key trends shaping the industry.

Key focus areas of the report include:

  • Market Overview: The report begins with an overview outlining its current market scenario, key growth indicators, and industry transformation drivers. It discusses macroeconomic factors, demand–supply balance, regulatory landscape, and the strategic role of semiconductors in powering advancements across industries such as automotive, telecommunications, consumer electronics, and industrial automation.
  • Market Size & Forecast: Historical data and future projections for revenue, unit shipments, and market value across major regions and segments.
  • Segmentation Analysis: Detailed breakdown by product type, technology, application, and end-user industry to identify high-growth segments and investment opportunities.
  • Regional Insights: Insights into market performance across North America, Europe, Asia-Pacific, Latin America, and the Middle East & Africa, including country-level analysis where relevant.
  • Competitive Landscape: Profiles of leading market participants, including their product offerings, R&D focus, manufacturing capacity, pricing strategies, and recent developments such as mergers, acquisitions, and partnerships.
  • Technology Trends & Innovation: Assessment of emerging technologies, integration of AI/IoT, semiconductor design trends, fabrication techniques, and evolving industry standards.
  • Market Drivers & Restraints: Evaluation of factors driving market growth along with challenges, supply chain constraints, regulatory issues, and market-entry barriers.
  • Stakeholder Insights: Insights for component suppliers, OEMs, system integrators, investors, and policymakers regarding the evolving ecosystem and strategic opportunities.

Primary and secondary research methods are employed, including interviews with industry experts, data from verified sources, and real-time market intelligence to ensure the accuracy and reliability of the insights presented.

FREQUENTLY ASKED QUESTIONS:

What is the current market size of Fluorometers for Water Quality Market?

-> Fluorometers for Water Quality Market size was valued at USD 320 million in 2025. The market is projected to grow from USD 345 million in 2026 to USD 520 million by 2034, exhibiting a CAGR of 5.3% during the forecast period.

What is the growth rate (CAGR) of Fluorometers for Water Quality Market?

-> The market is expected to grow at a CAGR of % during 2026-2034.

Which key companies operate in Fluorometers for Water Quality Market?

-> Key players include Turner Designs, Walchem, BBE Moldaenke, Sea-Bird Scientific, HORIBA, Hach, Chelsea Technologies, Eureka Water Probes, High View Innovation, among others.

Which product segment leads the market?

-> UV-Vis Fluorometers segment is projected to reach USD million by 2034, growing at % CAGR.

Which region dominates the market?

-> U.S. market was valued at USD million in 2025, while China is expected to reach USD million.

Fluorometers for Water Quality Market, Trends, Business Strategies 2026-2034

Get Sample Report PDF for Exclusive Insights

Report Sample Includes

  • Table of Contents
  • List of Tables & Figures
  • Charts, Research Methodology, and more...
PDF Icon Download Sample Report PDF
SKU: e15b93d50d62
Category:
License Type

Corporate License, Excel License, PDF and Excel Databook License

Download Sample Report

Table of Content

1 Introduction to Research & Analysis Reports
1.1 Fluorometers for Water Quality Market Definition
1.2 Market Segments
1.2.1 Segment by Type
1.2.2 Segment by Application
1.3 Global Fluorometers for Water Quality Market Overview
1.4 Features & Benefits of This Report
1.5 Methodology & Sources of Information
1.5.1 Research Methodology
1.5.2 Research Process
1.5.3 Base Year
1.5.4 Report Assumptions & Caveats
2 Global Fluorometers for Water Quality Overall Market Size
2.1 Global Fluorometers for Water Quality Market Size: 2025 VS 2034
2.2 Global Fluorometers for Water Quality Market Size, Prospects & Forecasts: 2021-2034
2.3 Global Fluorometers for Water Quality Sales: 2021-2034
3 Company Landscape
3.1 Top Fluorometers for Water Quality Players in Global Market
3.2 Top Global Fluorometers for Water Quality Companies Ranked by Revenue
3.3 Global Fluorometers for Water Quality Revenue by Companies
3.4 Global Fluorometers for Water Quality Sales by Companies
3.5 Global Fluorometers for Water Quality Price by Manufacturer (2021-2026)
3.6 Top 3 and Top 5 Fluorometers for Water Quality Companies in Global Market, by Revenue in 2025
3.7 Global Manufacturers Fluorometers for Water Quality Product Type
3.8 Tier 1, Tier 2, and Tier 3 Fluorometers for Water Quality Players in Global Market
3.8.1 List of Global Tier 1 Fluorometers for Water Quality Companies
3.8.2 List of Global Tier 2 and Tier 3 Fluorometers for Water Quality Companies
4 Sights by Type
4.1 Overview
4.1.1 Segment by Type – Global Fluorometers for Water Quality Market Size Markets, 2025 & 2034
4.1.2 UV-Vis Fluorometers
4.1.3 Near-Infrared Fluorometers
4.1.4 LED Fluorometers
4.2 Segment by Type – Global Fluorometers for Water Quality Revenue & Forecasts
4.2.1 Segment by Type – Global Fluorometers for Water Quality Revenue, 2021-2026
4.2.2 Segment by Type – Global Fluorometers for Water Quality Revenue, 2027-2034
4.2.3 Segment by Type – Global Fluorometers for Water Quality Revenue Market Share, 2021-2034
4.3 Segment by Type – Global Fluorometers for Water Quality Sales & Forecasts
4.3.1 Segment by Type – Global Fluorometers for Water Quality Sales, 2021-2026
4.3.2 Segment by Type – Global Fluorometers for Water Quality Sales, 2027-2034
4.3.3 Segment by Type – Global Fluorometers for Water Quality Sales Market Share, 2021-2034
4.4 Segment by Type – Global Fluorometers for Water Quality Price (Manufacturers Selling Prices), 2021-2034
5 Sights by Application
5.1 Overview
5.1.1 Segment by Application – Global Fluorometers for Water Quality Market Size, 2025 & 2034
5.1.2 Sewage Treatment
5.1.3 Environmental Monitoring
5.1.4 Laboratory Research
5.1.5 Others
5.2 Segment by Application – Global Fluorometers for Water Quality Revenue & Forecasts
5.2.1 Segment by Application – Global Fluorometers for Water Quality Revenue, 2021-2026
5.2.2 Segment by Application – Global Fluorometers for Water Quality Revenue, 2027-2034
5.2.3 Segment by Application – Global Fluorometers for Water Quality Revenue Market Share, 2021-2034
5.3 Segment by Application – Global Fluorometers for Water Quality Sales & Forecasts
5.3.1 Segment by Application – Global Fluorometers for Water Quality Sales, 2021-2026
5.3.2 Segment by Application – Global Fluorometers for Water Quality Sales, 2027-2034
5.3.3 Segment by Application – Global Fluorometers for Water Quality Sales Market Share, 2021-2034
5.4 Segment by Application – Global Fluorometers for Water Quality Price (Manufacturers Selling Prices), 2021-2034
6 Sights Region
6.1 By Region – Global Fluorometers for Water Quality Market Size, 2025 & 2034
6.2 By Region – Global Fluorometers for Water Quality Revenue & Forecasts
6.2.1 By Region – Global Fluorometers for Water Quality Revenue, 2021-2026
6.2.2 By Region – Global Fluorometers for Water Quality Revenue, 2027-2034
6.2.3 By Region – Global Fluorometers for Water Quality Revenue Market Share, 2021-2034
6.3 By Region – Global Fluorometers for Water Quality Sales & Forecasts
6.3.1 By Region – Global Fluorometers for Water Quality Sales, 2021-2026
6.3.2 By Region – Global Fluorometers for Water Quality Sales, 2027-2034
6.3.3 By Region – Global Fluorometers for Water Quality Sales Market Share, 2021-2034
6.4 North America
6.4.1 By Country – North America Fluorometers for Water Quality Revenue, 2021-2034
6.4.2 By Country – North America Fluorometers for Water Quality Sales, 2021-2034
6.4.3 United States Fluorometers for Water Quality Market Size, 2021-2034
6.4.4 Canada Fluorometers for Water Quality Market Size, 2021-2034
6.4.5 Mexico Fluorometers for Water Quality Market Size, 2021-2034
6.5 Europe
6.5.1 By Country – Europe Fluorometers for Water Quality Revenue, 2021-2034
6.5.2 By Country – Europe Fluorometers for Water Quality Sales, 2021-2034
6.5.3 Germany Fluorometers for Water Quality Market Size, 2021-2034
6.5.4 France Fluorometers for Water Quality Market Size, 2021-2034
6.5.5 U.K. Fluorometers for Water Quality Market Size, 2021-2034
6.5.6 Italy Fluorometers for Water Quality Market Size, 2021-2034
6.5.7 Russia Fluorometers for Water Quality Market Size, 2021-2034
6.5.8 Nordic Countries Fluorometers for Water Quality Market Size, 2021-2034
6.5.9 Benelux Fluorometers for Water Quality Market Size, 2021-2034
6.6 Asia
6.6.1 By Region – Asia Fluorometers for Water Quality Revenue, 2021-2034
6.6.2 By Region – Asia Fluorometers for Water Quality Sales, 2021-2034
6.6.3 China Fluorometers for Water Quality Market Size, 2021-2034
6.6.4 Japan Fluorometers for Water Quality Market Size, 2021-2034
6.6.5 South Korea Fluorometers for Water Quality Market Size, 2021-2034
6.6.6 Southeast Asia Fluorometers for Water Quality Market Size, 2021-2034
6.6.7 India Fluorometers for Water Quality Market Size, 2021-2034
6.7 South America
6.7.1 By Country – South America Fluorometers for Water Quality Revenue, 2021-2034
6.7.2 By Country – South America Fluorometers for Water Quality Sales, 2021-2034
6.7.3 Brazil Fluorometers for Water Quality Market Size, 2021-2034
6.7.4 Argentina Fluorometers for Water Quality Market Size, 2021-2034
6.8 Middle East & Africa
6.8.1 By Country – Middle East & Africa Fluorometers for Water Quality Revenue, 2021-2034
6.8.2 By Country – Middle East & Africa Fluorometers for Water Quality Sales, 2021-2034
6.8.3 Turkey Fluorometers for Water Quality Market Size, 2021-2034
6.8.4 Israel Fluorometers for Water Quality Market Size, 2021-2034
6.8.5 Saudi Arabia Fluorometers for Water Quality Market Size, 2021-2034
6.8.6 UAE Fluorometers for Water Quality Market Size, 2021-2034
7 Manufacturers & Brands Profiles
7.1 Turner Designs
7.1.1 Turner Designs Company Summary
7.1.2 Turner Designs Business Overview
7.1.3 Turner Designs Fluorometers for Water Quality Major Product Offerings
7.1.4 Turner Designs Fluorometers for Water Quality Sales and Revenue in Global (2021-2026)
7.1.5 Turner Designs Key News & Latest Developments
7.2 Walchem
7.2.1 Walchem Company Summary
7.2.2 Walchem Business Overview
7.2.3 Walchem Fluorometers for Water Quality Major Product Offerings
7.2.4 Walchem Fluorometers for Water Quality Sales and Revenue in Global (2021-2026)
7.2.5 Walchem Key News & Latest Developments
7.3 BBE Moldaenke
7.3.1 BBE Moldaenke Company Summary
7.3.2 BBE Moldaenke Business Overview
7.3.3 BBE Moldaenke Fluorometers for Water Quality Major Product Offerings
7.3.4 BBE Moldaenke Fluorometers for Water Quality Sales and Revenue in Global (2021-2026)
7.3.5 BBE Moldaenke Key News & Latest Developments
7.4 Sea-Bird Scientific
7.4.1 Sea-Bird Scientific Company Summary
7.4.2 Sea-Bird Scientific Business Overview
7.4.3 Sea-Bird Scientific Fluorometers for Water Quality Major Product Offerings
7.4.4 Sea-Bird Scientific Fluorometers for Water Quality Sales and Revenue in Global (2021-2026)
7.4.5 Sea-Bird Scientific Key News & Latest Developments
7.5 HORIBA
7.5.1 HORIBA Company Summary
7.5.2 HORIBA Business Overview
7.5.3 HORIBA Fluorometers for Water Quality Major Product Offerings
7.5.4 HORIBA Fluorometers for Water Quality Sales and Revenue in Global (2021-2026)
7.5.5 HORIBA Key News & Latest Developments
7.6 Hach
7.6.1 Hach Company Summary
7.6.2 Hach Business Overview
7.6.3 Hach Fluorometers for Water Quality Major Product Offerings
7.6.4 Hach Fluorometers for Water Quality Sales and Revenue in Global (2021-2026)
7.6.5 Hach Key News & Latest Developments
7.7 Chelsea Technologies
7.7.1 Chelsea Technologies Company Summary
7.7.2 Chelsea Technologies Business Overview
7.7.3 Chelsea Technologies Fluorometers for Water Quality Major Product Offerings
7.7.4 Chelsea Technologies Fluorometers for Water Quality Sales and Revenue in Global (2021-2026)
7.7.5 Chelsea Technologies Key News & Latest Developments
7.8 Eureka Water Probes
7.8.1 Eureka Water Probes Company Summary
7.8.2 Eureka Water Probes Business Overview
7.8.3 Eureka Water Probes Fluorometers for Water Quality Major Product Offerings
7.8.4 Eureka Water Probes Fluorometers for Water Quality Sales and Revenue in Global (2021-2026)
7.8.5 Eureka Water Probes Key News & Latest Developments
7.9 High View Innovation
7.9.1 High View Innovation Company Summary
7.9.2 High View Innovation Business Overview
7.9.3 High View Innovation Fluorometers for Water Quality Major Product Offerings
7.9.4 High View Innovation Fluorometers for Water Quality Sales and Revenue in Global (2021-2026)
7.9.5 High View Innovation Key News & Latest Developments
8 Global Fluorometers for Water Quality Production Capacity, Analysis
8.1 Global Fluorometers for Water Quality Production Capacity, 2021-2034
8.2 Fluorometers for Water Quality Production Capacity of Key Manufacturers in Global Market
8.3 Global Fluorometers for Water Quality Production by Region
9 Key Market Trends, Opportunity, Drivers and Restraints
9.1 Market Opportunities & Trends
9.2 Market Drivers
9.3 Market Restraints
10 Fluorometers for Water Quality Supply Chain Analysis
10.1 Fluorometers for Water Quality Industry Value Chain
10.2 Fluorometers for Water Quality Upstream Market
10.3 Fluorometers for Water Quality Downstream and Clients
10.4 Marketing Channels Analysis
10.4.1 Marketing Channels
10.4.2 Fluorometers for Water Quality Distributors and Sales Agents in Global
11 Conclusion
12 Appendix
12.1 Note
12.2 Examples of Clients
12.3 DisclaimerList of Tables
Table 1. Key Players of Fluorometers for Water Quality in Global Market
Table 2. Top Fluorometers for Water Quality Players in Global Market, Ranking by Revenue (2025)
Table 3. Global Fluorometers for Water Quality Revenue by Companies, (US$, Mn), 2021-2026
Table 4. Global Fluorometers for Water Quality Revenue Share by Companies, 2021-2026
Table 5. Global Fluorometers for Water Quality Sales by Companies, (K Units), 2021-2026
Table 6. Global Fluorometers for Water Quality Sales Share by Companies, 2021-2026
Table 7. Key Manufacturers Fluorometers for Water Quality Price (2021-2026) & (US$/Unit)
Table 8. Global Manufacturers Fluorometers for Water Quality Product Type
Table 9. List of Global Tier 1 Fluorometers for Water Quality Companies, Revenue (US$, Mn) in 2025 and Market Share
Table 10. List of Global Tier 2 and Tier 3 Fluorometers for Water Quality Companies, Revenue (US$, Mn) in 2025 and Market Share
Table 11. Segment by Type – Global Fluorometers for Water Quality Revenue, (US$, Mn), 2025 & 2034
Table 12. Segment by Type – Global Fluorometers for Water Quality Revenue (US$, Mn), 2021-2026
Table 13. Segment by Type – Global Fluorometers for Water Quality Revenue (US$, Mn), 2027-2034
Table 14. Segment by Type – Global Fluorometers for Water Quality Sales (K Units), 2021-2026
Table 15. Segment by Type – Global Fluorometers for Water Quality Sales (K Units), 2027-2034
Table 16. Segment by Application – Global Fluorometers for Water Quality Revenue, (US$, Mn), 2025 & 2034
Table 17. Segment by Application – Global Fluorometers for Water Quality Revenue, (US$, Mn), 2021-2026
Table 18. Segment by Application – Global Fluorometers for Water Quality Revenue, (US$, Mn), 2027-2034
Table 19. Segment by Application – Global Fluorometers for Water Quality Sales, (K Units), 2021-2026
Table 20. Segment by Application – Global Fluorometers for Water Quality Sales, (K Units), 2027-2034
Table 21. By Region – Global Fluorometers for Water Quality Revenue, (US$, Mn), 2025 & 2034
Table 22. By Region – Global Fluorometers for Water Quality Revenue, (US$, Mn), 2021-2026
Table 23. By Region – Global Fluorometers for Water Quality Revenue, (US$, Mn), 2027-2034
Table 24. By Region – Global Fluorometers for Water Quality Sales, (K Units), 2021-2026
Table 25. By Region – Global Fluorometers for Water Quality Sales, (K Units), 2027-2034
Table 26. By Country – North America Fluorometers for Water Quality Revenue, (US$, Mn), 2021-2026
Table 27. By Country – North America Fluorometers for Water Quality Revenue, (US$, Mn), 2027-2034
Table 28. By Country – North America Fluorometers for Water Quality Sales, (K Units), 2021-2026
Table 29. By Country – North America Fluorometers for Water Quality Sales, (K Units), 2027-2034
Table 30. By Country – Europe Fluorometers for Water Quality Revenue, (US$, Mn), 2021-2026
Table 31. By Country – Europe Fluorometers for Water Quality Revenue, (US$, Mn), 2027-2034
Table 32. By Country – Europe Fluorometers for Water Quality Sales, (K Units), 2021-2026
Table 33. By Country – Europe Fluorometers for Water Quality Sales, (K Units), 2027-2034
Table 34. By Region – Asia Fluorometers for Water Quality Revenue, (US$, Mn), 2021-2026
Table 35. By Region – Asia Fluorometers for Water Quality Revenue, (US$, Mn), 2027-2034
Table 36. By Region – Asia Fluorometers for Water Quality Sales, (K Units), 2021-2026
Table 37. By Region – Asia Fluorometers for Water Quality Sales, (K Units), 2027-2034
Table 38. By Country – South America Fluorometers for Water Quality Revenue, (US$, Mn), 2021-2026
Table 39. By Country – South America Fluorometers for Water Quality Revenue, (US$, Mn), 2027-2034
Table 40. By Country – South America Fluorometers for Water Quality Sales, (K Units), 2021-2026
Table 41. By Country – South America Fluorometers for Water Quality Sales, (K Units), 2027-2034
Table 42. By Country – Middle East & Africa Fluorometers for Water Quality Revenue, (US$, Mn), 2021-2026
Table 43. By Country – Middle East & Africa Fluorometers for Water Quality Revenue, (US$, Mn), 2027-2034
Table 44. By Country – Middle East & Africa Fluorometers for Water Quality Sales, (K Units), 2021-2026
Table 45. By Country – Middle East & Africa Fluorometers for Water Quality Sales, (K Units), 2027-2034
Table 46. Turner Designs Company Summary
Table 47. Turner Designs Fluorometers for Water Quality Product Offerings
Table 48. Turner Designs Fluorometers for Water Quality Sales (K Units), Revenue (US$, Mn) and Average Price (US$/Unit) & (2021-2026)
Table 49. Turner Designs Key News & Latest Developments
Table 50. Walchem Company Summary
Table 51. Walchem Fluorometers for Water Quality Product Offerings
Table 52. Walchem Fluorometers for Water Quality Sales (K Units), Revenue (US$, Mn) and Average Price (US$/Unit) & (2021-2026)
Table 53. Walchem Key News & Latest Developments
Table 54. BBE Moldaenke Company Summary
Table 55. BBE Moldaenke Fluorometers for Water Quality Product Offerings
Table 56. BBE Moldaenke Fluorometers for Water Quality Sales (K Units), Revenue (US$, Mn) and Average Price (US$/Unit) & (2021-2026)
Table 57. BBE Moldaenke Key News & Latest Developments
Table 58. Sea-Bird Scientific Company Summary
Table 59. Sea-Bird Scientific Fluorometers for Water Quality Product Offerings
Table 60. Sea-Bird Scientific Fluorometers for Water Quality Sales (K Units), Revenue (US$, Mn) and Average Price (US$/Unit) & (2021-2026)
Table 61. Sea-Bird Scientific Key News & Latest Developments
Table 62. HORIBA Company Summary
Table 63. HORIBA Fluorometers for Water Quality Product Offerings
Table 64. HORIBA Fluorometers for Water Quality Sales (K Units), Revenue (US$, Mn) and Average Price (US$/Unit) & (2021-2026)
Table 65. HORIBA Key News & Latest Developments
Table 66. Hach Company Summary
Table 67. Hach Fluorometers for Water Quality Product Offerings
Table 68. Hach Fluorometers for Water Quality Sales (K Units), Revenue (US$, Mn) and Average Price (US$/Unit) & (2021-2026)
Table 69. Hach Key News & Latest Developments
Table 70. Chelsea Technologies Company Summary
Table 71. Chelsea Technologies Fluorometers for Water Quality Product Offerings
Table 72. Chelsea Technologies Fluorometers for Water Quality Sales (K Units), Revenue (US$, Mn) and Average Price (US$/Unit) & (2021-2026)
Table 73. Chelsea Technologies Key News & Latest Developments
Table 74. Eureka Water Probes Company Summary
Table 75. Eureka Water Probes Fluorometers for Water Quality Product Offerings
Table 76. Eureka Water Probes Fluorometers for Water Quality Sales (K Units), Revenue (US$, Mn) and Average Price (US$/Unit) & (2021-2026)
Table 77. Eureka Water Probes Key News & Latest Developments
Table 78. High View Innovation Company Summary
Table 79. High View Innovation Fluorometers for Water Quality Product Offerings
Table 80. High View Innovation Fluorometers for Water Quality Sales (K Units), Revenue (US$, Mn) and Average Price (US$/Unit) & (2021-2026)
Table 81. High View Innovation Key News & Latest Developments
Table 82. Fluorometers for Water Quality Capacity of Key Manufacturers in Global Market, 2024-2026 (K Units)
Table 83. Global Fluorometers for Water Quality Capacity Market Share of Key Manufacturers, 2024-2026
Table 84. Global Fluorometers for Water Quality Production by Region, 2021-2026 (K Units)
Table 85. Global Fluorometers for Water Quality Production by Region, 2027-2034 (K Units)
Table 86. Fluorometers for Water Quality Market Opportunities & Trends in Global Market
Table 87. Fluorometers for Water Quality Market Drivers in Global Market
Table 88. Fluorometers for Water Quality Market Restraints in Global Market
Table 89. Fluorometers for Water Quality Raw Materials
Table 90. Fluorometers for Water Quality Raw Materials Suppliers in Global Market
Table 91. Typical Fluorometers for Water Quality Downstream
Table 92. Fluorometers for Water Quality Downstream Clients in Global Market
Table 93. Fluorometers for Water Quality Distributors and Sales Agents in Global Market

List of Figures
Figure 1. Fluorometers for Water Quality Product Picture
Figure 2. Fluorometers for Water Quality Segment by Type in 2025
Figure 3. Fluorometers for Water Quality Segment by Application in 2025
Figure 4. Global Fluorometers for Water Quality Market Overview: 2025
Figure 5. Key Caveats
Figure 6. Global Fluorometers for Water Quality Market Size: 2025 VS 2034 (US$, Mn)
Figure 7. Global Fluorometers for Water Quality Revenue: 2021-2034 (US$, Mn)
Figure 8. Fluorometers for Water Quality Sales in Global Market: 2021-2034 (K Units)
Figure 9. The Top 3 and 5 Players Market Share by Fluorometers for Water Quality Revenue in 2025
Figure 10. Segment by Type – Global Fluorometers for Water Quality Revenue, (US$, Mn), 2025 & 2034
Figure 11. Segment by Type – Global Fluorometers for Water Quality Revenue Market Share, 2021-2034
Figure 12. Segment by Type – Global Fluorometers for Water Quality Sales Market Share, 2021-2034
Figure 13. Segment by Type – Global Fluorometers for Water Quality Price (US$/Unit), 2021-2034
Figure 14. Segment by Application – Global Fluorometers for Water Quality Revenue, (US$, Mn), 2025 & 2034
Figure 15. Segment by Application – Global Fluorometers for Water Quality Revenue Market Share, 2021-2034
Figure 16. Segment by Application – Global Fluorometers for Water Quality Sales Market Share, 2021-2034
Figure 17. Segment by Application -Global Fluorometers for Water Quality Price (US$/Unit), 2021-2034
Figure 18. By Region – Global Fluorometers for Water Quality Revenue, (US$, Mn), 2025 & 2034
Figure 19. By Region – Global Fluorometers for Water Quality Revenue Market Share, 2021 VS 2025 VS 2034
Figure 20. By Region – Global Fluorometers for Water Quality Revenue Market Share, 2021-2034
Figure 21. By Region – Global Fluorometers for Water Quality Sales Market Share, 2021-2034
Figure 22. By Country – North America Fluorometers for Water Quality Revenue Market Share, 2021-2034
Figure 23. By Country – North America Fluorometers for Water Quality Sales Market Share, 2021-2034
Figure 24. United States Fluorometers for Water Quality Revenue, (US$, Mn), 2021-2034
Figure 25. Canada Fluorometers for Water Quality Revenue, (US$, Mn), 2021-2034
Figure 26. Mexico Fluorometers for Water Quality Revenue, (US$, Mn), 2021-2034
Figure 27. By Country – Europe Fluorometers for Water Quality Revenue Market Share, 2021-2034
Figure 28. By Country – Europe Fluorometers for Water Quality Sales Market Share, 2021-2034
Figure 29. Germany Fluorometers for Water Quality Revenue, (US$, Mn), 2021-2034
Figure 30. France Fluorometers for Water Quality Revenue, (US$, Mn), 2021-2034
Figure 31. U.K. Fluorometers for Water Quality Revenue, (US$, Mn), 2021-2034
Figure 32. Italy Fluorometers for Water Quality Revenue, (US$, Mn), 2021-2034
Figure 33. Russia Fluorometers for Water Quality Revenue, (US$, Mn), 2021-2034
Figure 34. Nordic Countries Fluorometers for Water Quality Revenue, (US$, Mn), 2021-2034
Figure 35. Benelux Fluorometers for Water Quality Revenue, (US$, Mn), 2021-2034
Figure 36. By Region – Asia Fluorometers for Water Quality Revenue Market Share, 2021-2034
Figure 37. By Region – Asia Fluorometers for Water Quality Sales Market Share, 2021-2034
Figure 38. China Fluorometers for Water Quality Revenue, (US$, Mn), 2021-2034
Figure 39. Japan Fluorometers for Water Quality Revenue, (US$, Mn), 2021-2034
Figure 40. South Korea Fluorometers for Water Quality Revenue, (US$, Mn), 2021-2034
Figure 41. Southeast Asia Fluorometers for Water Quality Revenue, (US$, Mn), 2021-2034
Figure 42. India Fluorometers for Water Quality Revenue, (US$, Mn), 2021-2034
Figure 43. By Country – South America Fluorometers for Water Quality Revenue Market Share, 2021-2034
Figure 44. By Country – South America Fluorometers for Water Quality Sales, Market Share, 2021-2034
Figure 45. Brazil Fluorometers for Water Quality Revenue, (US$, Mn), 2021-2034
Figure 46. Argentina Fluorometers for Water Quality Revenue, (US$, Mn), 2021-2034
Figure 47. By Country – Middle East & Africa Fluorometers for Water Quality Revenue, Market Share, 2021-2034
Figure 48. By Country – Middle East & Africa Fluorometers for Water Quality Sales, Market Share, 2021-2034
Figure 49. Turkey Fluorometers for Water Quality Revenue, (US$, Mn), 2021-2034
Figure 50. Israel Fluorometers for Water Quality Revenue, (US$, Mn), 2021-2034
Figure 51. Saudi Arabia Fluorometers for Water Quality Revenue, (US$, Mn), 2021-2034
Figure 52. UAE Fluorometers for Water Quality Revenue, (US$, Mn), 2021-2034
Figure 53. Global Fluorometers for Water Quality Production Capacity (K Units), 2021-2034
Figure 54. The Percentage of Production Fluorometers for Water Quality by Region, 2025 VS 2034
Figure 55. Fluorometers for Water Quality Industry Value Chain
Figure 56. Marketing Channels