FeRAM Market Overview
Ferroelectric random access memory (FeRAM) is a nonvolatile memory, in which data are stored using hysteretic P-E (polarization vs. electric field) characteristics in a ferroelectric film. Ferroelectric random access memories (FeRAMs) are widely used in IC (integrated circuits) cards and RF (radio frequency) tags. Their features are (1) nonvolatile data storage (The stored data do not disappear even if electricity is turned off.), (2) the lowest power consumption among various semi-conductor memories, and (3) the operation speed as fast as that of DRAMs (dynamic RAMs).
This report provides a deep insight into the global FeRAM market covering all its essential aspects. This ranges from a macro overview of the market to micro details of the market size, competitive landscape, development trend, niche market, key market drivers and challenges, SWOT analysis, value chain analysis, etc.
The analysis helps the reader to shape the competition within the industries and strategies for the competitive environment to enhance the potential profit. Furthermore, it provides a simple framework for evaluating and accessing the position of the business organization. The report structure also focuses on the competitive landscape of the Global FeRAM Market, this report introduces in detail the market share, market performance, product situation, operation situation, etc. of the main players, which helps the readers in the industry to identify the main competitors and deeply understand the competition pattern of the market.
In a word, this report is a must-read for industry players, investors, researchers, consultants, business strategists, and all those who have any kind of stake or are planning to foray into the FeRAM market in any manner.
FeRAM Market Analysis:
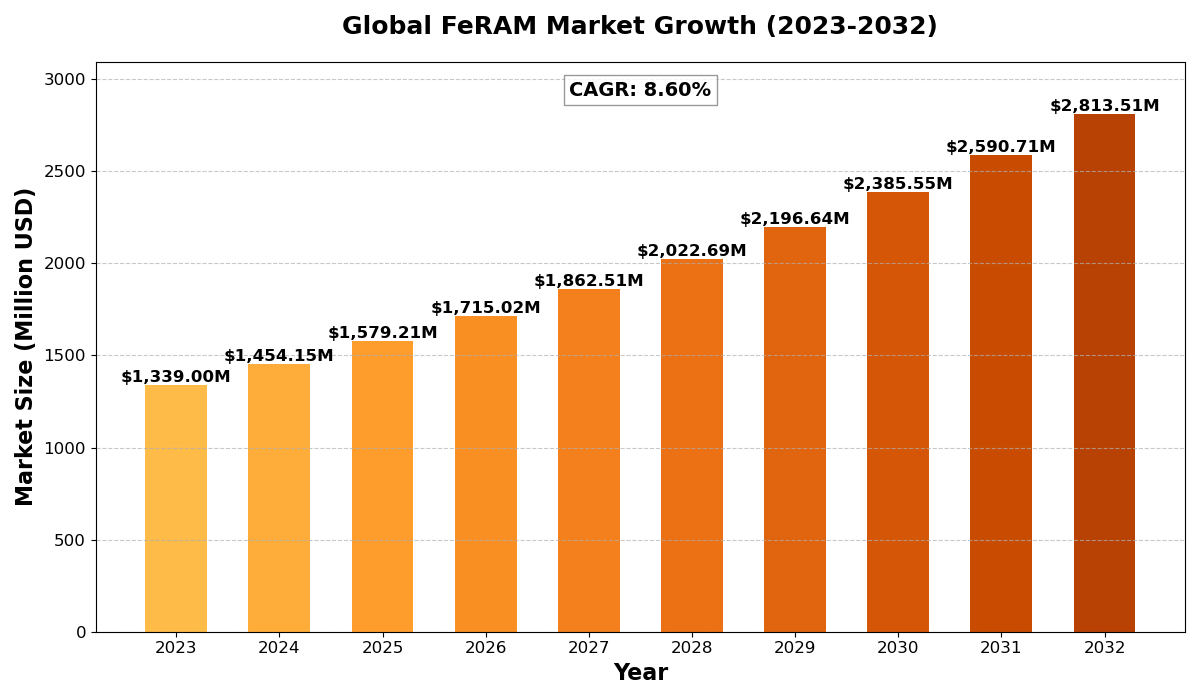
The global FeRAM Market size was estimated at USD 1339 million in 2023 and is projected to reach USD 2813.51 million by 2032, exhibiting a CAGR of 8.60% during the forecast period.
North America FeRAM market size was estimated at USD 402.24 million in 2023, at a CAGR of 7.37% during the forecast period of 2025 through 2032.
FeRAM Key Market Trends :
- Rising Demand for Low-Power Memory Solutions: The need for energy-efficient memory devices is growing across multiple industries, driving FeRAM adoption.
- Integration with IoT and Smart Devices: Increasing IoT applications and smart device connectivity are boosting demand for FeRAM technology.
- Advancements in FeRAM Technology: Innovations in FeRAM manufacturing processes are enhancing speed, density, and reliability.
- Expanding Applications in Automotive & Industrial Sectors: FeRAM’s high-speed and low-power features make it ideal for automotive and industrial automation.
- Increased Investment in Semiconductor R&D: Governments and private entities are heavily investing in semiconductor research, fostering FeRAM market growth.
FeRAM Market Regional Analysis :

North America:
Strong demand driven by EVs, 5G infrastructure, and renewable energy, with the U.S. leading the market.
Europe:
Growth fueled by automotive electrification, renewable energy, and strong regulatory support, with Germany as a key player.
Asia-Pacific:
Dominates the market due to large-scale manufacturing in China and Japan, with growing demand from EVs, 5G, and semiconductors.
South America:
Emerging market, driven by renewable energy and EV adoption, with Brazil leading growth.
Middle East & Africa:
Gradual growth, mainly due to investments in renewable energy and EV infrastructure, with Saudi Arabia and UAE as key contributors.
FeRAM Market Segmentation :
The research report includes specific segments by region (country), manufacturers, Type, and Application. Market segmentation creates subsets of a market based on product type, end-user or application, Geographic, and other factors. By understanding the market segments, the decision-maker can leverage this targeting in the product, sales, and marketing strategies. Market segments can power your product development cycles by informing how you create product offerings for different segments.
Key Company
- Fujitsu
- Infineon
- ROHM
- Texas Instruments
- Symetrix
Market Segmentation (by Type)
- 4K to128K
- 256K to 2M
- Above 2M
Market Segmentation (by Application)
- Automotive
- Test and Measurement Equipment
- Industrial Automation
- Medical
- Telecommunication
- Consumer Electronics
- Others
Market Drivers
- Growing Need for Nonvolatile Memory Solutions: The demand for reliable, nonvolatile storage is increasing across applications such as automotive, industrial automation, and telecommunications.
- Enhanced Durability and High-Speed Performance: FeRAM’s ability to handle high-speed operations and endure multiple read/write cycles is attracting adoption.
- Surge in IoT and Smart Technology Integration: The rise of IoT-enabled devices requires efficient and low-power memory solutions like FeRAM.
Market Restraints
- High Manufacturing Costs: Compared to traditional memory technologies, FeRAM production costs remain relatively high.
- Limited Storage Capacity: FeRAM struggles to compete with other memory technologies in terms of storage density.
- Competition from Emerging Memory Technologies: Technologies such as MRAM and RRAM pose competition to FeRAM’s market share.
Market Opportunities
- Growing Adoption in Automotive Electronics: The increasing need for robust memory in automotive applications provides growth opportunities.
- Advancements in FeRAM Capacity & Performance: Continued R&D efforts could lead to higher density FeRAM with improved efficiency.
- Expansion into Emerging Markets: The growing semiconductor industry in Asia-Pacific presents lucrative opportunities.
Market Challenges
- Scalability Issues: Expanding FeRAM’s storage capabilities while maintaining efficiency remains a challenge.
- Compatibility with Existing Systems: Integrating FeRAM into legacy systems requires additional effort and cost.
- Supply Chain Disruptions: Fluctuations in raw material availability and geopolitical factors can impact market growth.
Key Benefits of This Market Research:
- Industry drivers, restraints, and opportunities covered in the study
- Neutral perspective on the market performance
- Recent industry trends and developments
- Competitive landscape & strategies of key players
- Potential & niche segments and regions exhibiting promising growth covered
- Historical, current, and projected market size, in terms of value
- In-depth analysis of the FeRAM Market
- Overview of the regional outlook of the FeRAM Market:
Key Reasons to Buy this Report:
- Access to date statistics compiled by our researchers. These provide you with historical and forecast data, which is analyzed to tell you why your market is set to change
- This enables you to anticipate market changes to remain ahead of your competitors
- You will be able to copy data from the Excel spreadsheet straight into your marketing plans, business presentations, or other strategic documents
- The concise analysis, clear graph, and table format will enable you to pinpoint the information you require quickly
- Provision of market value data for each segment and sub-segment
- Indicates the region and segment that is expected to witness the fastest growth as well as to dominate the market
- Provides insight into the market through Value Chain
- Market dynamics scenario, along with growth opportunities of the market in the years to come
- 6-month post-sales analyst support
Customization of the Report
In case of any queries or customization requirements, please connect with our sales team, who will ensure that your requirements are met.
FAQs
Q: What are the key driving factors and opportunities in the FeRAM market?
A: The increasing demand for nonvolatile memory, IoT integration, and advancements in semiconductor technology are key driving factors. Opportunities exist in automotive electronics and emerging markets.
Q: Which region is projected to have the largest market share?
A: Asia-Pacific is expected to hold the largest market share due to the growing semiconductor industry and increased demand for memory solutions.
Q: Who are the top players in the global FeRAM market?
A: Leading players include Fujitsu, Infineon, ROHM, Texas Instruments, and Symetrix.
Q: What are the latest technological advancements in the industry?
A: FeRAM advancements include improved density, higher speed, and integration with AI-driven applications.
Q: What is the current size of the global FeRAM market?
A: The global FeRAM market was valued at USD 1339 million in 2023 and is projected to reach USD 2813.51 million by 2032 with a CAGR of 8.60%.

Get Sample Report PDF for Exclusive Insights
Report Sample Includes
- Table of Contents
- List of Tables & Figures
- Charts, Research Methodology, and more...