FC BGA Market, Emerging Trends, Technological Advancements, and Business Strategies 2026-2033

FC BGA Market was valued at USD 4,890 million in 2025 and is projected to reach USD 9,548 million by 2033, exhibiting a CAGR of 10.6% during the forecast period.

PDF Icon Download Sample Report PDF
  • Quick Dispatch

    All Orders

  • Secure Payment

    100% Secure Payment

Price range: $1,500.00 through $4,250.00

Clear

Market Insights

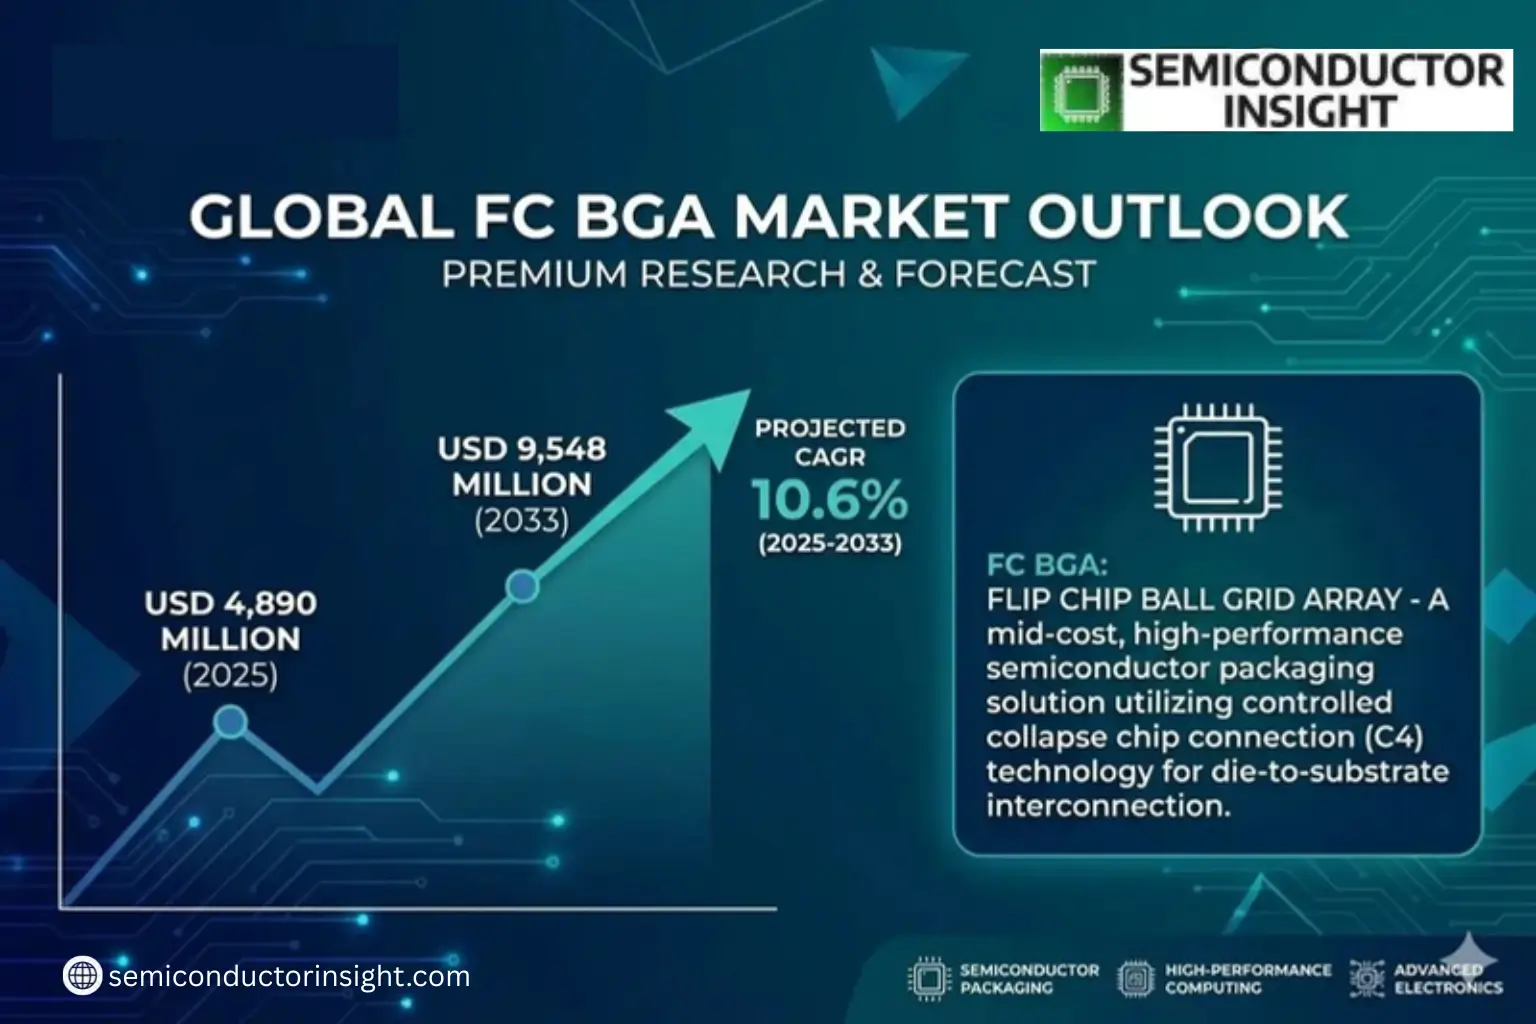
Global FC BGA Market was valued at USD 4,890 million in 2025 and is projected to reach USD 9,548 million by 2033, exhibiting a CAGR of 10.6% during the forecast period.

Flip Chip Ball Grid Array (FC BGA) is a mid-cost, high-performance semiconductor packaging solution that utilizes controlled collapse chip connection (C4) technology for die-to-substrate interconnection. This advanced packaging method enables higher signal density and functionality within a compact footprint, making it ideal for applications where performance outweighs cost considerations. FC BGA packages are compatible with standard printed circuit boards and can be repaired using conventional techniques.

The market growth is driven by increasing demand for high-performance computing, artificial intelligence chips, and data center applications. The adoption of Ajinomoto Build-up Film (ABF) substrates – multilayer microcircuit components essential for modern CPUs and GPUs – further supports this expansion. Key players like Unimicron, Ibiden, and AT&S dominate the market, collectively holding approximately 74% share. Taiwan leads in production with 30% market share, followed by mainland China and South Korea at 17% each.

Xyz market size & forecast

MARKET DRIVERS

Growing Demand for High-Performance Electronics

FC BGA (Flip Chip Ball Grid Array) Market is witnessing significant growth due to increasing demand for compact, high-performance electronic devices. The adoption of FC BGA packages in smartphones, AI processors, and data centers is driving market expansion. Advanced packaging technologies offer superior thermal and electrical performance, making them ideal for next-generation applications.

Technological Advancements in Semiconductor Packaging

Innovations in FC BGA technology, such as finer pitch interconnects and improved thermal management, are accelerating adoption across industries. Leading semiconductor manufacturers are investing heavily in R&D to enhance package reliability and reduce production costs.

With the rise of autonomous vehicles and HPC (High-Performance Computing) applications, demand for FC BGA solutions is expected to remain strong in the coming years.

MARKET CHALLENGES

High Manufacturing Complexity

FC BGA production involves complex processes including flip chip bonding, underfill dispensing, and precise thermal management. This complexity increases manufacturing costs and requires specialized equipment, creating barriers for smaller players in the FC BGA Market.

Other Challenges

Thermal Management Issues
As FC BGA packages shrink in size while increasing in performance, managing heat dissipation becomes increasingly challenging, potentially impacting product reliability and lifespan.

MARKET RESTRAINTS

Supply Chain Disruptions

FC BGA Market faces constraints due to global semiconductor supply chain challenges. Geopolitical tensions and material shortages are impacting lead times and production schedules, particularly for advanced packaging solutions requiring specialized substrates.

MARKET OPPORTUNITIES

Emerging Applications in AI and Machine Learning

The rapid growth of AI chipsets presents significant opportunities for FC BGA manufacturers. These packages are ideal for high-density interconnects required in neural network processors, with demand expected to triple in the next five years.
FC BGA Market Trends

Strong Growth Projected for FC BGA Market

Global FC BGA Market, valued at USD 4.89 billion in 2025, is projected to reach USD 9.55 billion by 2033, growing at a CAGR of 10.6%. This growth is driven by increasing demand for high-performance semiconductor packaging solutions in computing and telecommunications. The 4-8 layer ABF substrate segment dominates with 69% market share, primarily used in PC applications (40% market share). Taiwan leads production with 30% global share, followed by mainland China and South Korea at 17% each.

Other Trends

Tariff Policies Impacting Supply Chains

Recent U.S. tariff implementations and international trade policies are reshaping FC BGA Market dynamics, affecting regional competitive structures. Manufacturers are evaluating alternative supply chain configurations to mitigate risks, with particular attention to ABF substrate sourcing from Japan and South Korea.

Technology Adoption in Key Applications

The HPC/AI chips segment shows the fastest growth potential as advanced processors demand higher-density FC BGA packaging. Meanwhile, PC applications continue as the largest market segment due to sustained demand for performance computing.

Market Concentration Among Manufacturers

Top five FC BGA producers (Unimicron, Ibiden, AT&S, Nan Ya PCB, Shinko Electric) control 74% of the market. Recent capacity expansions in Taiwan highlight the region’s strategic importance in semiconductor packaging supply chains.

Regional Market Developments

Asia maintains market dominance with Taiwan, China, and South Korea collectively representing 64% of global FC BGA production. North American and European markets are focusing on supply chain resilience, with increased investments in testing and packaging facilities to reduce overseas dependencies.

COMPETITIVE LANDSCAPE

Key Industry Players

FC BGA Market Dominated by Asian Manufacturers with 74% Market Concentration

FC BGA Market exhibits high concentration with the top five players Unimicron, Ibiden, AT&S, Nan Ya PCB, and Shinko Electric Industries controlling approximately 74% of global production capacity. Taiwan remains the manufacturing epicenter, accounting for 30% of global output, followed by mainland China and South Korea at 17% each. Market leadership stems from advanced ABF substrate capabilities and strategic relationships with leading semiconductor companies, particularly for high-performance computing applications.

Niche players like Kinsus Interconnect and Zhen Ding Technology are gaining traction through specialized offerings in HPC/AI chip packaging, while Korean manufacturers like LG InnoTek and Semco maintain strong positions in server applications. Recent capacity expansions by Daeduck Electronics and Shennan Circuit indicate growing competition in the mid-layer (4-8 layer) substrate segment, which currently accounts for 69% of total FC BGA production. The market remains technology-driven, with R&D focused on finer pitch solutions below 20µm.

List of Key FC BGA Companies Profiled

Segment Analysis:

Segment Category Sub-Segments Key Insights
By Type
  • 4-8 Layers FCBGA Substrate
  • 8-16 Layers FCBGA Substrate
  • Others
4-8 Layers FCBGA Substrate dominates the market due to:

  • Widespread adoption in mainstream computing applications where cost-performance balance is critical
  • Superior reliability and thermal performance compared to lower layer counts
  • Established manufacturing infrastructure supporting mass production
By Application
  • PCs
  • Server & Data Center
  • HPC/AI Chips
  • Communication
  • Others
PCs represent the largest application segment because:

  • High-volume consumer electronics require cost-effective packaging solutions
  • Growing demand for compact, high-performance processors in laptops and desktops
  • Established supply chains supporting PC manufacturers globally
  • Emerging applications in gaming PCs and workstations driving premium segment growth
By End User
  • Consumer Electronics
  • Enterprise IT
  • Telecommunication
  • Automotive
Consumer Electronics leads due to:

  • Mass adoption in personal computing devices and smart appliances
  • Continuous innovation in mobile and wearable technologies
  • Strong aftermarket support and component replacement cycles
By Substrate Technology
  • ABF (Ajinomoto Build-up Film)
  • CSP (Chip Scale Packaging)
  • Other Advanced Substrates
ABF Substrates are preferred because:

  • Superior electrical performance for high-speed applications
  • Enables miniaturization of components in modern processors
  • Widespread adoption by leading semiconductor manufacturers
By Manufacturing Complexity
  • Standard FCBGA
  • High-Density FCBGA
  • Thermal-Enhanced FCBGA
Standard FCBGA maintains dominance owing to:

  • Cost-effectiveness for mainstream applications
  • Established design methodologies and testing protocols
  • Wider availability of manufacturing expertise and capacity

Regional Analysis: FC BGA Market

Asia-Pacific FC BGA Market

The Asia-Pacific region dominates the FC BGA Market, driven by robust electronics manufacturing ecosystems in China, South Korea, and Taiwan. The presence of leading semiconductor packaging firms and massive consumer electronics production has created ideal conditions for FC BGA adoption. Japan’s advanced materials science expertise further enhances regional capabilities in high-density packaging solutions. Governments across APAC have implemented favorable policies supporting semiconductor R&D, accelerating FC BGA technology development. The region benefits from strong supply chain integration, with component manufacturers located near assembly hubs. Growing demand for advanced packaging in automotive electronics and 5G infrastructure continues to fuel market expansion. Key players have established dedicated FC BGA production lines to meet both domestic and global demand.

Manufacturing Concentration
China’s Yangtze River Delta and Pearl River Delta regions host concentrated FC BGA production facilities, supported by mature IC packaging infrastructure. Taiwan’s Hsinchu Science Park serves as another critical manufacturing cluster for advanced FC BGA solutions.
Technology Leadership
South Korean and Japanese firms lead in developing fine-pitch FC BGA and substrate-less packaging variants. This technological edge allows APAC manufacturers to produce higher-density interconnects demanded by AI processors and advanced memory applications.
Supply Chain Advantages
Proximity to wafer fabs and substrate suppliers creates cost efficiencies in APAC’s FC BGA production. Regional material science advancements in underfill compounds and thermal interface materials further support packaging reliability requirements.
End-User Demand
Local smartphone brands, automotive Tier 1 suppliers, and data center operators drive strong domestic FC BGA consumption. This demand stability allows manufacturers to maintain high utilization rates and continuous process improvements.

North America FC BGA Market
North America maintains strong positions in high-value FC BGA segments, particularly for defense and aerospace applications. The region benefits from close collaboration between packaging firms and fabless semiconductor companies developing advanced processors. Silicon Valley’s ecosystem fosters innovative FC BGA solutions for AI accelerators and high-performance computing. Domestic manufacturers focus on specialized low-volume, high-margin production with stringent reliability requirements. Recent reshoring initiatives have increased investment in domestic FC BGA packaging capabilities.

Europe FC BGA Market
European FC BGA activity centers around automotive and industrial applications, with Germany and France as key markets. The region emphasizes reliability-focused packaging solutions for harsh environment applications. European firms collaborate closely with automotive OEMs to develop FC BGA packages meeting stringent automotive qualification standards. Research institutions contribute materials science innovations enabling higher temperature operation and vibration resistance in FC BGA packages.

South America FC BGA Market
South America’s FC BGA Market remains relatively small but shows growth potential in consumer electronics assembly. Brazil serves as the regional hub with developing packaging infrastructure. Most FC BGA components are imported, though local assembly of finished products creates some demand. The market faces challenges including limited local semiconductor infrastructure and reliance on global supply chains.

Middle East & Africa FC BGA Market
MEA’s FC BGA Market focuses on telecommunications infrastructure and oil/gas applications. The UAE and South Africa lead in regional technology adoption. Limited local manufacturing means most FC BGA packages are imported. However, growing data center construction and 5G deployments drive increasing demand. Some regional players are establishing FC BGA testing and qualification capabilities to serve local market needs.

Report Scope

This market research report provides a comprehensive analysis of the FC BGA Market, covering the forecast period 2025–2033. It offers detailed insights into market dynamics, technological advancements, competitive landscape, and key trends shaping the industry.

Key focus areas of the report include:

  • Market Overview: The report begins with an overview outlining its current market scenario, key growth indicators, and industry transformation drivers. It discusses macroeconomic factors, demand–supply balance, regulatory landscape, and the strategic role of semiconductors in powering advancements across industries such as automotive, telecommunications, consumer electronics, and industrial automation.
  • Market Size & Forecast: Historical data and future projections for revenue, unit shipments, and market value across major regions and segments.
  • Segmentation Analysis: Detailed breakdown by product type, technology, application, and end-user industry to identify high-growth segments and investment opportunities.
  • Regional Insights: Insights into market performance across North America, Europe, Asia-Pacific, Latin America, and the Middle East & Africa, including country-level analysis where relevant.
  • Competitive Landscape: Profiles of leading market participants, including their product offerings, R&D focus, manufacturing capacity, pricing strategies, and recent developments such as mergers, acquisitions, and partnerships.
  • Technology Trends & Innovation: Assessment of emerging technologies, integration of AI/IoT, semiconductor design trends, fabrication techniques, and evolving industry standards.
  • Market Drivers & Restraints: Evaluation of factors driving market growth along with challenges, supply chain constraints, regulatory issues, and market-entry barriers.
  • Stakeholder Insights: Insights for component suppliers, OEMs, system integrators, investors, and policymakers regarding the evolving ecosystem and strategic opportunities.

Primary and secondary research methods are employed, including interviews with industry experts, data from verified sources, and real-time market intelligence to ensure the accuracy and reliability of the insights presented.

FREQUENTLY ASKED QUESTIONS:

What is the current market size of FC BGA Market?

-> FC BGA Market was valued at USD 4,890 million in 2025 and is projected to reach USD 9,548 million by 2033, exhibiting a CAGR of 10.6% during the forecast period.

Which key companies operate in FC BGA Market?

-> Key players include Unimicron, Ibiden, AT&S, Nan Ya PCB, Shinko Electric Industries, Kinsus Interconnect, Semco, Kyocera, TOPPAN, and Zhen Ding Technology, among others. The top five players hold about 74% market share.

What are the key growth drivers?

-> Key growth drivers include increasing demand for high-performance semiconductor packaging, advancements in ABF substrate technology, and growth in PC and server markets.

Which region dominates the market?

-> China Taiwan is the world’s largest market for FC BGA with about 30% share, followed by China mainland and South Korea with 17% share each.

What are the key application segments?

-> The PCs segment dominates with about 40% market share, followed by Server & Data Center and HPC/AI Chips applications.

What are the major product types?

-> 4-8 Layers FCBGA Substrate accounts for the largest segment with about 69% market share.

FC BGA Market, Emerging Trends, Technological Advancements, and Business Strategies 2026-2033

Get Sample Report PDF for Exclusive Insights

Report Sample Includes

  • Table of Contents
  • List of Tables & Figures
  • Charts, Research Methodology, and more...
PDF Icon Download Sample Report PDF

Download Sample Report

Table of Content

1 Introduction to Research & Analysis Reports
1.1 FC BGA Market Definition
1.2 Market Segments
1.2.1 Segment by Type
1.2.2 Segment by Application
1.3 Global FC BGA Market Overview
1.4 Features & Benefits of This Report
1.5 Methodology & Sources of Information
1.5.1 Research Methodology
1.5.2 Research Process
1.5.3 Base Year
1.5.4 Report Assumptions & Caveats
2 Global FC BGA Overall Market Size
2.1 Global FC BGA Market Size: 2024 VS 2031
2.2 Global FC BGA Market Size, Prospects & Forecasts: 2020-2031
2.3 Global FC BGA Sales: 2020-2031
3 Company Landscape
3.1 Top FC BGA Players in Global Market
3.2 Top Global FC BGA Companies Ranked by Revenue
3.3 Global FC BGA Revenue by Companies
3.4 Global FC BGA Sales by Companies
3.5 Global FC BGA Price by Manufacturer (2020-2025)
3.6 Top 3 and Top 5 FC BGA Companies in Global Market, by Revenue in 2024
3.7 Global Manufacturers FC BGA Product Type
3.8 Tier 1, Tier 2, and Tier 3 FC BGA Players in Global Market
3.8.1 List of Global Tier 1 FC BGA Companies
3.8.2 List of Global Tier 2 and Tier 3 FC BGA Companies
4 Sights by Product
4.1 Overview
4.1.1 Segment by Type – Global FC BGA Market Size Markets, 2024 & 2031
4.1.2 4-8 Layers ABF Substrate
4.1.3 8-16 Layers ABF Substrate
4.1.4 Others
4.2 Segment by Type – Global FC BGA Revenue & Forecasts
4.2.1 Segment by Type – Global FC BGA Revenue, 2020-2025
4.2.2 Segment by Type – Global FC BGA Revenue, 2026-2031
4.2.3 Segment by Type – Global FC BGA Revenue Market Share, 2020-2031
4.3 Segment by Type – Global FC BGA Sales & Forecasts
4.3.1 Segment by Type – Global FC BGA Sales, 2020-2025
4.3.2 Segment by Type – Global FC BGA Sales, 2026-2031
4.3.3 Segment by Type – Global FC BGA Sales Market Share, 2020-2031
4.4 Segment by Type – Global FC BGA Price (Manufacturers Selling Prices), 2020-2031
5 Sights by Application
5.1 Overview
5.1.1 Segment by Application – Global FC BGA Market Size, 2024 & 2031
5.1.2 PCs
5.1.3 Server & Data Center
5.1.4 HPC/AI Chips
5.1.5 Communication
5.1.6 Others
5.2 Segment by Application – Global FC BGA Revenue & Forecasts
5.2.1 Segment by Application – Global FC BGA Revenue, 2020-2025
5.2.2 Segment by Application – Global FC BGA Revenue, 2026-2031
5.2.3 Segment by Application – Global FC BGA Revenue Market Share, 2020-2031
5.3 Segment by Application – Global FC BGA Sales & Forecasts
5.3.1 Segment by Application – Global FC BGA Sales, 2020-2025
5.3.2 Segment by Application – Global FC BGA Sales, 2026-2031
5.3.3 Segment by Application – Global FC BGA Sales Market Share, 2020-2031
5.4 Segment by Application – Global FC BGA Price (Manufacturers Selling Prices), 2020-2031
6 Sights by Region
6.1 By Region – Global FC BGA Market Size, 2024 & 2031
6.2 By Region – Global FC BGA Revenue & Forecasts
6.2.1 By Region – Global FC BGA Revenue, 2020-2025
6.2.2 By Region – Global FC BGA Revenue, 2026-2031
6.2.3 By Region – Global FC BGA Revenue Market Share, 2020-2031
6.3 By Region – Global FC BGA Sales & Forecasts
6.3.1 By Region – Global FC BGA Sales, 2020-2025
6.3.2 By Region – Global FC BGA Sales, 2026-2031
6.3.3 By Region – Global FC BGA Sales Market Share, 2020-2031
6.4 North America
6.4.1 By Country – North America FC BGA Revenue, 2020-2031
6.4.2 By Country – North America FC BGA Sales, 2020-2031
6.4.3 United States FC BGA Market Size, 2020-2031
6.4.4 Canada FC BGA Market Size, 2020-2031
6.4.5 Mexico FC BGA Market Size, 2020-2031
6.5 Europe
6.5.1 By Country – Europe FC BGA Revenue, 2020-2031
6.5.2 By Country – Europe FC BGA Sales, 2020-2031
6.5.3 Germany FC BGA Market Size, 2020-2031
6.5.4 France FC BGA Market Size, 2020-2031
6.5.5 U.K. FC BGA Market Size, 2020-2031
6.5.6 Italy FC BGA Market Size, 2020-2031
6.5.7 Russia FC BGA Market Size, 2020-2031
6.5.8 Nordic Countries FC BGA Market Size, 2020-2031
6.5.9 Benelux FC BGA Market Size, 2020-2031
6.6 Asia
6.6.1 By Region – Asia FC BGA Revenue, 2020-2031
6.6.2 By Region – Asia FC BGA Sales, 2020-2031
6.6.3 China FC BGA Market Size, 2020-2031
6.6.4 Japan FC BGA Market Size, 2020-2031
6.6.5 South Korea FC BGA Market Size, 2020-2031
6.6.6 Southeast Asia FC BGA Market Size, 2020-2031
6.6.7 India FC BGA Market Size, 2020-2031
6.7 South America
6.7.1 By Country – South America FC BGA Revenue, 2020-2031
6.7.2 By Country – South America FC BGA Sales, 2020-2031
6.7.3 Brazil FC BGA Market Size, 2020-2031
6.7.4 Argentina FC BGA Market Size, 2020-2031
6.8 Middle East & Africa
6.8.1 By Country – Middle East & Africa FC BGA Revenue, 2020-2031
6.8.2 By Country – Middle East & Africa FC BGA Sales, 2020-2031
6.8.3 Turkey FC BGA Market Size, 2020-2031
6.8.4 Israel FC BGA Market Size, 2020-2031
6.8.5 Saudi Arabia FC BGA Market Size, 2020-2031
6.8.6 UAE FC BGA Market Size, 2020-2031
7 Manufacturers & Brands Profiles
7.1 Unimicron
7.1.1 Unimicron Company Summary
7.1.2 Unimicron Business Overview
7.1.3 Unimicron FC BGA Major Product Offerings
7.1.4 Unimicron FC BGA Sales and Revenue in Global (2020-2025)
7.1.5 Unimicron Key News & Latest Developments
7.2 Ibiden
7.2.1 Ibiden Company Summary
7.2.2 Ibiden Business Overview
7.2.3 Ibiden FC BGA Major Product Offerings
7.2.4 Ibiden FC BGA Sales and Revenue in Global (2020-2025)
7.2.5 Ibiden Key News & Latest Developments
7.3 Nan Ya PCB
7.3.1 Nan Ya PCB Company Summary
7.3.2 Nan Ya PCB Business Overview
7.3.3 Nan Ya PCB FC BGA Major Product Offerings
7.3.4 Nan Ya PCB FC BGA Sales and Revenue in Global (2020-2025)
7.3.5 Nan Ya PCB Key News & Latest Developments
7.4 Shinko Electric Industries
7.4.1 Shinko Electric Industries Company Summary
7.4.2 Shinko Electric Industries Business Overview
7.4.3 Shinko Electric Industries FC BGA Major Product Offerings
7.4.4 Shinko Electric Industries FC BGA Sales and Revenue in Global (2020-2025)
7.4.5 Shinko Electric Industries Key News & Latest Developments
7.5 Kinsus Interconnect
7.5.1 Kinsus Interconnect Company Summary
7.5.2 Kinsus Interconnect Business Overview
7.5.3 Kinsus Interconnect FC BGA Major Product Offerings
7.5.4 Kinsus Interconnect FC BGA Sales and Revenue in Global (2020-2025)
7.5.5 Kinsus Interconnect Key News & Latest Developments
7.6 AT&S
7.6.1 AT&S Company Summary
7.6.2 AT&S Business Overview
7.6.3 AT&S FC BGA Major Product Offerings
7.6.4 AT&S FC BGA Sales and Revenue in Global (2020-2025)
7.6.5 AT&S Key News & Latest Developments
7.7 Semco
7.7.1 Semco Company Summary
7.7.2 Semco Business Overview
7.7.3 Semco FC BGA Major Product Offerings
7.7.4 Semco FC BGA Sales and Revenue in Global (2020-2025)
7.7.5 Semco Key News & Latest Developments
7.8 Kyocera
7.8.1 Kyocera Company Summary
7.8.2 Kyocera Business Overview
7.8.3 Kyocera FC BGA Major Product Offerings
7.8.4 Kyocera FC BGA Sales and Revenue in Global (2020-2025)
7.8.5 Kyocera Key News & Latest Developments
7.9 TOPPAN
7.9.1 TOPPAN Company Summary
7.9.2 TOPPAN Business Overview
7.9.3 TOPPAN FC BGA Major Product Offerings
7.9.4 TOPPAN FC BGA Sales and Revenue in Global (2020-2025)
7.9.5 TOPPAN Key News & Latest Developments
7.10 Zhen Ding Technology
7.10.1 Zhen Ding Technology Company Summary
7.10.2 Zhen Ding Technology Business Overview
7.10.3 Zhen Ding Technology FC BGA Major Product Offerings
7.10.4 Zhen Ding Technology FC BGA Sales and Revenue in Global (2020-2025)
7.10.5 Zhen Ding Technology Key News & Latest Developments
7.11 Daeduck Electronics
7.11.1 Daeduck Electronics Company Summary
7.11.2 Daeduck Electronics Business Overview
7.11.3 Daeduck Electronics FC BGA Major Product Offerings
7.11.4 Daeduck Electronics FC BGA Sales and Revenue in Global (2020-2025)
7.11.5 Daeduck Electronics Key News & Latest Developments
7.12 Shenzhen Fastprint Circuit Tech
7.12.1 Shenzhen Fastprint Circuit Tech Company Summary
7.12.2 Shenzhen Fastprint Circuit Tech Business Overview
7.12.3 Shenzhen Fastprint Circuit Tech FC BGA Major Product Offerings
7.12.4 Shenzhen Fastprint Circuit Tech FC BGA Sales and Revenue in Global (2020-2025)
7.12.5 Shenzhen Fastprint Circuit Tech Key News & Latest Developments
7.13 Zhuhai Access Semiconductor
7.13.1 Zhuhai Access Semiconductor Company Summary
7.13.2 Zhuhai Access Semiconductor Business Overview
7.13.3 Zhuhai Access Semiconductor FC BGA Major Product Offerings
7.13.4 Zhuhai Access Semiconductor FC BGA Sales and Revenue in Global (2020-2025)
7.13.5 Zhuhai Access Semiconductor Key News & Latest Developments
7.14 LG InnoTek
7.14.1 LG InnoTek Company Summary
7.14.2 LG InnoTek Business Overview
7.14.3 LG InnoTek FC BGA Major Product Offerings
7.14.4 LG InnoTek FC BGA Sales and Revenue in Global (2020-2025)
7.14.5 LG InnoTek Key News & Latest Developments
7.15 Shennan Circuit
7.15.1 Shennan Circuit Company Summary
7.15.2 Shennan Circuit Business Overview
7.15.3 Shennan Circuit FC BGA Major Product Offerings
7.15.4 Shennan Circuit FC BGA Sales and Revenue in Global (2020-2025)
7.15.5 Shennan Circuit Key News & Latest Developments
8 Global FC BGA Production Capacity, Analysis
8.1 Global FC BGA Production Capacity, 2020-2031
8.2 FC BGA Production Capacity of Key Manufacturers in Global Market
8.3 Global FC BGA Production by Region
9 Key Market Trends, Opportunity, Drivers and Restraints
9.1 Market Opportunities & Trends
9.2 Market Drivers
9.3 Market Restraints
10 FC BGA Supply Chain Analysis
10.1 FC BGA Industry Value Chain
10.2 FC BGA Upstream Market
10.3 FC BGA Downstream and Clients
10.4 Marketing Channels Analysis
10.4.1 Marketing Channels
10.4.2 FC BGA Distributors and Sales Agents in Global
11 Conclusion
12 Appendix
12.1 Note
12.2 Examples of Clients
12.3 DisclaimerList of Tables
Table 1. Key Players of FC BGA in Global Market
Table 2. Top FC BGA Players in Global Market, Ranking by Revenue (2024)
Table 3. Global FC BGA Revenue by Companies, (US$, Mn), 2020-2025
Table 4. Global FC BGA Revenue Share by Companies, 2020-2025
Table 5. Global FC BGA Sales by Companies, (K Square Meters), 2020-2025
Table 6. Global FC BGA Sales Share by Companies, 2020-2025
Table 7. Key Manufacturers FC BGA Price (2020-2025) & (US$/Sq m)
Table 8. Global Manufacturers FC BGA Product Type
Table 9. List of Global Tier 1 FC BGA Companies, Revenue (US$, Mn) in 2024 and Market Share
Table 10. List of Global Tier 2 and Tier 3 FC BGA Companies, Revenue (US$, Mn) in 2024 and Market Share
Table 11. Segment by Type – Global FC BGA Revenue, (US$, Mn), 2024 & 2031
Table 12. Segment by Type – Global FC BGA Revenue (US$, Mn), 2020-2025
Table 13. Segment by Type – Global FC BGA Revenue (US$, Mn), 2026-2031
Table 14. Segment by Type – Global FC BGA Sales (K Square Meters), 2020-2025
Table 15. Segment by Type – Global FC BGA Sales (K Square Meters), 2026-2031
Table 16. Segment by Application – Global FC BGA Revenue, (US$, Mn), 2024 & 2031
Table 17. Segment by Application – Global FC BGA Revenue, (US$, Mn), 2020-2025
Table 18. Segment by Application – Global FC BGA Revenue, (US$, Mn), 2026-2031
Table 19. Segment by Application – Global FC BGA Sales, (K Square Meters), 2020-2025
Table 20. Segment by Application – Global FC BGA Sales, (K Square Meters), 2026-2031
Table 21. By Region – Global FC BGA Revenue, (US$, Mn), 2025-2031
Table 22. By Region – Global FC BGA Revenue, (US$, Mn), 2020-2025
Table 23. By Region – Global FC BGA Revenue, (US$, Mn), 2026-2031
Table 24. By Region – Global FC BGA Sales, (K Square Meters), 2020-2025
Table 25. By Region – Global FC BGA Sales, (K Square Meters), 2026-2031
Table 26. By Country – North America FC BGA Revenue, (US$, Mn), 2020-2025
Table 27. By Country – North America FC BGA Revenue, (US$, Mn), 2026-2031
Table 28. By Country – North America FC BGA Sales, (K Square Meters), 2020-2025
Table 29. By Country – North America FC BGA Sales, (K Square Meters), 2026-2031
Table 30. By Country – Europe FC BGA Revenue, (US$, Mn), 2020-2025
Table 31. By Country – Europe FC BGA Revenue, (US$, Mn), 2026-2031
Table 32. By Country – Europe FC BGA Sales, (K Square Meters), 2020-2025
Table 33. By Country – Europe FC BGA Sales, (K Square Meters), 2026-2031
Table 34. By Region – Asia FC BGA Revenue, (US$, Mn), 2020-2025
Table 35. By Region – Asia FC BGA Revenue, (US$, Mn), 2026-2031
Table 36. By Region – Asia FC BGA Sales, (K Square Meters), 2020-2025
Table 37. By Region – Asia FC BGA Sales, (K Square Meters), 2026-2031
Table 38. By Country – South America FC BGA Revenue, (US$, Mn), 2020-2025
Table 39. By Country – South America FC BGA Revenue, (US$, Mn), 2026-2031
Table 40. By Country – South America FC BGA Sales, (K Square Meters), 2020-2025
Table 41. By Country – South America FC BGA Sales, (K Square Meters), 2026-2031
Table 42. By Country – Middle East & Africa FC BGA Revenue, (US$, Mn), 2020-2025
Table 43. By Country – Middle East & Africa FC BGA Revenue, (US$, Mn), 2026-2031
Table 44. By Country – Middle East & Africa FC BGA Sales, (K Square Meters), 2020-2025
Table 45. By Country – Middle East & Africa FC BGA Sales, (K Square Meters), 2026-2031
Table 46. Unimicron Company Summary
Table 47. Unimicron FC BGA Product Offerings
Table 48. Unimicron FC BGA Sales (K Square Meters), Revenue (US$, Mn) and Average Price (US$/Sq m) & (2020-2025)
Table 49. Unimicron Key News & Latest Developments
Table 50. Ibiden Company Summary
Table 51. Ibiden FC BGA Product Offerings
Table 52. Ibiden FC BGA Sales (K Square Meters), Revenue (US$, Mn) and Average Price (US$/Sq m) & (2020-2025)
Table 53. Ibiden Key News & Latest Developments
Table 54. Nan Ya PCB Company Summary
Table 55. Nan Ya PCB FC BGA Product Offerings
Table 56. Nan Ya PCB FC BGA Sales (K Square Meters), Revenue (US$, Mn) and Average Price (US$/Sq m) & (2020-2025)
Table 57. Nan Ya PCB Key News & Latest Developments
Table 58. Shinko Electric Industries Company Summary
Table 59. Shinko Electric Industries FC BGA Product Offerings
Table 60. Shinko Electric Industries FC BGA Sales (K Square Meters), Revenue (US$, Mn) and Average Price (US$/Sq m) & (2020-2025)
Table 61. Shinko Electric Industries Key News & Latest Developments
Table 62. Kinsus Interconnect Company Summary
Table 63. Kinsus Interconnect FC BGA Product Offerings
Table 64. Kinsus Interconnect FC BGA Sales (K Square Meters), Revenue (US$, Mn) and Average Price (US$/Sq m) & (2020-2025)
Table 65. Kinsus Interconnect Key News & Latest Developments
Table 66. AT&S Company Summary
Table 67. AT&S FC BGA Product Offerings
Table 68. AT&S FC BGA Sales (K Square Meters), Revenue (US$, Mn) and Average Price (US$/Sq m) & (2020-2025)
Table 69. AT&S Key News & Latest Developments
Table 70. Semco Company Summary
Table 71. Semco FC BGA Product Offerings
Table 72. Semco FC BGA Sales (K Square Meters), Revenue (US$, Mn) and Average Price (US$/Sq m) & (2020-2025)
Table 73. Semco Key News & Latest Developments
Table 74. Kyocera Company Summary
Table 75. Kyocera FC BGA Product Offerings
Table 76. Kyocera FC BGA Sales (K Square Meters), Revenue (US$, Mn) and Average Price (US$/Sq m) & (2020-2025)
Table 77. Kyocera Key News & Latest Developments
Table 78. TOPPAN Company Summary
Table 79. TOPPAN FC BGA Product Offerings
Table 80. TOPPAN FC BGA Sales (K Square Meters), Revenue (US$, Mn) and Average Price (US$/Sq m) & (2020-2025)
Table 81. TOPPAN Key News & Latest Developments
Table 82. Zhen Ding Technology Company Summary
Table 83. Zhen Ding Technology FC BGA Product Offerings
Table 84. Zhen Ding Technology FC BGA Sales (K Square Meters), Revenue (US$, Mn) and Average Price (US$/Sq m) & (2020-2025)
Table 85. Zhen Ding Technology Key News & Latest Developments
Table 86. Daeduck Electronics Company Summary
Table 87. Daeduck Electronics FC BGA Product Offerings
Table 88. Daeduck Electronics FC BGA Sales (K Square Meters), Revenue (US$, Mn) and Average Price (US$/Sq m) & (2020-2025)
Table 89. Daeduck Electronics Key News & Latest Developments
Table 90. Shenzhen Fastprint Circuit Tech Company Summary
Table 91. Shenzhen Fastprint Circuit Tech FC BGA Product Offerings
Table 92. Shenzhen Fastprint Circuit Tech FC BGA Sales (K Square Meters), Revenue (US$, Mn) and Average Price (US$/Sq m) & (2020-2025)
Table 93. Shenzhen Fastprint Circuit Tech Key News & Latest Developments
Table 94. Zhuhai Access Semiconductor Company Summary
Table 95. Zhuhai Access Semiconductor FC BGA Product Offerings
Table 96. Zhuhai Access Semiconductor FC BGA Sales (K Square Meters), Revenue (US$, Mn) and Average Price (US$/Sq m) & (2020-2025)
Table 97. Zhuhai Access Semiconductor Key News & Latest Developments
Table 98. LG InnoTek Company Summary
Table 99. LG InnoTek FC BGA Product Offerings
Table 100. LG InnoTek FC BGA Sales (K Square Meters), Revenue (US$, Mn) and Average Price (US$/Sq m) & (2020-2025)
Table 101. LG InnoTek Key News & Latest Developments
Table 102. Shennan Circuit Company Summary
Table 103. Shennan Circuit FC BGA Product Offerings
Table 104. Shennan Circuit FC BGA Sales (K Square Meters), Revenue (US$, Mn) and Average Price (US$/Sq m) & (2020-2025)
Table 105. Shennan Circuit Key News & Latest Developments
Table 106. FC BGA Capacity of Key Manufacturers in Global Market, 2023-2025 (K Square Meters)
Table 107. Global FC BGA Capacity Market Share of Key Manufacturers, 2023-2025
Table 108. Global FC BGA Production by Region, 2020-2025 (K Square Meters)
Table 109. Global FC BGA Production by Region, 2026-2031 (K Square Meters)
Table 110. FC BGA Market Opportunities & Trends in Global Market
Table 111. FC BGA Market Drivers in Global Market
Table 112. FC BGA Market Restraints in Global Market
Table 113. FC BGA Raw Materials
Table 114. FC BGA Raw Materials Suppliers in Global Market
Table 115. Typical FC BGA Downstream
Table 116. FC BGA Downstream Clients in Global Market
Table 117. FC BGA Distributors and Sales Agents in Global Market

List of Figures
Figure 1. FC BGA Product Picture
Figure 2. FC BGA Segment by Type in 2024
Figure 3. FC BGA Segment by Application in 2024
Figure 4. Global FC BGA Market Overview: 2024
Figure 5. Key Caveats
Figure 6. Global FC BGA Market Size: 2024 VS 2031 (US$, Mn)
Figure 7. Global FC BGA Revenue: 2020-2031 (US$, Mn)
Figure 8. FC BGA Sales in Global Market: 2020-2031 (K Square Meters)
Figure 9. The Top 3 and 5 Players Market Share by FC BGA Revenue in 2024
Figure 10. Segment by Type – Global FC BGA Revenue, (US$, Mn), 2024 & 2031
Figure 11. Segment by Type – Global FC BGA Revenue Market Share, 2020-2031
Figure 12. Segment by Type – Global FC BGA Sales Market Share, 2020-2031
Figure 13. Segment by Type – Global FC BGA Price (US$/Sq m), 2020-2031
Figure 14. Segment by Application – Global FC BGA Revenue, (US$, Mn), 2024 & 2031
Figure 15. Segment by Application – Global FC BGA Revenue Market Share, 2020-2031
Figure 16. Segment by Application – Global FC BGA Sales Market Share, 2020-2031
Figure 17. Segment by Application -Global FC BGA Price (US$/Sq m), 2020-2031
Figure 18. By Region – Global FC BGA Revenue, (US$, Mn), 2025 & 2031
Figure 19. By Region – Global FC BGA Revenue Market Share, 2020 VS 2024 VS 2031
Figure 20. By Region – Global FC BGA Revenue Market Share, 2020-2031
Figure 21. By Region – Global FC BGA Sales Market Share, 2020-2031
Figure 22. By Country – North America FC BGA Revenue Market Share, 2020-2031
Figure 23. By Country – North America FC BGA Sales Market Share, 2020-2031
Figure 24. United States FC BGA Revenue, (US$, Mn), 2020-2031
Figure 25. Canada FC BGA Revenue, (US$, Mn), 2020-2031
Figure 26. Mexico FC BGA Revenue, (US$, Mn), 2020-2031
Figure 27. By Country – Europe FC BGA Revenue Market Share, 2020-2031
Figure 28. By Country – Europe FC BGA Sales Market Share, 2020-2031
Figure 29. Germany FC BGA Revenue, (US$, Mn), 2020-2031
Figure 30. France FC BGA Revenue, (US$, Mn), 2020-2031
Figure 31. U.K. FC BGA Revenue, (US$, Mn), 2020-2031
Figure 32. Italy FC BGA Revenue, (US$, Mn), 2020-2031
Figure 33. Russia FC BGA Revenue, (US$, Mn), 2020-2031
Figure 34. Nordic Countries FC BGA Revenue, (US$, Mn), 2020-2031
Figure 35. Benelux FC BGA Revenue, (US$, Mn), 2020-2031
Figure 36. By Region – Asia FC BGA Revenue Market Share, 2020-2031
Figure 37. By Region – Asia FC BGA Sales Market Share, 2020-2031
Figure 38. China FC BGA Revenue, (US$, Mn), 2020-2031
Figure 39. Japan FC BGA Revenue, (US$, Mn), 2020-2031
Figure 40. South Korea FC BGA Revenue, (US$, Mn), 2020-2031
Figure 41. Southeast Asia FC BGA Revenue, (US$, Mn), 2020-2031
Figure 42. India FC BGA Revenue, (US$, Mn), 2020-2031
Figure 43. By Country – South America FC BGA Revenue Market Share, 2020-2031
Figure 44. By Country – South America FC BGA Sales, Market Share, 2020-2031
Figure 45. Brazil FC BGA Revenue, (US$, Mn), 2020-2031
Figure 46. Argentina FC BGA Revenue, (US$, Mn), 2020-2031
Figure 47. By Country – Middle East & Africa FC BGA Revenue, Market Share, 2020-2031
Figure 48. By Country – Middle East & Africa FC BGA Sales, Market Share, 2020-2031
Figure 49. Turkey FC BGA Revenue, (US$, Mn), 2020-2031
Figure 50. Israel FC BGA Revenue, (US$, Mn), 2020-2031
Figure 51. Saudi Arabia FC BGA Revenue, (US$, Mn), 2020-2031
Figure 52. UAE FC BGA Revenue, (US$, Mn), 2020-2031
Figure 53. Global FC BGA Production Capacity (K Square Meters), 2020-2031
Figure 54. The Percentage of Production FC BGA by Region, 2024 VS 2031
Figure 55. FC BGA Industry Value Chain
Figure 56. Marketing Channels