SEMICONDUCTOR INSIGHT
MARKET RESEARCH REPORT

External and Internal SSD Market

2026 to 2034
MARKET INTELLIGENCE
ACROSS KEY REGIONS
2026 EDITION
INTEGRATED CIRCUITS Semiconductor Market Research

External and Internal SSD Market

Trends, Business Strategies 2026-2034

◷
UPDATED 08 September 2026
▤
REPORT LENGTH Detailed Report
▣
REPORT CODE 0b2d82e090cd
▯
FORMATS PDF

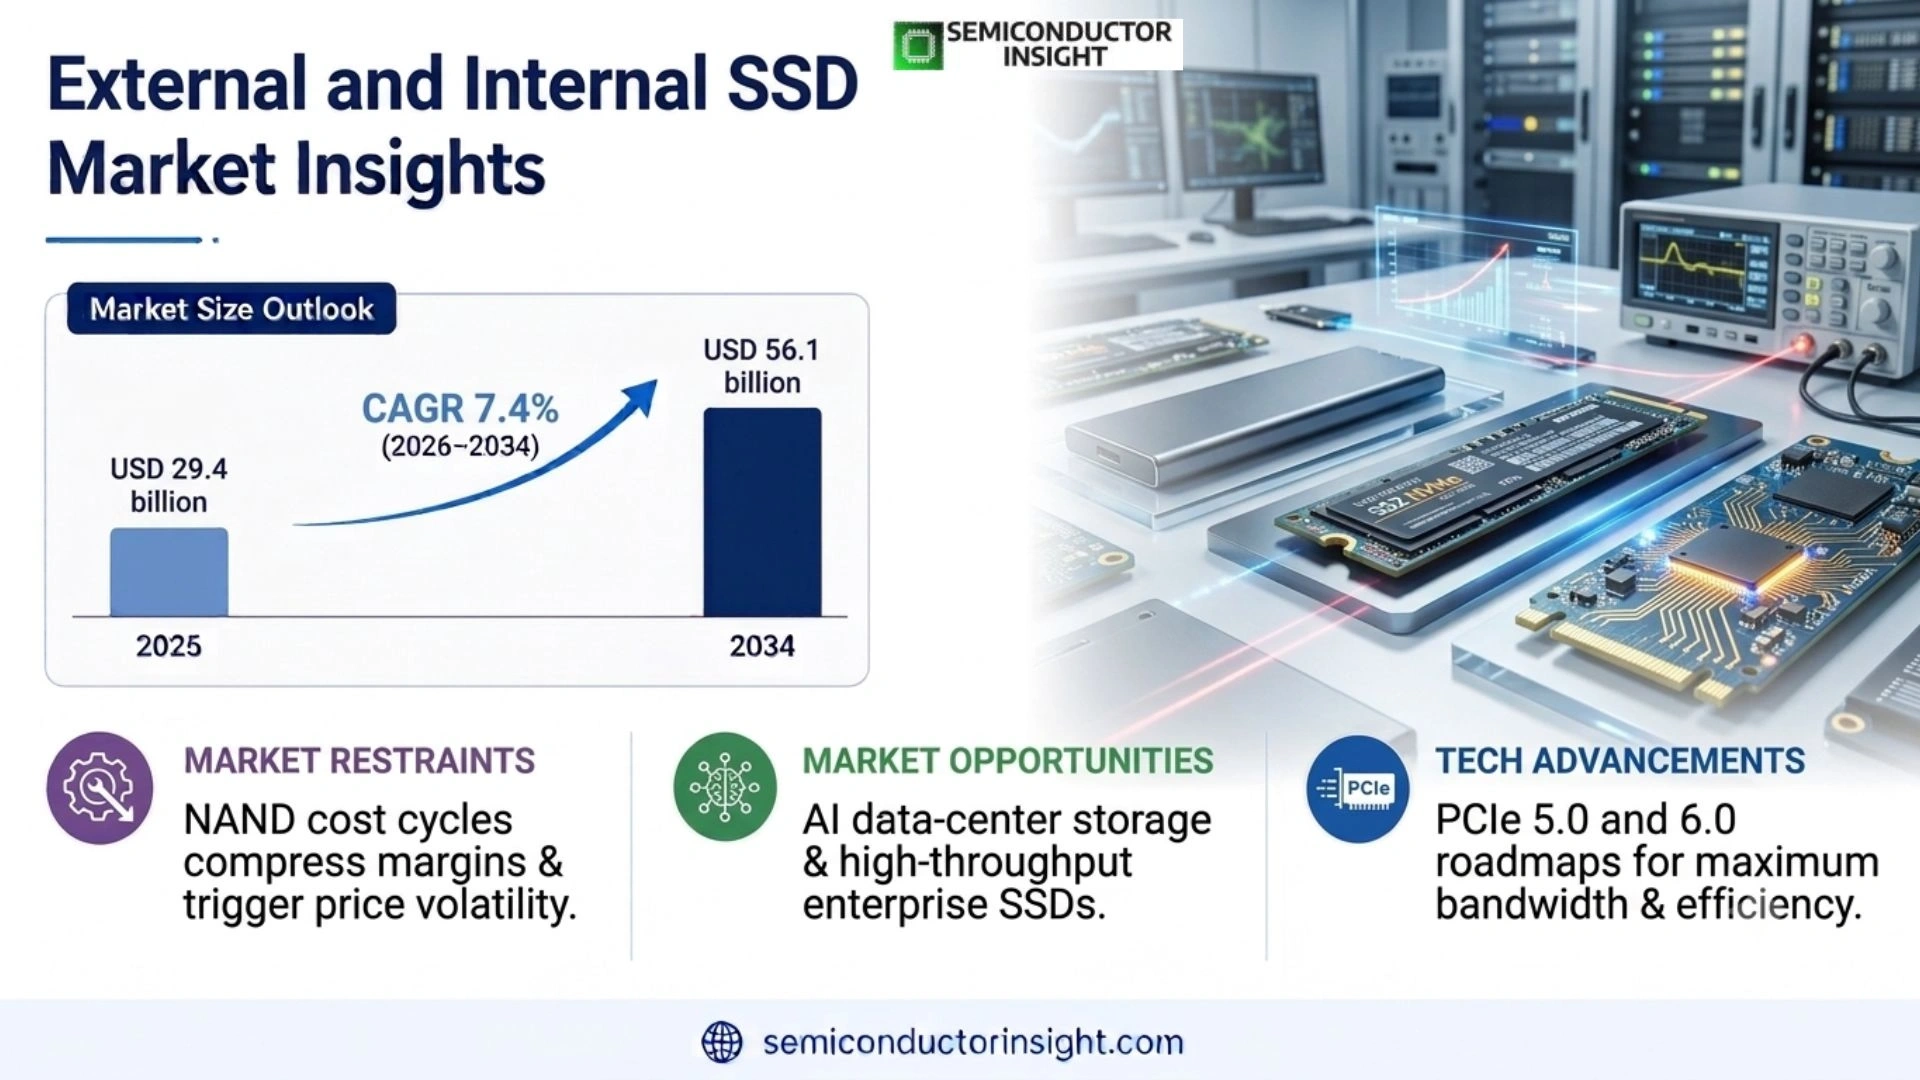
External and internal SSD market is projected to grow USD 56.1 billion by 2034, registering a CAGR of 7.4% during 2026–2034.

Get the sample PDF with study scope, segmentation and methodology details.

Key Statistics

2025 Market Size
USD 29.4 billion
2034 Projected Size
USD 56.1 billion
CAGR (2026–2034)
7.4%
Largest Market in 2025
Asia Pacific – >45% share (2024)

Key Takeaways

  • Market scale reaches USD 29.4 billion in 2025 and USD 56.1 billion by 2034 at a CAGR of 7.4% during 2026–2034; Internal SSDs remain the largest type, supported by notebooks, desktops, workstations and enterprise servers, while external SSDs expand through portable backup, gaming and creator workloads.
  • Enterprise SSDs are the main high-value growth engine as AI and cloud workloads raise demand for bandwidth, IOPS, endurance, security and large capacities.
  • 1TB–2TB is an important capacity growth pocket as higher storage requirements become standard in premium client systems and professional workstations.
  • Asia Pacific leads the regional market and combines NAND fabrication, SSD manufacturing, electronics assembly and strong local device demand.
  • PCIe Gen5 and Gen6 are shifting competition toward bandwidth per watt, controller efficiency and thermal design, especially in AI-oriented data-center deployments.

External and Internal SSD Market Overview

External and internal SSD market is projected to grow from USD 29.4 billion in 2025 to USD 56.1 billion by 2034, registering a CAGR of 7.4% during 2026–2034. Asia Pacific held more than 45% of the market in 2024 and remains the leading regional center. The market covers internal and external SSDs, enterprise and client applications, storage capacities and interfaces. external and internal SSD market follows the defined market scope.

Base year: 2025 · Forecast period: 2026–2034 · Historical period: 2020–2024 · Values in USD · Storage capacities and interfaces follow the defined segmentation

A solid-state drive stores data in NAND flash and uses a controller and firmware stack to manage data placement, error correction, wear and host communication. Internal SSDs are integrated into client and server systems, while external SSDs combine storage electronics with an enclosure and external interface. The commercial product therefore depends on NAND density, controller design, firmware, thermal behavior, security and qualification rather than flash capacity alone.

Client purchasing is driven by system responsiveness, capacity, power consumption, physical compatibility and price. Enterprise purchasing adds endurance, predictable latency, IOPS, sustained bandwidth, security, telemetry and long-term availability. This creates two distinct competitive models: high-volume standardized client products where OEM scale and cost are crucial, and enterprise drives where qualification, firmware maturity and workload behavior create higher barriers to supplier switching.

The market is changing as AI systems move more data through storage. Samsung’s 2026 PM1763 uses PCIe 6.0, 9th-generation V-NAND and a 4 nm controller, reaching up to 28,400 MB/s sequential read and 21,900 MB/s write in the 16 TB configuration. Micron has also introduced PCIe Gen6 enterprise products and very high-capacity drives, showing that enterprise SSD value is increasingly connected to data movement, capacity density and power efficiency.

Technical performance and capacity reference points

Recent enterprise SSD specifications show how quickly the performance envelope is moving. Samsung’s PM1763 uses PCIe 6.0, 9th-generation V-NAND and a 4 nm controller, with 4 TB, 8 TB and 16 TB options; its 16 TB version reaches 28,400 MB/s read and 21,900 MB/s write and can transfer a 40 GB LLM in about 1.4 seconds. The same product improves power efficiency by more than 1.8 times versus PM1753. These figures move storage purchasing toward bandwidth, cooling and rack-level efficiency.

Micron’s enterprise portfolio adds another set of benchmarks: the PCIe Gen6 9650 reaches 28 GB/s read and 14 GB/s write, while its enterprise range includes a 122 TB product with a path toward 245 TB. Reported random I/O figures reach about 5.5 million read IOPS and 900,000 write IOPS on the 9650, while selected workloads show 25% and 67% energy-efficiency improvements versus prior-generation comparisons. The commercial effect is higher value per physical drive and stronger emphasis on workload-specific performance.

Client and established enterprise products show the breadth of the performance ladder. Samsung’s PM1743 uses PCIe 5.0 at 32 GT/s and reaches 13,000 MB/s read and 6,600 MB/s write across 1.92 TB to 15.36 TB configurations, while its efficiency figure reaches 608 MB/s per watt. PM9E1 reaches 14.5 GB/s read and 13 GB/s write across 512 GB, 1 TB, 2 TB and 4 TB options, with more than 50% power-efficiency improvement. Sandisk’s SN861 reaches 15.36 TB, supports PCIe Gen5 and NVMe 2.0, and includes OCP 2.5 alignment, power-loss protection and a 5-year warranty.

The SSD performance ladder contains multiple measurable reference points: PCIe 4.0, 5.0 and 6.0 interfaces; Samsung PM1743 at 32 GT/s with up to 13,000 MB/s read and 6,600 MB/s write; PM1763 at up to 28,400 MB/s read and 21,900 MB/s write; PM9E1 at up to 14.5 GB/s read and 13 GB/s write; Micron 9650 at up to 28 GB/s read and 14 GB/s write; 5.5 million read IOPS and 900,000 write IOPS in cited enterprise benchmarks; more than 1.8 times power efficiency for PM1763; and about 1.4 seconds to move a 40 GB LLM in Samsung’s 16 TB example.

Capacity is moving through a broad ladder from Below 500GB to 500GB–1TB, 1TB–2TB and Above 2TB in the defined segmentation, while enterprise examples now include 1.92 TB, 4 TB, 8 TB, 15.36 TB, 16 TB, 61 TB, 122 TB and a 245 TB roadmap. Micron has cited 25% and 67% energy-efficiency improvements in selected comparisons, Samsung’s PM9E1 covers 512 GB, 1 TB, 2 TB and 4 TB options, Sandisk’s SN861 reaches 15.36 TB with PCIe Gen5 and NVMe 2.0, and SK hynix’s 321-layer 2 Tb QLC NAND supports the next high-density enterprise SSD generation.

Enterprise storage specifications similarly span 1.92 TB, 4 TB, 8 TB, 15.36 TB, 16 TB, 61 TB, 122 TB and 245 TB capacities; 5-year warranty periods on selected enterprise products; 2.0 and 2.5 generation standards; 28,400 MB/s, 21,900 MB/s, 14,500 MB/s, 13,000 MB/s and 6,600 MB/s throughput levels; 28 GB/s and 14 GB/s PCIe Gen6 figures; 5.5 million and 900,000 IOPS benchmarks; 32 GT/s PCIe 5.0 signaling; 4 nm controllers; 9th-generation NAND; 321-layer QLC; 2 Tb NAND dies; 512 GB, 1 TB, 2 TB and 4 TB client options; and more than 1.8 times or 50% power-efficiency improvements in selected product generations. These figures illustrate how the market is moving simultaneously on speed, density and efficiency.

For commercial planning, the SSD market combines 2 major type groups, 2 application groups, 4 capacity bands and 5 interface categories across 5 regions in a 2025 base to 2034 forecast. Representative client and enterprise figures include 500 GB, 1 TB, 2 TB, 4 TB, 15.36 TB, 16 TB, 61 TB, 122 TB and 245 TB; interface generations include PCIe 4.0, 5.0 and 6.0; high-end performance spans 6,600 MB/s, 13,000 MB/s, 14,500 MB/s, 21,900 MB/s and 28,400 MB/s; and efficiency examples include 50% and 1.8 times improvements. These values explain the widening performance and capacity ladder.

Segment Analysis: By Type

The type segmentation separates Internal SSD and External SSD. Internal SSDs are the larger category as storage is integrated into notebooks, desktops, workstations and enterprise servers, while external SSDs are positioned for faster growth in portable backup, gaming, professional media and field workflows where fast transfer and mobility create a direct purchasing benefit.

Type Configuration Market position and commercial logic
Internal SSD SATA, PCIe, NVMe and Others Largest category across client and enterprise systems. Internal products benefit from direct host integration and OEM design wins. Competition centers on NAND generation, controller efficiency, firmware behavior, endurance, power and thermal performance, with PCIe-based NVMe rapidly taking share from legacy SATA in new high-performance platforms.
External SSD Portable SSD, Desktop SSD and Others Faster-growing category supported by data backup, gaming, video production and transfer of large datasets. Products compete on sustained throughput, portability, enclosure thermals, durability and interface compatibility. The segment also faces price pressure as flash becomes standardized, so software, design and channel strength can protect differentiation.

Storage capacity and interface architecture

The defined capacity segments are Below 500GB, 500GB–1TB, 1TB–2TB and Above 2TB, while interfaces include SATA, SAS, PCIe, NVMe and Others. Capacity changes the amount of NAND content per drive and increasingly influences enterprise economics through drive-count reduction, while interface determines the maximum host throughput and the controller complexity required to deliver it reliably.

Segment Analysis: By Application

Applications are divided into Enterprise and Client. Enterprise is the higher-value category as AI, cloud, databases and analytics impose quantified requirements on bandwidth, latency, endurance, security and capacity. Client SSDs remain the broadest volume pool, supported by notebooks, desktops and workstations that are upgrading from SATA to PCIe-based architectures. For suppliers, the commercial implication is to align product positioning with measurable workload performance, system qualification, thermal behavior and lifecycle support rather than treating every SSD category as a uniform storage commodity.

Application Demand characteristics
Enterprise Hyperscale data centers, AI servers, cloud platforms and enterprise storage buy SSDs against workload metrics. High IOPS, sustained bandwidth, endurance, power efficiency, capacity and security can all influence platform qualification. Long validation periods mean firmware quality and stable supply matter alongside the flash and controller specifications.
Client Consumer and professional computers purchase SSDs for fast boot, application responsiveness, capacity and low power. OEMs focus on cost, thermals, physical compatibility and supply continuity, while retail buyers compare capacity, interface, warranty and performance. PCIe 4.0 and 5.0 upgrades create replacement demand as host platforms and applications increase storage throughput requirements.

Capacity and interface purchasing triggers

Capacity is purchased against the amount of data a system must retain locally, while interface speed is purchased against the ability of the workload to exploit that storage. A 2 TB drive with a high-performance controller may be attractive to a creator workstation, while a lower-cost SATA drive can remain appropriate for replacement systems. Enterprise customers add endurance and predictable latency, making the same capacity number commercially different across segments.
External and Internal SSD Market Size 2026

Regional Analysis

Asia Pacific leads the external and internal SSD market, with the report scope indicating more than 45% share in 2024. North America is the strongest enterprise and AI infrastructure hub, Europe emphasizes industrial and professional computing, South America is channel and import dependent, and Middle East & Africa demand is concentrated in data-center projects and premium systems.

How does regional demand differ across the external and internal SSD market?

The regional structure follows the storage value chain. Asia Pacific combines NAND fabrication, SSD production and electronics assembly with large downstream device demand. North America concentrates hyperscale and enterprise storage procurement, Europe has a large industrial and professional computing base, and South America and Middle East & Africa purchase a greater proportion of SSDs through imported systems and regional distributors. Supplier strategies therefore differ materially by region.

Region Position Growth outlook Demand profile Supplier selection
Asia Pacific Largest High NAND, client and enterprise storage NAND/controller access, local supply, OEM qualification and price competitiveness are decisive.
North America Enterprise hub High in AI/data center Cloud, AI and premium computing Platform validation, endurance, security, capacity and power efficiency drive selection.
Europe Established Moderate Industrial, enterprise and professional client Reliability, efficiency, lifecycle support and documentation influence awards.
South America Smaller base Moderate Imported client and enterprise storage Landed cost, channel stock, compatibility and warranty are critical.
Middle East & Africa Smallest base Selective project growth Data centers, enterprise systems and premium devices Integrator qualification, delivery reliability and service determine access.

Detailed Regional Blocks

Asia Pacific LARGEST REGIONAL MARKET

Why does Asia Pacific lead the external and internal SSD market?

Asia Pacific leads through the combination of NAND memory production, SSD manufacturing, electronics assembly and strong regional demand. This integrated ecosystem allows suppliers to move quickly from higher-density flash generations into qualified SSD products and then into notebooks, servers, consumer devices and enterprise infrastructure. The region’s strength is therefore both a supply-chain position and a large downstream customer base.

Market positionLargest; >45% share in 2024
Growth outlookHigh across segments
Demand profileManufacturing plus local consumption
Market access gateQualification and supply continuity
Country Position in region What drives demand
China Largest downstream ecosystem Large PC, electronics and data-center markets support internal and external SSD demand, while domestic storage brands and module suppliers broaden channel competition.
South Korea Major NAND and SSD center Advanced NAND manufacturing and enterprise SSD engineering create upstream supply strength and support high-performance storage product development.
Japan Advanced systems market Industrial computing, professional systems and storage technology create demand for reliability, efficiency and long-life products.

Market instances

  • August 24, 2025 – SK hynix announced mass production of 321-layer 2 Tb QLC NAND aimed at enterprise SSDs and AI data centers, with customer validation planned for the first half of 2026. Higher density can support larger capacities and lower cost per stored terabyte, strengthening the region’s role in high-capacity SSD supply. SK hynix announcement.
  • July 8, 2026 – Samsung began mass production of PM1763, a PCIe 6.0 enterprise SSD using 9th-generation V-NAND and a 4 nm controller. The 16 TB drive reaches up to 28,400 MB/s read and 21,900 MB/s write, showing how Asian suppliers are pushing storage into AI infrastructure where bandwidth and thermal efficiency are system constraints. Samsung announcement.
  • Samsung’s PM1743 enterprise SSD introduced PCIe 5.0 performance with up to 13,000 MB/s sequential read and 6,600 MB/s write, supporting 1.92 TB to 15.36 TB configurations. The product illustrates the transition toward higher-speed server storage and the importance of enterprise platform qualification for competitive strength. Samsung PM1743.

Full-report note: Asia Pacific is the market’s core production and demand cluster. Suppliers need NAND access, strong controller roadmaps, local technical resources and reliable OEM qualification. For suppliers, the commercial implication is to align product positioning with measurable workload performance, system qualification, thermal behavior and lifecycle support rather than treating every SSD category as a uniform storage commodity.

North America ENTERPRISE & AI HUB

What is driving SSD demand in North America?

North American SSD demand is especially strong in enterprise storage, hyperscale cloud, AI systems and premium client computing. The purchasing trigger is workload performance rather than storage volume alone, so buyers evaluate bandwidth, IOPS, latency, endurance, power and security. Suppliers with validated products and stable firmware can command stronger positions than vendors competing only on capacity or retail pricing.

Market positionMajor enterprise hub
Growth outlookHigh in data center
Demand profileCloud, AI, servers and premium client
Market access gateQualification, security and endurance
Country Position in region What drives demand
United States Largest enterprise demand base Hyperscale data centers and AI infrastructure create strong demand for high-capacity, high-IOPS and high-bandwidth enterprise SSDs.
Canada Professional and data-center demand Cloud and professional computing provide a smaller but technically demanding market emphasizing reliability and service support.
Mexico Manufacturing and systems ecosystem Regional electronics and server-related assembly creates demand for qualified storage integrated into systems shipped across the Americas.

Market instances

  • Micron’s 2025 enterprise SSD portfolio included the PCIe Gen6 9650 with up to 28 GB/s read and 14 GB/s write and the 6600 ION with capacities up to 122 TB and a future 245 TB path. These specifications show that AI-oriented storage is increasing both the performance and capacity value of individual drives. Micron portfolio announcement.
  • Micron’s 2026 investor materials describe accelerating data-center NAND demand associated with AI, vector databases and key-value cache offload while PCIe Gen6 SSDs move into high-volume production. The market effect is a closer connection between storage demand and accelerator utilization, making enterprise SSD roadmaps an infrastructure planning variable. Micron investor presentation.
  • Micron’s client-storage disclosures for fiscal 2025 described record client SSD revenue and qualification activity. The development supports a second North American demand mechanism: faster interfaces and higher capacities can generate replacement value within a mature PC market even when unit growth is cyclical. Micron investor presentation.

Full-report note: North America is an enterprise qualification market. Suppliers should emphasize endurance, platform validation, security, power efficiency and stable supply for AI and cloud deployments. For suppliers, the commercial implication is to align product positioning with measurable workload performance, system qualification, thermal behavior and lifecycle support rather than treating every SSD category as a uniform storage commodity.

Europe INDUSTRIAL & EFFICIENCY-LED

How is Europe shaping the SSD market?

Europe’s SSD demand spans industrial PCs, automotive electronics, enterprise computing, professional workstations and regulated digital infrastructure. The purchasing logic often gives higher weight to lifecycle support, reliability and energy efficiency as many systems operate continuously or remain installed for years. Suppliers can defend positions through stable firmware, documented endurance and long-term product availability even where a low-cost drive is available.

Market positionEstablished market
Growth outlookModerate specialist growth
Demand profileIndustrial and professional computing
Market access gateReliability and lifecycle
Country Position in region What drives demand
Germany Industrial and automotive center Factory automation, embedded computing and vehicle systems use storage where stable supply and reliability can be more valuable than the lowest unit cost.
France Enterprise and public computing Professional systems and public digital infrastructure support SSD demand with strong documentation and lifecycle requirements.
Netherlands High-tech systems hub Semiconductor and advanced-equipment ecosystems create demand for storage inside complex systems where predictable performance is important.

Market instances

  • Samsung’s PM9E1 PCIe 5.0 client SSD reaches up to 14.5 GB/s sequential read and 13 GB/s write while emphasizing improved power efficiency. The product illustrates a European-relevant purchasing trigger: higher throughput is valuable when it can be achieved within a constrained power and thermal envelope in workstations and premium PCs. Samsung PM9E1.
  • Samsung’s move from PCIe 5.0 enterprise SSDs toward the PCIe 6.0 PM1763 demonstrates the pace of interface transitions in high-performance storage. For European industrial systems, the commercial issue is whether newer throughput can be sustained without exceeding rack, enclosure or cooling limits, which makes power efficiency a qualification variable alongside bandwidth. Samsung PM1763.
  • Sandisk’s SN861 enterprise NVMe SSD supports PCIe Gen5 and capacities up to 15.36 TB with power-loss protection and end-to-end protection features. The product reinforces the shift toward storage qualification on reliability and protection as well as speed, supporting demand in professional and industrial deployments. Sandisk enterprise SSD.

Full-report note: Europe rewards reliability, efficiency and lifecycle support. Suppliers should target industrial, enterprise and professional systems with stable long-term product roadmaps. For suppliers, the commercial implication is to align product positioning with measurable workload performance, system qualification, thermal behavior and lifecycle support rather than treating every SSD category as a uniform storage commodity.

South America CHANNEL-DEPENDENT IMPORT MARKET

What shapes SSD adoption in South America?

South America depends heavily on imported storage components and finished computing systems, so distributor inventory, price and compatibility influence purchase decisions. Client upgrade demand is an important volume source, while enterprise and industrial systems create higher-value niches. Suppliers can improve market access by offering a clear ladder from mainstream 500GB and 1TB drives to 2TB and higher-capacity products with dependable warranty support.

Market positionSmaller regional base
Growth outlookModerate
Demand profileClient upgrades and imported enterprise
Market access gateChannel stock and landed cost
Country Position in region What drives demand
Brazil Largest addressable base Large PC and enterprise installed base supports upgrades, gaming, workstations and imported server storage.
Argentina Selective premium market Professional computing and replacement storage depend strongly on distributor availability and product pricing.
Chile Industrial and professional niche Mining, industrial systems and professional computing create demand where reliability and rapid data access justify higher-value SSD products.

Market instances

  • Samsung’s PCIe 5.0 storage products demonstrate the transition toward multi-gigabyte-per-second sequential performance in premium systems. For South America, the commercial opportunity is to translate that technology ladder into compatible upgrade products available through local channels rather than assuming every buyer needs the highest interface generation. Samsung enterprise SSD.
  • Sandisk’s SN861 range reaches 15.36 TB and adds enterprise protection features. Such products demonstrate why professional buyers increasingly compare storage on capacity, reliability and protection, creating a higher-value segment for distributors that can support workstation and business customers rather than competing solely in entry-level retail drives. Sandisk enterprise SSD.
  • Micron’s client SSD disclosures show that qualification and higher-value client storage continue to create revenue opportunities. In an import-dependent market, the value of a clear compatibility matrix across 500 GB, 1 TB, 2 TB and higher-capacity drives is stronger, allowing channels to serve both routine replacement and premium upgrade customers. Micron presentation.

Full-report note: South America is channel-sensitive. Strong distributors, compatibility guidance, inventory depth and warranty support are the main levers for converting global SSD roadmaps into local sales. For suppliers, the commercial implication is to align product positioning with measurable workload performance, system qualification, thermal behavior and lifecycle support rather than treating every SSD category as a uniform storage commodity.

Middle East & Africa DATA-CENTER & PROJECT-LED

Which Middle Eastern and African SSD applications are growing fastest?

Demand is concentrated in data-center projects, enterprise systems, professional computing and premium devices. Purchases often flow through system integrators, so delivery reliability, qualification documents and on-site service can determine the award. External SSDs support portable content and backup uses, while enterprise drives gain value from larger capacities and higher throughput as regional digital infrastructure scales.

Market positionSmallest regional base
Growth outlookSelective project growth
Demand profileData centers and premium systems
Market access gateIntegrator qualification and delivery
Country Position in region What drives demand
Saudi Arabia Data-center project hub Digital infrastructure and enterprise projects create demand for server storage that must meet platform, power and capacity requirements.
United Arab Emirates High-value infrastructure market Data centers, financial systems and premium electronics support demand for high-capacity and secure storage.
South Africa Established enterprise market Telecom, financial, industrial and media workloads sustain demand through enterprise channels and systems integrators.

Market instances

  • Samsung’s PM1763 is optimized for liquid-cooled server environments and supports up to 28,400 MB/s sequential read and 21,900 MB/s write at 16 TB. The development matters for regional data-center projects where storage performance increasingly interacts with rack cooling and power design, giving integrators a larger role in SSD selection. Samsung PM1763.
  • SK hynix’s 321-layer 2 Tb QLC NAND targets enterprise SSDs and AI data centers and was tied to customer validation in the first half of 2026. Higher density allows larger capacity per physical drive, supporting project buyers that want to reduce drive count, storage footprint and the number of components managed in a rack. SK hynix announcement.
  • Sandisk enterprise SSD products include capacities up to 15.36 TB and protection features such as power-loss protection and end-to-end data protection. These characteristics demonstrate the infrastructure orientation of enterprise storage and create a stronger value proposition for projects where downtime, data integrity and service costs matter. Sandisk enterprise source.

Full-report note: The region is project-led rather than volume-led. Suppliers should work with capable integrators and align drive roadmaps with server qualification, cooling, security and capacity requirements. For suppliers, the commercial implication is to align product positioning with measurable workload performance, system qualification, thermal behavior and lifecycle support rather than treating every SSD category as a uniform storage commodity.

Competitive Landscape

Competition spans NAND manufacturers, integrated SSD suppliers, independent storage brands and PC or server OEM channels. NAND producers have an upstream strength through flash supply and density roadmaps, while independent vendors compete with controller selection, firmware, qualification and distribution. Enterprise drives create higher entry barriers as endurance, latency, security and platform validation must remain stable under sustained workloads.

NAND suppliers capture a large share of underlying SSD economics, especially when supply conditions tighten and flash allocation determines which product categories can ship. Integrated manufacturers can coordinate NAND, controller and firmware roadmaps, while independent brands gain flexibility through multiple flash sources and controller options. That flexibility helps them serve channels quickly but can increase exposure to component price cycles.

Enterprise competition is increasingly measured in workload behavior. AI servers can require high random I/O, sustained bandwidth and predictable latency, while very high capacities create thermal and endurance considerations. Vendors therefore compete on controller architecture, firmware quality, security, qualification resources and long-term support. The result is a market where technical validation can be more important than retail brand recognition.

Client SSDs are more price sensitive and depend heavily on OEM relationships, distribution reach and capacity-per-dollar. External SSDs add enclosure design, portability, interface controller performance and software support as differentiation points. Suppliers that build a clear ladder from mainstream 500GB and 1TB products through 2TB and higher-capacity premium drives can address multiple price tiers without abandoning the underlying technology roadmap.

Key Industry Players

  • Samsung
  • Western Digital (SanDisk)
  • Kioxia
  • SK hynix
  • Kingston
  • Micron (Crucial)
  • Intel
  • ADATA Technology
  • Kimtigo
  • Shenzhen Longsys (Lexar)
  • Netac Technology
  • Transcend
  • Seagate
  • GIGABYTE
  • Lenovo
  • HP
  • Yangtze Memory (ZhiTai)

Tier structure

Competitive tier Participants How competition is won
Integrated memory and SSD suppliers NAND-linked and integrated storage companies Control of NAND, controllers and firmware supports cost, performance and roadmap coordination, giving these suppliers an strength in major OEM and enterprise programs.
Enterprise SSD specialists High-performance storage vendors Workload qualification, endurance, security, telemetry and platform support determine premium positioning, particularly in cloud and AI infrastructure.
Client and external storage brands Consumer and professional storage vendors Channel reach, capacity pricing, enclosure design, warranty and compatibility drive volume, with premium tiers supported by faster interfaces and larger capacities.

External and Internal SSD Production Capacity Analysis

SSD production capacity depends on NAND availability, controller supply, packaging, firmware development and final-drive qualification. NAND wafer capacity determines the largest upstream constraint, while controller and firmware qualification can become the bottleneck for high-performance enterprise products. High-density NAND increases bits per wafer, but usable output still depends on yield and the ability to qualify the resulting drive under the customer’s workload.

NAND fabrication is capital intensive and concentrated among a relatively small group of memory manufacturers. Capacity decisions can change the availability and cost of flash across SSD categories, while manufacturers may redirect output toward enterprise, mobile or client markets according to profitability and strategic demand. Suppliers without direct flash production therefore need contracts and inventory strategies that protect availability during sharp cycle changes.

Controller supply becomes increasingly important as interfaces move from SATA through PCIe 4.0, 5.0 and 6.0. Higher-performance controllers integrate more error correction, power management and security, and enterprise products can add dual-port operation and advanced protection. Qualification takes time, so a controller shortage can constrain high-performance SSD output even when NAND is available.

Thermal management is now a physical constraint on effective capacity at the high end. Samsung’s PM1763 uses liquid-cooling optimization and reports more than 1.8 times improved power efficiency versus its predecessor. As bandwidth rises, server designers may need additional cooling capacity, which can alter deployment timing and make storage qualification part of rack-level thermal planning.

External and Internal SSD Market Dynamics: Drivers, Restraints and Opportunities

Growth is being driven by higher data volumes, AI storage workloads, faster host interfaces and larger installed storage requirements. Constraints include NAND price cycles, thermal limits, endurance trade-offs, controller qualification and power efficiency. The strongest opportunities are in enterprise AI storage, very high-capacity drives, premium client systems and differentiated external SSDs for professional workflows.

MARKET DRIVERS

Drivers Impact Analysis*

Driver Directional impact Commercial implication
AI and high-performance computing High More data movement and caching requirements raise demand for high-bandwidth and high-capacity enterprise SSDs.
PCIe Gen5 and Gen6 adoption High New interface generations create upgrade cycles and increase controller, firmware and thermal value.
Higher client capacities Medium 1TB, 2TB and larger configurations increase NAND content and support premium system prices.
Portable high-speed workflows Medium Creators, gamers and mobile professionals value faster transfer and compact high-capacity external products.

AI workloads increase storage bandwidth requirements

AI systems move large datasets between processors, accelerators and storage, making storage latency and throughput part of application performance. Samsung’s PM1763 reaches 28,400 MB/s read and 21,900 MB/s write at 16 TB, while Micron has introduced PCIe Gen6 enterprise products. The commercial implication is greater value per enterprise drive when storage reduces bottlenecks between compute and data.

Interface transitions generate replacement cycles

PCIe 5.0 and PCIe 6.0 expand the performance envelope of SSDs and create a product-upgrade pathway even when users have not exhausted existing capacity. Samsung’s PM1743 delivered up to 13,000 MB/s read on PCIe 5.0, while PM1763 advances to PCIe 6.0. Suppliers can therefore build portfolio ladders around host-platform adoption rather than waiting for pure capacity replacement.

High capacities increase value per physical drive

Micron has described 122 TB enterprise SSDs and a 245 TB roadmap, while SK hynix is advancing higher-density QLC NAND. Higher capacity lets customers reduce drive count, cabling, rack footprint and management overhead. This changes the purchasing equation from simple cost per gigabyte toward cost per usable rack capacity and the operational savings from fewer physical devices.

External SSD workflows support premium differentiation

External products serve creators, gamers and professionals who need portability and rapid movement of large files. A premium drive can differentiate through sustained throughput, enclosure thermals, durability, software and interface support. This allows suppliers to defend higher ASPs even when NAND becomes increasingly standardized across the storage industry. For suppliers, the commercial implication is to align product positioning with measurable workload performance, system qualification, thermal behavior and lifecycle support rather than treating every SSD category as a uniform storage commodity.

MARKET RESTRAINTS

Restraints Impact Analysis*

Restraint Directional impact Commercial implication
NAND price and supply cycles Medium Flash cost changes can quickly alter SSD margins and channel pricing.
Thermal limits at high interface speeds Medium Higher throughput can require stronger cooling and reduce the practical value of headline bandwidth.
Enterprise qualification and firmware risk Medium Long validation cycles slow adoption of new controllers and NAND generations.
Endurance and retention trade-offs in high-density NAND Medium Workload-aware firmware and overprovisioning are required to meet demanding enterprise reliability targets.

NAND cycles compress margins

SSD manufacturers face direct exposure to flash cost cycles as NAND represents the largest cost component in many drives. Falling prices can trigger retail competition and inventory losses, while sudden demand increases can create shortages. Suppliers therefore rely on inventory discipline, flexible procurement and product designs that can accept multiple NAND generations where practical.

Higher performance raises thermal complexity

PCIe 5.0 and 6.0 controllers can consume more power under sustained workloads, making heat removal a system design issue. Samsung’s liquid-cooling optimization for PM1763 illustrates the change. The restraint is architectural: customers cannot fully monetize a faster SSD if enclosure, airflow or rack cooling cannot support the required sustained performance.

Qualification delays controller and firmware transitions

Enterprise SSDs operate inside validated server, virtualization and storage stacks. A controller or firmware change can therefore require extended testing even when the external interface remains identical. This protects incumbents and slows new entrants, but it also increases the value of vendors that have mature validation resources, telemetry and long-term field-support capabilities.

High-density NAND requires workload-aware endurance

QLC and other dense NAND architectures reduce cost per stored terabyte but can impose more demanding endurance management under write-heavy enterprise workloads. Controllers use error correction, overprovisioning and firmware strategies to manage those conditions. The commercial implication is that NAND density alone cannot define the product; endurance, workload behavior and lifecycle support remain decisive.

MARKET OPPORTUNITIES

AI data-center storage

Where: AI servers, hyperscale platforms and high-throughput storage tiers. Who benefits: enterprise SSD vendors with PCIe 5.0 and 6.0 roadmaps. What changes: storage must deliver bandwidth, capacity and power efficiency close to accelerators. Commercial implication: high-performance drives can command premium value when they are validated against rack-level thermal, security and workload requirements.

Very high-capacity enterprise SSDs

Where: AI datasets, databases, analytics and object storage. Who benefits: vendors with dense NAND and reliable high-capacity controller architectures. What changes: 122 TB-class and larger drives reduce the number of physical storage devices required. Commercial implication: suppliers can sell system-level savings in rack footprint, cabling, power distribution and maintenance rather than competing only on unit price.

Premium client and workstation SSDs

Where: creator PCs, gaming systems and professional notebooks. Who benefits: vendors that can pair PCIe 5.0 performance with high capacities and controlled thermals. What changes: local media files and professional datasets continue to grow. Commercial implication: high-performance SSDs can retain premium pricing when throughput and capacity translate directly into shorter load and transfer times.

External SSD differentiation

Where: backup, gaming, photography, video production and field work. Who benefits: vendors with strong controllers, enclosures, software and distribution. What changes: customers increasingly treat portable storage as a performance accessory rather than a passive capacity device. Commercial implication: durable industrial design, sustained performance and software support can defend margins even as flash components become more standardized.

External and Internal SSD Supply Chain Analysis

1. NAND fabrication
Wafer processing and multi-level cell architecture determine flash density, yield, cost and supply availability.
2. Controller and firmware
Controllers, error correction, security, power management and host interfaces convert NAND into a storage platform.
3. Drive assembly and qualification
Packaging, thermal design, protection and system validation determine saleable performance and reliability.
4. OEM, channel and deployment
PC OEMs, server makers, distributors and data centers turn qualified drives into recurring shipments and deployed capacity.

NAND fabrication captures the greatest upstream economic value as flash cost and density define a large share of drive economics. New layer counts require process equipment, capital investment and yield learning, so supply can remain constrained even when final SSD assembly has excess capacity. Suppliers with direct NAND access can coordinate capacity allocation and product roadmaps more effectively than buyers in the spot market.

Controller and firmware design captures technical value by managing error correction, wear leveling, garbage collection, security and host-interface behavior. Enterprise products add predictable latency, endurance and telemetry. This makes firmware qualification a material bottleneck and gives integrated suppliers an strength when they can coordinate NAND characteristics and controller algorithms in one product roadmap.

Drive assembly and qualification add value through thermal management, power-loss protection, end-to-end data protection and workload testing. Client products can use standardized qualification, while enterprise drives require server-platform validation and long-duration stress testing. High-capacity products can also require different cooling and endurance profiles, increasing engineering work as SSD bandwidth and density rise.

OEMs, channels and data centers complete the commercial chain. OEMs determine approved drive configurations and volume, distributors provide replacement and retail access, and data-center operators impose workload and system requirements. A supplier can therefore have different inventory and margin models across client, external and enterprise markets, even when the underlying NAND technology is similar.

Recent Developments in the External and Internal SSD Market

July 8, 2026 – Samsung PM1763 mass production. Samsung began mass production of its PCIe 6.0 enterprise SSD optimized for AI and HPC. The 16 TB configuration reaches up to 28,400 MB/s read and 21,900 MB/s write and uses liquid-cooling optimization, linking storage roadmap progress to rack-level power and thermal architecture. Source
2025–2026 – SK hynix 321-layer QLC NAND. SK hynix announced mass production of 321-layer 2 Tb QLC NAND aimed at enterprise SSDs and AI data centers, with customer validation planned for the first half of 2026. The development supports larger-capacity drive roadmaps and lower cost per stored terabyte. Source
2025 – Micron PCIe Gen6 and high-capacity enterprise SSDs. Micron introduced a PCIe Gen6 9650 enterprise SSD with up to 28 GB/s read and 14 GB/s write and described 122 TB enterprise capacity with a path toward 245 TB. The combination shows storage competition moving simultaneously toward throughput and density. Source
2025 – Samsung PCIe 5.0 product scaling. Samsung’s PM9E1 PC SSD supports up to 14.5 GB/s sequential read and 13 GB/s write, while the PM1743 enterprise drive supports up to 13,000 MB/s read. The launches demonstrate the broad movement of high-speed PCIe storage across both client and server product families. Source

REPORT SCOPE & SEGMENTATION

Attribute Details
Study Period 2020–2034
Base Year 2025
Estimated Year 2026
Forecast Period 2026–2034
Historical Period 2020–2024
Market Size 2025 USD 29.4 Billion
Market Size 2034 USD 56.1 Billion
Growth Rate CAGR of 7.4% from 2026–2034
Unit Market value in USD
Type Segmentation Internal SSD: SATA; PCIe; NVMe; Others. External SSD: Portable SSD; Desktop SSD; Others.
Application Segmentation Enterprise; Client
Storage Capacity Segmentation Below 500GB; 500GB–1TB; 1TB–2TB; Above 2TB
Interface Segmentation SATA; SAS; PCIe; NVMe; Others
Regions North America; Europe; Asia-Pacific; South America; Middle East & Africa
Key Companies Samsung; Western Digital (SanDisk); Kioxia; SK hynix; Kingston; Micron (Crucial); Intel; ADATA Technology; Kimtigo; Shenzhen Longsys (Lexar); Netac Technology; Transcend; Seagate; GIGABYTE; Lenovo; HP; Yangtze Memory (ZhiTai)

Frequently Asked Questions

What is the current size of the external and internal SSD market?

The market is projected at USD 29.4 billion in 2025 and USD 56.1 billion by 2034 , representing a CAGR of 7.4% during 2026–2034. The scope covers internal and external SSDs, enterprise and client applications, capacity bands and interfaces. The growth outlook is tied to continued adoption of solid-state storage across client systems and to the rising storage intensity of data-center workloads. Higher interface speeds and larger capacities are also creating replacement and upgrade opportunities within established device platforms.

Which companies are profiled?

The profiled list includes Samsung, Western Digital (SanDisk), Kioxia, SK hynix, Kingston, Micron (Crucial), Intel, ADATA Technology, Kimtigo, Shenzhen Longsys (Lexar), Netac Technology, Transcend, Seagate, GIGABYTE, Lenovo, HP and Yangtze Memory (ZhiTai). The group spans integrated memory suppliers, independent SSD brands and OEM-linked storage businesses, giving the market multiple competitive models. Companies can differentiate through NAND access, controller selection, firmware, capacity, interface performance, distribution and enterprise qualification.

What is an internal SSD?

An internal SSD is a solid-state storage device integrated into a notebook, desktop, workstation, server or other host system. The defined scope includes SATA, PCIe, NVMe and Other interfaces. Internal SSDs remain the largest type due to their broad integration across client and enterprise computing platforms. For suppliers, the commercial implication is to align product positioning with measurable workload performance, system qualification, thermal behavior and lifecycle support rather than treating every SSD category as a uniform storage commodity.

What is an external SSD?

An external SSD combines NAND flash, a controller and an external interface in a portable or desktop enclosure. The scope includes Portable SSD, Desktop SSD and Others. Demand is supported by backup, gaming, creator workflows, field work and rapid transfer of large files. For suppliers, the commercial implication is to align product positioning with measurable workload performance, system qualification, thermal behavior and lifecycle support rather than treating every SSD category as a uniform storage commodity.

Which application leads SSD demand?

The market is divided into Enterprise and Client applications, with Enterprise representing the higher-value category. Enterprise systems purchase against bandwidth, IOPS, latency, endurance, security and capacity requirements, while client systems emphasize responsiveness, power, compatibility, capacity and cost. That split means the same storage technology is evaluated differently across customer groups. Enterprise buyers quantify workload behavior and lifecycle economics, while client buyers emphasize responsiveness, capacity and price. Product roadmaps and sales channels must therefore reflect these distinct purchasing mechanisms.

Which region leads the SSD market?

Asia Pacific is the leading regional market and the defined report scope indicates more than 45% share in 2024. The region benefits from NAND production, SSD manufacturing, electronics assembly and substantial local device demand, creating an integrated supply and consumption ecosystem. Its strength comes from concentrated display fabrication, panel assembly and downstream electronics production, which shortens the path from process development to commercial deployment. The region consequently combines supply-side depth with substantial end-market demand.

Why are PCIe 5.0 and PCIe 6.0 important?

PCIe 5.0 and 6.0 increase host-side bandwidth, allowing SSDs to deliver much higher throughput to servers and high-performance PCs. Samsung’s PM1763 demonstrates the PCIe 6.0 step with up to 28,400 MB/s sequential read at 16 TB, making storage bandwidth a more important part of AI system architecture. For suppliers, the commercial implication is to align product positioning with measurable workload performance, system qualification, thermal behavior and lifecycle support rather than treating every SSD category as a uniform storage commodity.

What is driving enterprise SSD growth?

AI, cloud computing, analytics and high-performance workloads increase the amount of data that must be stored and moved quickly. High-capacity drives also reduce the number of physical devices needed for a given data footprint. These factors increase the value of throughput, capacity, endurance and power efficiency in enterprise storage. For suppliers, the commercial implication is to align product positioning with measurable workload performance, system qualification, thermal behavior and lifecycle support rather than treating every SSD category as a uniform storage commodity.

What are the main restraints?

The market is constrained by NAND price cycles, thermal limits at high interface speeds, enterprise controller and firmware qualification, and endurance requirements for high-density flash. These factors can affect margins, slow product introductions and limit how quickly customers can exploit theoretical interface performance. The constraints affect suppliers at different points in the cycle: flash prices affect near-term margins, thermal limits constrain sustained throughput, and enterprise qualification can postpone adoption of new controllers or NAND. Effective competition therefore requires both component access and system-validation capability.

What is the outlook for high-capacity enterprise SSDs?

The direction is toward substantially higher capacity per physical drive, with Micron describing 122 TB enterprise SSDs and a path toward 245 TB while SK hynix advances high-density QLC NAND. Larger drives can reduce drive count, cabling, rack footprint and management overhead, creating system-level value beyond price per gigabyte. The commercial case is strongest where a larger drive can replace several smaller devices or reduce the storage hardware footprint of a deployment. Higher capacity therefore creates value through simplification as well as through the amount of data stored.

External and Internal SSD Market, Trends, Business Strategies 2026-2034

Get Sample Report PDF for Exclusive Insights

Report Sample Includes

  • Table of Contents
  • List of Tables & Figures
  • Charts, Research Methodology, and more...

PDF Icon Download Sample Report PDF

Download Sample Report

Table of Content

1 Introduction to Research & Analysis Reports
1.1 External and Internal SSD Market Definition
1.2 Market Segments
1.2.1 Segment by Type
1.2.2 Segment by Application
1.3 Global External and Internal SSD Market Overview
1.4 Features & Benefits of This Report
1.5 Methodology & Sources of Information
1.5.1 Research Methodology
1.5.2 Research Process
1.5.3 Base Year
1.5.4 Report Assumptions & Caveats
2 Global External and Internal SSD Overall Market Size
2.1 Global External and Internal SSD Market Size: 2024 VS 2032
2.2 Global External and Internal SSD Market Size, Prospects & Forecasts: 2020-2032
2.3 Global External and Internal SSD Sales: 2020-2032
3 Company Landscape
3.1 Top External and Internal SSD Players in Global Market
3.2 Top Global External and Internal SSD Companies Ranked by Revenue
3.3 Global External and Internal SSD Revenue by Companies
3.4 Global External and Internal SSD Sales by Companies
3.5 Global External and Internal SSD Price by Manufacturer (2020-2025)
3.6 Top 3 and Top 5 External and Internal SSD Companies in Global Market, by Revenue in 2024
3.7 Global Manufacturers External and Internal SSD Product Type
3.8 Tier 1, Tier 2, and Tier 3 External and Internal SSD Players in Global Market
3.8.1 List of Global Tier 1 External and Internal SSD Companies
3.8.2 List of Global Tier 2 and Tier 3 External and Internal SSD Companies
4 Sights by Product
4.1 Overview
4.1.1 Segment by Type – Global External and Internal SSD Market Size Markets, 2024 & 2032
4.1.2 External SSD
4.1.3 Internal SSD
4.2 Segment by Type – Global External and Internal SSD Revenue & Forecasts
4.2.1 Segment by Type – Global External and Internal SSD Revenue, 2020-2025
4.2.2 Segment by Type – Global External and Internal SSD Revenue, 2026-2032
4.2.3 Segment by Type – Global External and Internal SSD Revenue Market Share, 2020-2032
4.3 Segment by Type – Global External and Internal SSD Sales & Forecasts
4.3.1 Segment by Type – Global External and Internal SSD Sales, 2020-2025
4.3.2 Segment by Type – Global External and Internal SSD Sales, 2026-2032
4.3.3 Segment by Type – Global External and Internal SSD Sales Market Share, 2020-2032
4.4 Segment by Type – Global External and Internal SSD Price (Manufacturers Selling Prices), 2020-2032
5 Sights by Application
5.1 Overview
5.1.1 Segment by Application – Global External and Internal SSD Market Size, 2024 & 2032
5.1.2 Enterprise
5.1.3 Client
5.2 Segment by Application – Global External and Internal SSD Revenue & Forecasts
5.2.1 Segment by Application – Global External and Internal SSD Revenue, 2020-2025
5.2.2 Segment by Application – Global External and Internal SSD Revenue, 2026-2032
5.2.3 Segment by Application – Global External and Internal SSD Revenue Market Share, 2020-2032
5.3 Segment by Application – Global External and Internal SSD Sales & Forecasts
5.3.1 Segment by Application – Global External and Internal SSD Sales, 2020-2025
5.3.2 Segment by Application – Global External and Internal SSD Sales, 2026-2032
5.3.3 Segment by Application – Global External and Internal SSD Sales Market Share, 2020-2032
5.4 Segment by Application – Global External and Internal SSD Price (Manufacturers Selling Prices), 2020-2032
6 Sights by Region
6.1 By Region – Global External and Internal SSD Market Size, 2024 & 2032
6.2 By Region – Global External and Internal SSD Revenue & Forecasts
6.2.1 By Region – Global External and Internal SSD Revenue, 2020-2025
6.2.2 By Region – Global External and Internal SSD Revenue, 2026-2032
6.2.3 By Region – Global External and Internal SSD Revenue Market Share, 2020-2032
6.3 By Region – Global External and Internal SSD Sales & Forecasts
6.3.1 By Region – Global External and Internal SSD Sales, 2020-2025
6.3.2 By Region – Global External and Internal SSD Sales, 2026-2032
6.3.3 By Region – Global External and Internal SSD Sales Market Share, 2020-2032
6.4 North America
6.4.1 By Country – North America External and Internal SSD Revenue, 2020-2032
6.4.2 By Country – North America External and Internal SSD Sales, 2020-2032
6.4.3 United States External and Internal SSD Market Size, 2020-2032
6.4.4 Canada External and Internal SSD Market Size, 2020-2032
6.4.5 Mexico External and Internal SSD Market Size, 2020-2032
6.5 Europe
6.5.1 By Country – Europe External and Internal SSD Revenue, 2020-2032
6.5.2 By Country – Europe External and Internal SSD Sales, 2020-2032
6.5.3 Germany External and Internal SSD Market Size, 2020-2032
6.5.4 France External and Internal SSD Market Size, 2020-2032
6.5.5 U.K. External and Internal SSD Market Size, 2020-2032
6.5.6 Italy External and Internal SSD Market Size, 2020-2032
6.5.7 Russia External and Internal SSD Market Size, 2020-2032
6.5.8 Nordic Countries External and Internal SSD Market Size, 2020-2032
6.5.9 Benelux External and Internal SSD Market Size, 2020-2032
6.6 Asia
6.6.1 By Region – Asia External and Internal SSD Revenue, 2020-2032
6.6.2 By Region – Asia External and Internal SSD Sales, 2020-2032
6.6.3 China External and Internal SSD Market Size, 2020-2032
6.6.4 Japan External and Internal SSD Market Size, 2020-2032
6.6.5 South Korea External and Internal SSD Market Size, 2020-2032
6.6.6 Southeast Asia External and Internal SSD Market Size, 2020-2032
6.6.7 India External and Internal SSD Market Size, 2020-2032
6.7 South America
6.7.1 By Country – South America External and Internal SSD Revenue, 2020-2032
6.7.2 By Country – South America External and Internal SSD Sales, 2020-2032
6.7.3 Brazil External and Internal SSD Market Size, 2020-2032
6.7.4 Argentina External and Internal SSD Market Size, 2020-2032
6.8 Middle East & Africa
6.8.1 By Country – Middle East & Africa External and Internal SSD Revenue, 2020-2032
6.8.2 By Country – Middle East & Africa External and Internal SSD Sales, 2020-2032
6.8.3 Turkey External and Internal SSD Market Size, 2020-2032
6.8.4 Israel External and Internal SSD Market Size, 2020-2032
6.8.5 Saudi Arabia External and Internal SSD Market Size, 2020-2032
6.8.6 UAE External and Internal SSD Market Size, 2020-2032
7 Manufacturers & Brands Profiles
7.1 Samsung
7.1.1 Samsung Company Summary
7.1.2 Samsung Business Overview
7.1.3 Samsung External and Internal SSD Major Product Offerings
7.1.4 Samsung External and Internal SSD Sales and Revenue in Global (2020-2025)
7.1.5 Samsung Key News & Latest Developments
7.2 Western Digital (SanDisk)
7.2.1 Western Digital (SanDisk) Company Summary
7.2.2 Western Digital (SanDisk) Business Overview
7.2.3 Western Digital (SanDisk) External and Internal SSD Major Product Offerings
7.2.4 Western Digital (SanDisk) External and Internal SSD Sales and Revenue in Global (2020-2025)
7.2.5 Western Digital (SanDisk) Key News & Latest Developments
7.3 Kioxia (Lite-On)
7.3.1 Kioxia (Lite-On) Company Summary
7.3.2 Kioxia (Lite-On) Business Overview
7.3.3 Kioxia (Lite-On) External and Internal SSD Major Product Offerings
7.3.4 Kioxia (Lite-On) External and Internal SSD Sales and Revenue in Global (2020-2025)
7.3.5 Kioxia (Lite-On) Key News & Latest Developments
7.4 SK Hynix
7.4.1 SK Hynix Company Summary
7.4.2 SK Hynix Business Overview
7.4.3 SK Hynix External and Internal SSD Major Product Offerings
7.4.4 SK Hynix External and Internal SSD Sales and Revenue in Global (2020-2025)
7.4.5 SK Hynix Key News & Latest Developments
7.5 Kingston
7.5.1 Kingston Company Summary
7.5.2 Kingston Business Overview
7.5.3 Kingston External and Internal SSD Major Product Offerings
7.5.4 Kingston External and Internal SSD Sales and Revenue in Global (2020-2025)
7.5.5 Kingston Key News & Latest Developments
7.6 Micron (Crucial)
7.6.1 Micron (Crucial) Company Summary
7.6.2 Micron (Crucial) Business Overview
7.6.3 Micron (Crucial) External and Internal SSD Major Product Offerings
7.6.4 Micron (Crucial) External and Internal SSD Sales and Revenue in Global (2020-2025)
7.6.5 Micron (Crucial) Key News & Latest Developments
7.7 Intel
7.7.1 Intel Company Summary
7.7.2 Intel Business Overview
7.7.3 Intel External and Internal SSD Major Product Offerings
7.7.4 Intel External and Internal SSD Sales and Revenue in Global (2020-2025)
7.7.5 Intel Key News & Latest Developments
7.8 ADATA Technology
7.8.1 ADATA Technology Company Summary
7.8.2 ADATA Technology Business Overview
7.8.3 ADATA Technology External and Internal SSD Major Product Offerings
7.8.4 ADATA Technology External and Internal SSD Sales and Revenue in Global (2020-2025)
7.8.5 ADATA Technology Key News & Latest Developments
7.9 Kimtigo
7.9.1 Kimtigo Company Summary
7.9.2 Kimtigo Business Overview
7.9.3 Kimtigo External and Internal SSD Major Product Offerings
7.9.4 Kimtigo External and Internal SSD Sales and Revenue in Global (2020-2025)
7.9.5 Kimtigo Key News & Latest Developments
7.10 Shenzhen Longsys (Lexar)
7.10.1 Shenzhen Longsys (Lexar) Company Summary
7.10.2 Shenzhen Longsys (Lexar) Business Overview
7.10.3 Shenzhen Longsys (Lexar) External and Internal SSD Major Product Offerings
7.10.4 Shenzhen Longsys (Lexar) External and Internal SSD Sales and Revenue in Global (2020-2025)
7.10.5 Shenzhen Longsys (Lexar) Key News & Latest Developments
7.11 Netac Technology
7.11.1 Netac Technology Company Summary
7.11.2 Netac Technology Business Overview
7.11.3 Netac Technology External and Internal SSD Major Product Offerings
7.11.4 Netac Technology External and Internal SSD Sales and Revenue in Global (2020-2025)
7.11.5 Netac Technology Key News & Latest Developments
7.12 Transcend
7.12.1 Transcend Company Summary
7.12.2 Transcend Business Overview
7.12.3 Transcend External and Internal SSD Major Product Offerings
7.12.4 Transcend External and Internal SSD Sales and Revenue in Global (2020-2025)
7.12.5 Transcend Key News & Latest Developments
7.13 Seagate
7.13.1 Seagate Company Summary
7.13.2 Seagate Business Overview
7.13.3 Seagate External and Internal SSD Major Product Offerings
7.13.4 Seagate External and Internal SSD Sales and Revenue in Global (2020-2025)
7.13.5 Seagate Key News & Latest Developments
7.14 GIGABYTE
7.14.1 GIGABYTE Company Summary
7.14.2 GIGABYTE Business Overview
7.14.3 GIGABYTE External and Internal SSD Major Product Offerings
7.14.4 GIGABYTE External and Internal SSD Sales and Revenue in Global (2020-2025)
7.14.5 GIGABYTE Key News & Latest Developments
7.15 Powev
7.15.1 Powev Company Summary
7.15.2 Powev Business Overview
7.15.3 Powev External and Internal SSD Major Product Offerings
7.15.4 Powev External and Internal SSD Sales and Revenue in Global (2020-2025)
7.15.5 Powev Key News & Latest Developments
7.16 Clolorful
7.16.1 Clolorful Company Summary
7.16.2 Clolorful Business Overview
7.16.3 Clolorful External and Internal SSD Major Product Offerings
7.16.4 Clolorful External and Internal SSD Sales and Revenue in Global (2020-2025)
7.16.5 Clolorful Key News & Latest Developments
7.17 Teclast
7.17.1 Teclast Company Summary
7.17.2 Teclast Business Overview
7.17.3 Teclast External and Internal SSD Major Product Offerings
7.17.4 Teclast External and Internal SSD Sales and Revenue in Global (2020-2025)
7.17.5 Teclast Key News & Latest Developments
7.18 Lenovo
7.18.1 Lenovo Company Summary
7.18.2 Lenovo Business Overview
7.18.3 Lenovo External and Internal SSD Major Product Offerings
7.18.4 Lenovo External and Internal SSD Sales and Revenue in Global (2020-2025)
7.18.5 Lenovo Key News & Latest Developments
7.19 HP
7.19.1 HP Company Summary
7.19.2 HP Business Overview
7.19.3 HP External and Internal SSD Major Product Offerings
7.19.4 HP External and Internal SSD Sales and Revenue in Global (2020-2025)
7.19.5 HP Key News & Latest Developments
7.20 Fanxiang
7.20.1 Fanxiang Company Summary
7.20.2 Fanxiang Business Overview
7.20.3 Fanxiang External and Internal SSD Major Product Offerings
7.20.4 Fanxiang External and Internal SSD Sales and Revenue in Global (2020-2025)
7.20.5 Fanxiang Key News & Latest Developments
7.21 Yangtze Memory (ZhiTai)
7.21.1 Yangtze Memory (ZhiTai) Company Summary
7.21.2 Yangtze Memory (ZhiTai) Business Overview
7.21.3 Yangtze Memory (ZhiTai) External and Internal SSD Major Product Offerings
7.21.4 Yangtze Memory (ZhiTai) External and Internal SSD Sales and Revenue in Global (2020-2025)
7.21.5 Yangtze Memory (ZhiTai) Key News & Latest Developments
7.22 Kingbank
7.22.1 Kingbank Company Summary
7.22.2 Kingbank Business Overview
7.22.3 Kingbank External and Internal SSD Major Product Offerings
7.22.4 Kingbank External and Internal SSD Sales and Revenue in Global (2020-2025)
7.22.5 Kingbank Key News & Latest Developments
7.23 BIWIN Storage
7.23.1 BIWIN Storage Company Summary
7.23.2 BIWIN Storage Business Overview
7.23.3 BIWIN Storage External and Internal SSD Major Product Offerings
7.23.4 BIWIN Storage External and Internal SSD Sales and Revenue in Global (2020-2025)
7.23.5 BIWIN Storage Key News & Latest Developments
8 Global External and Internal SSD Production Capacity, Analysis
8.1 Global External and Internal SSD Production Capacity, 2020-2032
8.2 External and Internal SSD Production Capacity of Key Manufacturers in Global Market
8.3 Global External and Internal SSD Production by Region
9 Key Market Trends, Opportunity, Drivers and Restraints
9.1 Market Opportunities & Trends
9.2 Market Drivers
9.3 Market Restraints
10 External and Internal SSD Supply Chain Analysis
10.1 External and Internal SSD Industry Value Chain
10.2 External and Internal SSD Upstream Market
10.3 External and Internal SSD Downstream and Clients
10.4 Marketing Channels Analysis
10.4.1 Marketing Channels
10.4.2 External and Internal SSD Distributors and Sales Agents in Global
11 Conclusion
12 Appendix
12.1 Note
12.2 Examples of Clients
12.3 DisclaimerList of Tables
Table 1. Key Players of External and Internal SSD in Global Market
Table 2. Top External and Internal SSD Players in Global Market, Ranking by Revenue (2024)
Table 3. Global External and Internal SSD Revenue by Companies, (US$, Mn), 2020-2025
Table 4. Global External and Internal SSD Revenue Share by Companies, 2020-2025
Table 5. Global External and Internal SSD Sales by Companies, (K Units), 2020-2025
Table 6. Global External and Internal SSD Sales Share by Companies, 2020-2025
Table 7. Key Manufacturers External and Internal SSD Price (2020-2025) & (US$/Unit)
Table 8. Global Manufacturers External and Internal SSD Product Type
Table 9. List of Global Tier 1 External and Internal SSD Companies, Revenue (US$, Mn) in 2024 and Market Share
Table 10. List of Global Tier 2 and Tier 3 External and Internal SSD Companies, Revenue (US$, Mn) in 2024 and Market Share
Table 11. Segment by Type – Global External and Internal SSD Revenue, (US$, Mn), 2024 & 2032
Table 12. Segment by Type – Global External and Internal SSD Revenue (US$, Mn), 2020-2025
Table 13. Segment by Type – Global External and Internal SSD Revenue (US$, Mn), 2026-2032
Table 14. Segment by Type – Global External and Internal SSD Sales (K Units), 2020-2025
Table 15. Segment by Type – Global External and Internal SSD Sales (K Units), 2026-2032
Table 16. Segment by Application – Global External and Internal SSD Revenue, (US$, Mn), 2024 & 2032
Table 17. Segment by Application – Global External and Internal SSD Revenue, (US$, Mn), 2020-2025
Table 18. Segment by Application – Global External and Internal SSD Revenue, (US$, Mn), 2026-2032
Table 19. Segment by Application – Global External and Internal SSD Sales, (K Units), 2020-2025
Table 20. Segment by Application – Global External and Internal SSD Sales, (K Units), 2026-2032
Table 21. By Region – Global External and Internal SSD Revenue, (US$, Mn), 2025-2032
Table 22. By Region – Global External and Internal SSD Revenue, (US$, Mn), 2020-2025
Table 23. By Region – Global External and Internal SSD Revenue, (US$, Mn), 2026-2032
Table 24. By Region – Global External and Internal SSD Sales, (K Units), 2020-2025
Table 25. By Region – Global External and Internal SSD Sales, (K Units), 2026-2032
Table 26. By Country – North America External and Internal SSD Revenue, (US$, Mn), 2020-2025
Table 27. By Country – North America External and Internal SSD Revenue, (US$, Mn), 2026-2032
Table 28. By Country – North America External and Internal SSD Sales, (K Units), 2020-2025
Table 29. By Country – North America External and Internal SSD Sales, (K Units), 2026-2032
Table 30. By Country – Europe External and Internal SSD Revenue, (US$, Mn), 2020-2025
Table 31. By Country – Europe External and Internal SSD Revenue, (US$, Mn), 2026-2032
Table 32. By Country – Europe External and Internal SSD Sales, (K Units), 2020-2025
Table 33. By Country – Europe External and Internal SSD Sales, (K Units), 2026-2032
Table 34. By Region – Asia External and Internal SSD Revenue, (US$, Mn), 2020-2025
Table 35. By Region – Asia External and Internal SSD Revenue, (US$, Mn), 2026-2032
Table 36. By Region – Asia External and Internal SSD Sales, (K Units), 2020-2025
Table 37. By Region – Asia External and Internal SSD Sales, (K Units), 2026-2032
Table 38. By Country – South America External and Internal SSD Revenue, (US$, Mn), 2020-2025
Table 39. By Country – South America External and Internal SSD Revenue, (US$, Mn), 2026-2032
Table 40. By Country – South America External and Internal SSD Sales, (K Units), 2020-2025
Table 41. By Country – South America External and Internal SSD Sales, (K Units), 2026-2032
Table 42. By Country – Middle East & Africa External and Internal SSD Revenue, (US$, Mn), 2020-2025
Table 43. By Country – Middle East & Africa External and Internal SSD Revenue, (US$, Mn), 2026-2032
Table 44. By Country – Middle East & Africa External and Internal SSD Sales, (K Units), 2020-2025
Table 45. By Country – Middle East & Africa External and Internal SSD Sales, (K Units), 2026-2032
Table 46. Samsung Company Summary
Table 47. Samsung External and Internal SSD Product Offerings
Table 48. Samsung External and Internal SSD Sales (K Units), Revenue (US$, Mn) and Average Price (US$/Unit) & (2020-2025)
Table 49. Samsung Key News & Latest Developments
Table 50. Western Digital (SanDisk) Company Summary
Table 51. Western Digital (SanDisk) External and Internal SSD Product Offerings
Table 52. Western Digital (SanDisk) External and Internal SSD Sales (K Units), Revenue (US$, Mn) and Average Price (US$/Unit) & (2020-2025)
Table 53. Western Digital (SanDisk) Key News & Latest Developments
Table 54. Kioxia (Lite-On) Company Summary
Table 55. Kioxia (Lite-On) External and Internal SSD Product Offerings
Table 56. Kioxia (Lite-On) External and Internal SSD Sales (K Units), Revenue (US$, Mn) and Average Price (US$/Unit) & (2020-2025)
Table 57. Kioxia (Lite-On) Key News & Latest Developments
Table 58. SK Hynix Company Summary
Table 59. SK Hynix External and Internal SSD Product Offerings
Table 60. SK Hynix External and Internal SSD Sales (K Units), Revenue (US$, Mn) and Average Price (US$/Unit) & (2020-2025)
Table 61. SK Hynix Key News & Latest Developments
Table 62. Kingston Company Summary
Table 63. Kingston External and Internal SSD Product Offerings
Table 64. Kingston External and Internal SSD Sales (K Units), Revenue (US$, Mn) and Average Price (US$/Unit) & (2020-2025)
Table 65. Kingston Key News & Latest Developments
Table 66. Micron (Crucial) Company Summary
Table 67. Micron (Crucial) External and Internal SSD Product Offerings
Table 68. Micron (Crucial) External and Internal SSD Sales (K Units), Revenue (US$, Mn) and Average Price (US$/Unit) & (2020-2025)
Table 69. Micron (Crucial) Key News & Latest Developments
Table 70. Intel Company Summary
Table 71. Intel External and Internal SSD Product Offerings
Table 72. Intel External and Internal SSD Sales (K Units), Revenue (US$, Mn) and Average Price (US$/Unit) & (2020-2025)
Table 73. Intel Key News & Latest Developments
Table 74. ADATA Technology Company Summary
Table 75. ADATA Technology External and Internal SSD Product Offerings
Table 76. ADATA Technology External and Internal SSD Sales (K Units), Revenue (US$, Mn) and Average Price (US$/Unit) & (2020-2025)
Table 77. ADATA Technology Key News & Latest Developments
Table 78. Kimtigo Company Summary
Table 79. Kimtigo External and Internal SSD Product Offerings
Table 80. Kimtigo External and Internal SSD Sales (K Units), Revenue (US$, Mn) and Average Price (US$/Unit) & (2020-2025)
Table 81. Kimtigo Key News & Latest Developments
Table 82. Shenzhen Longsys (Lexar) Company Summary
Table 83. Shenzhen Longsys (Lexar) External and Internal SSD Product Offerings
Table 84. Shenzhen Longsys (Lexar) External and Internal SSD Sales (K Units), Revenue (US$, Mn) and Average Price (US$/Unit) & (2020-2025)
Table 85. Shenzhen Longsys (Lexar) Key News & Latest Developments
Table 86. Netac Technology Company Summary
Table 87. Netac Technology External and Internal SSD Product Offerings
Table 88. Netac Technology External and Internal SSD Sales (K Units), Revenue (US$, Mn) and Average Price (US$/Unit) & (2020-2025)
Table 89. Netac Technology Key News & Latest Developments
Table 90. Transcend Company Summary
Table 91. Transcend External and Internal SSD Product Offerings
Table 92. Transcend External and Internal SSD Sales (K Units), Revenue (US$, Mn) and Average Price (US$/Unit) & (2020-2025)
Table 93. Transcend Key News & Latest Developments
Table 94. Seagate Company Summary
Table 95. Seagate External and Internal SSD Product Offerings
Table 96. Seagate External and Internal SSD Sales (K Units), Revenue (US$, Mn) and Average Price (US$/Unit) & (2020-2025)
Table 97. Seagate Key News & Latest Developments
Table 98. GIGABYTE Company Summary
Table 99. GIGABYTE External and Internal SSD Product Offerings
Table 100. GIGABYTE External and Internal SSD Sales (K Units), Revenue (US$, Mn) and Average Price (US$/Unit) & (2020-2025)
Table 101. GIGABYTE Key News & Latest Developments
Table 102. Powev Company Summary
Table 103. Powev External and Internal SSD Product Offerings
Table 104. Powev External and Internal SSD Sales (K Units), Revenue (US$, Mn) and Average Price (US$/Unit) & (2020-2025)
Table 105. Powev Key News & Latest Developments
Table 106. Clolorful Company Summary
Table 107. Clolorful External and Internal SSD Product Offerings
Table 108. Clolorful External and Internal SSD Sales (K Units), Revenue (US$, Mn) and Average Price (US$/Unit) & (2020-2025)
Table 109. Clolorful Key News & Latest Developments
Table 110. Teclast Company Summary
Table 111. Teclast External and Internal SSD Product Offerings
Table 112. Teclast External and Internal SSD Sales (K Units), Revenue (US$, Mn) and Average Price (US$/Unit) & (2020-2025)
Table 113. Teclast Key News & Latest Developments
Table 114. Lenovo Company Summary
Table 115. Lenovo External and Internal SSD Product Offerings
Table 116. Lenovo External and Internal SSD Sales (K Units), Revenue (US$, Mn) and Average Price (US$/Unit) & (2020-2025)
Table 117. Lenovo Key News & Latest Developments
Table 118. HP Company Summary
Table 119. HP External and Internal SSD Product Offerings
Table 120. HP External and Internal SSD Sales (K Units), Revenue (US$, Mn) and Average Price (US$/Unit) & (2020-2025)
Table 121. HP Key News & Latest Developments
Table 122. Fanxiang Company Summary
Table 123. Fanxiang External and Internal SSD Product Offerings
Table 124. Fanxiang External and Internal SSD Sales (K Units), Revenue (US$, Mn) and Average Price (US$/Unit) & (2020-2025)
Table 125. Fanxiang Key News & Latest Developments
Table 126. Yangtze Memory (ZhiTai) Company Summary
Table 127. Yangtze Memory (ZhiTai) External and Internal SSD Product Offerings
Table 128. Yangtze Memory (ZhiTai) External and Internal SSD Sales (K Units), Revenue (US$, Mn) and Average Price (US$/Unit) & (2020-2025)
Table 129. Yangtze Memory (ZhiTai) Key News & Latest Developments
Table 130. Kingbank Company Summary
Table 131. Kingbank External and Internal SSD Product Offerings
Table 132. Kingbank External and Internal SSD Sales (K Units), Revenue (US$, Mn) and Average Price (US$/Unit) & (2020-2025)
Table 133. Kingbank Key News & Latest Developments
Table 134. BIWIN Storage Company Summary
Table 135. BIWIN Storage External and Internal SSD Product Offerings
Table 136. BIWIN Storage External and Internal SSD Sales (K Units), Revenue (US$, Mn) and Average Price (US$/Unit) & (2020-2025)
Table 137. BIWIN Storage Key News & Latest Developments
Table 138. External and Internal SSD Capacity of Key Manufacturers in Global Market, 2023-2025 (K Units)
Table 139. Global External and Internal SSD Capacity Market Share of Key Manufacturers, 2023-2025
Table 140. Global External and Internal SSD Production by Region, 2020-2025 (K Units)
Table 141. Global External and Internal SSD Production by Region, 2026-2032 (K Units)
Table 142. External and Internal SSD Market Opportunities & Trends in Global Market
Table 143. External and Internal SSD Market Drivers in Global Market
Table 144. External and Internal SSD Market Restraints in Global Market
Table 145. External and Internal SSD Raw Materials
Table 146. External and Internal SSD Raw Materials Suppliers in Global Market
Table 147. Typical External and Internal SSD Downstream
Table 148. External and Internal SSD Downstream Clients in Global Market
Table 149. External and Internal SSD Distributors and Sales Agents in Global Market

List of Figures
Figure 1. External and Internal SSD Product Picture
Figure 2. External and Internal SSD Segment by Type in 2024
Figure 3. External and Internal SSD Segment by Application in 2024
Figure 4. Global External and Internal SSD Market Overview: 2024
Figure 5. Key Caveats
Figure 6. Global External and Internal SSD Market Size: 2024 VS 2032 (US$, Mn)
Figure 7. Global External and Internal SSD Revenue: 2020-2032 (US$, Mn)
Figure 8. External and Internal SSD Sales in Global Market: 2020-2032 (K Units)
Figure 9. The Top 3 and 5 Players Market Share by External and Internal SSD Revenue in 2024
Figure 10. Segment by Type – Global External and Internal SSD Revenue, (US$, Mn), 2024 & 2032
Figure 11. Segment by Type – Global External and Internal SSD Revenue Market Share, 2020-2032
Figure 12. Segment by Type – Global External and Internal SSD Sales Market Share, 2020-2032
Figure 13. Segment by Type – Global External and Internal SSD Price (US$/Unit), 2020-2032
Figure 14. Segment by Application – Global External and Internal SSD Revenue, (US$, Mn), 2024 & 2032
Figure 15. Segment by Application – Global External and Internal SSD Revenue Market Share, 2020-2032
Figure 16. Segment by Application – Global External and Internal SSD Sales Market Share, 2020-2032
Figure 17. Segment by Application -Global External and Internal SSD Price (US$/Unit), 2020-2032
Figure 18. By Region – Global External and Internal SSD Revenue, (US$, Mn), 2025 & 2032
Figure 19. By Region – Global External and Internal SSD Revenue Market Share, 2020 VS 2024 VS 2032
Figure 20. By Region – Global External and Internal SSD Revenue Market Share, 2020-2032
Figure 21. By Region – Global External and Internal SSD Sales Market Share, 2020-2032
Figure 22. By Country – North America External and Internal SSD Revenue Market Share, 2020-2032
Figure 23. By Country – North America External and Internal SSD Sales Market Share, 2020-2032
Figure 24. United States External and Internal SSD Revenue, (US$, Mn), 2020-2032
Figure 25. Canada External and Internal SSD Revenue, (US$, Mn), 2020-2032
Figure 26. Mexico External and Internal SSD Revenue, (US$, Mn), 2020-2032
Figure 27. By Country – Europe External and Internal SSD Revenue Market Share, 2020-2032
Figure 28. By Country – Europe External and Internal SSD Sales Market Share, 2020-2032
Figure 29. Germany External and Internal SSD Revenue, (US$, Mn), 2020-2032
Figure 30. France External and Internal SSD Revenue, (US$, Mn), 2020-2032
Figure 31. U.K. External and Internal SSD Revenue, (US$, Mn), 2020-2032
Figure 32. Italy External and Internal SSD Revenue, (US$, Mn), 2020-2032
Figure 33. Russia External and Internal SSD Revenue, (US$, Mn), 2020-2032
Figure 34. Nordic Countries External and Internal SSD Revenue, (US$, Mn), 2020-2032
Figure 35. Benelux External and Internal SSD Revenue, (US$, Mn), 2020-2032
Figure 36. By Region – Asia External and Internal SSD Revenue Market Share, 2020-2032
Figure 37. By Region – Asia External and Internal SSD Sales Market Share, 2020-2032
Figure 38. China External and Internal SSD Revenue, (US$, Mn), 2020-2032
Figure 39. Japan External and Internal SSD Revenue, (US$, Mn), 2020-2032
Figure 40. South Korea External and Internal SSD Revenue, (US$, Mn), 2020-2032
Figure 41. Southeast Asia External and Internal SSD Revenue, (US$, Mn), 2020-2032
Figure 42. India External and Internal SSD Revenue, (US$, Mn), 2020-2032
Figure 43. By Country – South America External and Internal SSD Revenue Market Share, 2020-2032
Figure 44. By Country – South America External and Internal SSD Sales, Market Share, 2020-2032
Figure 45. Brazil External and Internal SSD Revenue, (US$, Mn), 2020-2032
Figure 46. Argentina External and Internal SSD Revenue, (US$, Mn), 2020-2032
Figure 47. By Country – Middle East & Africa External and Internal SSD Revenue, Market Share, 2020-2032
Figure 48. By Country – Middle East & Africa External and Internal SSD Sales, Market Share, 2020-2032
Figure 49. Turkey External and Internal SSD Revenue, (US$, Mn), 2020-2032
Figure 50. Israel External and Internal SSD Revenue, (US$, Mn), 2020-2032
Figure 51. Saudi Arabia External and Internal SSD Revenue, (US$, Mn), 2020-2032
Figure 52. UAE External and Internal SSD Revenue, (US$, Mn), 2020-2032
Figure 53. Global External and Internal SSD Production Capacity (K Units), 2020-2032
Figure 54. The Percentage of Production External and Internal SSD by Region, 2024 VS 2032
Figure 55. External and Internal SSD Industry Value Chain
Figure 56. Marketing Channels