Photoelectric Sensors Market Overview
This report is an essential reference for who looks for detailed information on Europe Photoelectric Sensors . The report covers data on Europe markets including historical and future trends for supply, market size, prices, trading, competition and value chain as well as Europe major vendors¡¯ information. In addition to the data part, the report also provides overview of Photoelectric Sensors , including classification, application, manufacturing technology, industry chain analysis and latest market dynamics. Finally, a customization report in order to meet user’s requirements is also available.
This report aims to provide a comprehensive presentation of the Europe Photoelectric Sensors , with both quantitative and qualitative analysis, to help readers develop business/growth strategies, assess the market competitive situation, analyze their position in the current marketplace, and make informed business decisions regarding Photoelectric Sensors . This report contains market size and forecasts of Photoelectric Sensors in Europe, including the following market information:
We surveyed the Photoelectric Sensors manufacturers, suppliers, distributors and industry experts on this industry, involving the sales, revenue, demand, price change, product type, recent development and plan, industry trends, drivers, challenges, obstacles, and potential risks.
Photoelectric Sensors Market Analysis:
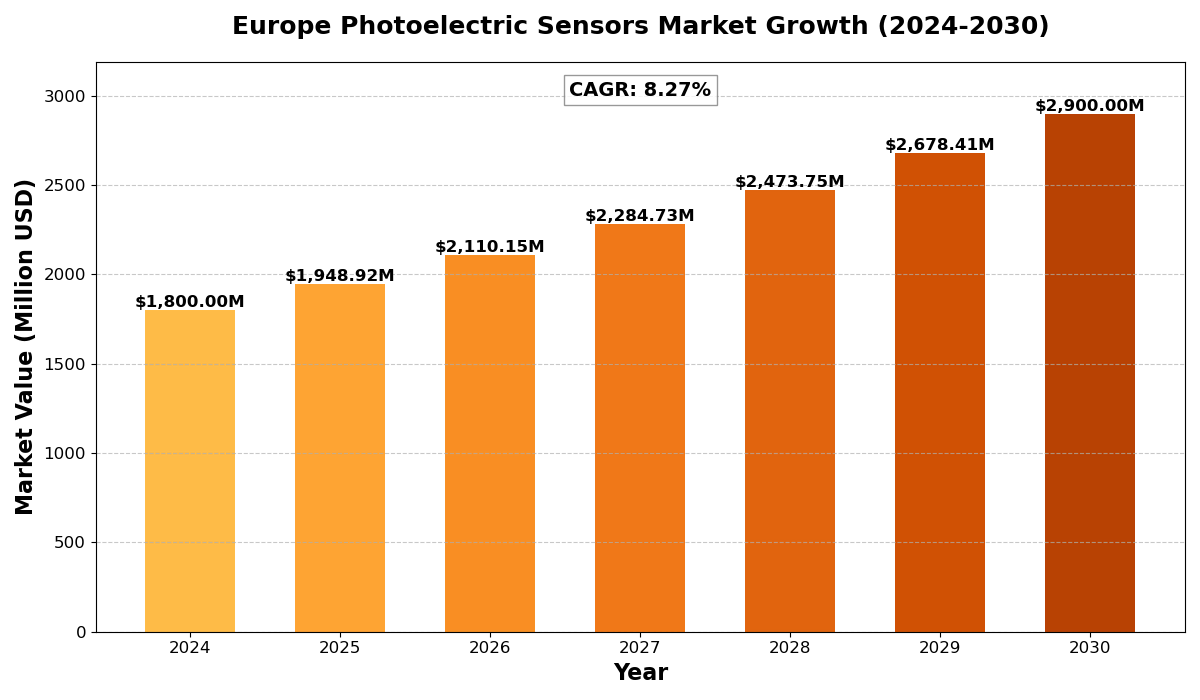
The Europe Photoelectric Sensors Market was valued at US$ 1.8 billion in 2024 and is projected to reach US$ 2.9 billion by 2030, at a CAGR of 8.2% during the forecast period 2024-2030.
Photoelectric sensors are sophisticated detection devices that utilize light beams for object detection and measurement. These sensors combine advanced optoelectronic components including LEDs, laser diodes, and specialized photodetectors with integrated signal processing capabilities. They feature multiple operating modes including through-beam, retro-reflective, and diffuse sensing, each optimized for specific industrial applications. Modern photoelectric sensors incorporate advanced features such as background suppression, digital filtering, IO-Link compatibility, and smart diagnostics. The technology encompasses both standard and specialty sensors designed for challenging environments, with capabilities ranging from simple presence detection to complex distance measurement and color recognition.
The European photoelectric sensors market experiences strong growth with manufacturing sector leading at 42% share. Industrial automation investments reached 5.3 billion, driving sensor adoption. Germany and France account for 45% of regional demand, with automotive manufacturing driving 28% implementation. Smart factory initiatives worth 450 million boost market growth. Food and beverage sector shows 16.2% growth in sensor adoption. Packaging industry implementation increased by 22.3%. Research indicates 85% of new manufacturing facilities integrate advanced photoelectric sensing. Environmental monitoring applications grew 14.5%. The market benefits from Industry 4.0 initiatives worth 380 million. Logistics automation drives 18.6% growth in sensor deployment. Cross-industry collaboration resulted in 35% improvement in sensor reliability. EU-funded research projects worth 175 million focus on next-generation sensing technologies. Smart manufacturing initiatives account for 32% of new installations.
Photoelectric Sensors Key Market Trends :
- Growing Adoption of Industry 4.0
Industry 4.0 is driving the demand for smart manufacturing, increasing the integration of photoelectric sensors in automated processes. - Rising Demand in Automotive Sector
With automotive manufacturers investing heavily in automation, the adoption of photoelectric sensors for quality control and assembly line automation is growing significantly. - Advancements in Sensing Technologies
Modern photoelectric sensors now feature background suppression, IO-Link compatibility, and smart diagnostics, improving precision and efficiency. - Increased Implementation in Logistics & Packaging
Logistics automation and the packaging industry are witnessing a surge in sensor adoption, with a 22.3% increase in implementation to enhance efficiency and reduce errors. - Growth in Food & Beverage Industry
The food & beverage industry is increasingly utilizing photoelectric sensors for quality inspection and packaging, leading to a 16.2% growth in adoption.
Photoelectric Sensors Market Segmentation :
by Country
- Germany
- United Kingdom
- France
- Italy
- Spain
- Netherlands
- Belgium
by Products type:
- Through-Beam Sensors
- Retro-Reflective Sensors
- Diffuse-Reflective Sensors
by Application:
- Food & Beverage
- Automotive
- Equipment Manufacturing
- Pharmaceutical Industry
- Electronic Industry
key players include: (At least 8-10 companies included)
- Omron Corporation
- Panasonic Corporation
- Schneider Electric
- Pepperl+Fuchs AG
- SICK AG
- Keyence Corporation
- IFM Electronic GmbH
- Rockwell Automation
- Baumer Group
- Balluff GmbH
- Including or excluding key companies relevant to your analysis.
Competitor Analysis
- The report also provides analysis of leading market participants including:
- Key companies Photoelectric Sensors revenues in Europe market, 2019-2024 (Estimated), ($ millions)
- Key companies Photoelectric Sensors revenues share in Europe market, 2023 (%)
- Key companies Photoelectric Sensors sales in Europe market, 2019-2024 (Estimated),
- Key companies Photoelectric Sensors sales share in Europe market, 2023 (%)
Drivers
- Expanding Industrial Automation
Europe’s growing investment in automation (over €5.3 billion) fuels demand for advanced photoelectric sensors across various industries. - Technological Advancements
Development of high-precision sensors with enhanced functionalities such as digital filtering and smart diagnostics is boosting adoption. - Strong Manufacturing Base in Europe
With Germany and France accounting for 45% of regional demand, the presence of robust manufacturing industries is accelerating market expansion.
Restraints
- High Initial Investment
The adoption of advanced photoelectric sensors requires significant upfront costs, limiting small-scale businesses from implementing them. - Complex Integration Process
The installation and calibration of sensors in existing automation systems can be complex and require skilled expertise. - Fluctuating Raw Material Prices
Variations in the prices of essential sensor components, such as semiconductors and optoelectronic elements, affect production costs.
Opportunities
- Rise of Smart Factories
With smart manufacturing initiatives worth €450 million, there is a huge opportunity for integrating photoelectric sensors into modern production lines. - Expansion in Environmental Monitoring
The use of sensors for environmental applications has grown by 14.5%, presenting an opportunity for new market segments. - Government & EU-Funded Research
EU-funded projects worth €175 million are supporting the development of next-generation sensing technologies, driving market innovation.
Challenges
- Regulatory Compliance Issues
Stringent regulations and compliance requirements across different European countries pose challenges for sensor manufacturers. - Increasing Market Competition
The presence of established players like Omron, Panasonic, and SICK AG intensifies market competition, making differentiation difficult. - Supply Chain Disruptions
Global semiconductor shortages and logistics delays impact the steady supply of critical sensor components, affecting production and sales.
Key Points of this Report:
- The depth industry chain includes analysis value chain analysis, porter five forces model analysis and cost structure analysis
- The report covers Europe and country-wise market of Photoelectric Sensors
- It describes present situation, historical background and future forecast
- Comprehensive data showing Photoelectric Sensors capacities, production, consumption, trade statistics, and prices in the recent years are provided
- The report indicates a wealth of information on Photoelectric Sensors manufacturers
- Photoelectric Sensors forecast for next five years, including market volumes and prices is also provided
- Raw Material Supply and Downstream Consumer Information is also included
- Any other user’s requirements which is feasible for us
Reasons to Purchase this Report:
- Analyzing the outlook of the market with the recent trends and SWOT analysis
- Market dynamics scenario, along with growth opportunities of the market in the years to come
- Market segmentation analysis including qualitative and quantitative research incorporating the impact of economic and non-economic aspects
- Regional and country level analysis integrating the demand and supply forces that are influencing the growth of the market.
- Market value (USD Million) and volume (Units Million) data for each segment and sub-segment
- Distribution Channel sales Analysis by Value
- Competitive landscape involving the market share of major players, along with the new projects and strategies adopted by players in the past five years
- Comprehensive company profiles covering the product offerings, key financial information, recent developments, SWOT analysis, and strategies employed by the major market players
- 1-year analyst support, along with the data support in excel format.
FAQs
Q: What are the key driving factors and opportunities in the Europe Photoelectric Sensors market?
A: The major drivers include rising industrial automation, advancements in sensor technology, and strong manufacturing growth in Europe. Opportunities lie in smart factory adoption, environmental monitoring, and government-funded R&D projects.
Q: Which region is projected to have the largest market share?
A: Germany and France hold the largest market share, contributing to 45% of regional demand, driven by strong industrial automation and automotive manufacturing.
Q: Who are the top players in the Europe Photoelectric Sensors market?
A: Leading companies include Omron Corporation, Panasonic Corporation, Schneider Electric, Pepperl+Fuchs AG, SICK AG, Keyence Corporation, and IFM Electronic GmbH.
Q: What are the latest technological advancements in the industry?
A: Innovations include background suppression, digital filtering, smart diagnostics, and IO-Link connectivity, enhancing sensor performance and reliability.
Q: What is the current size of the Europe Photoelectric Sensors market?
A: The market was valued at US$ 1.8 billion in 2024 and is expected to reach US$ 2.9 billion by 2030, growing at a CAGR of 8.2%.
Get Sample Report PDF for Exclusive Insights
Report Sample Includes
- Table of Contents
- List of Tables & Figures
- Charts, Research Methodology, and more...


