Embedded Discrete DRAM Market, Trends, Business Strategies 2025-2032

Embedded Discrete DRAM Market was valued at 1725 million in 2024 and is projected to reach US$ 2603 million by 2032, at a CAGR of 6.9% during the forecast period

PDF Icon Download Sample Report PDF
  • Quick Dispatch

    All Orders

  • Secure Payment

    100% Secure Payment

Price range: $1,500.00 through $4,250.00

Clear

MARKET INSIGHTS

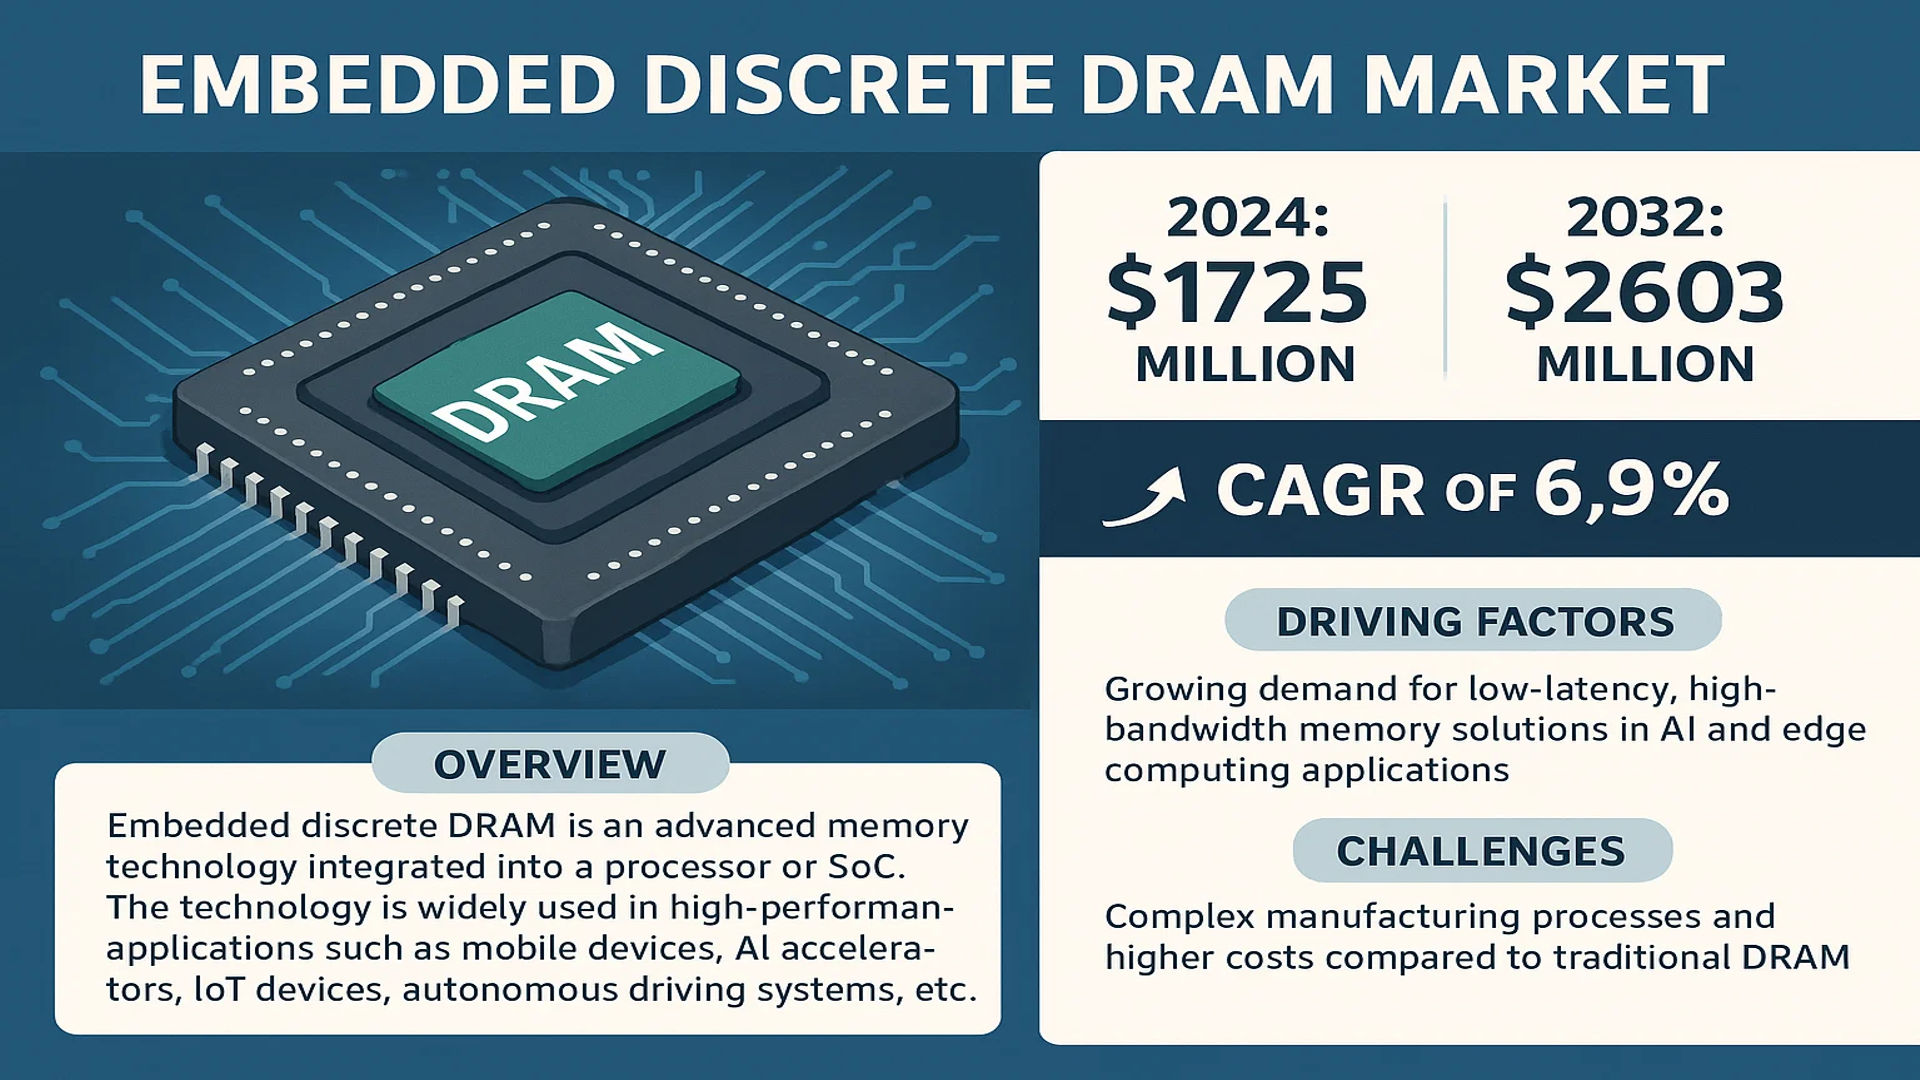
The global Embedded Discrete DRAM Market was valued at 1725 million in 2024 and is projected to reach US$ 2603 million by 2032, at a CAGR of 6.9% during the forecast period.

Embedded discrete DRAM is an advanced memory technology that integrates dynamic random access memory (DRAM) directly into a processor or system-on-chip (SoC). This integration significantly reduces data transmission latency and enhances energy efficiency by closely coupling memory with computing units. The technology is widely used in high-performance applications such as mobile devices, artificial intelligence accelerators, IoT devices, and autonomous driving systems. Key packaging technologies enabling this innovation include 2.5D and 3D integration, which provide high bandwidth while minimizing power consumption and space requirements.

The market growth is primarily driven by increasing demand for low-latency, high-bandwidth memory solutions in AI and edge computing applications. However, challenges such as complex manufacturing processes and higher costs compared to traditional DRAM may restrain expansion. Leading players like Samsung Electronics, SK Hynix, and Micron are investing heavily in R&D to overcome these barriers while expanding production capacities to meet growing demand from data centers and 5G infrastructure.

Embedded Discrete DRAM Market

MARKET DYNAMICS

MARKET DRIVERS

Rising Demand for AI & Edge Computing Solutions to Propel Embedded DRAM Adoption

The global artificial intelligence market continues its explosive growth trajectory, with specialized AI chips expected to represent nearly 30% of total semiconductor revenue by 2030. This creates significant demand for high-bandwidth memory solutions like embedded discrete DRAM that can meet the intensive computational requirements of neural networks while maintaining energy efficiency. Unlike traditional discrete DRAM modules, embedded implementations reduce data transfer bottlenecks between processor and memory through innovative 2.5D and 3D packaging technologies. The edge computing revolution further amplifies this trend, as latency-sensitive applications in smart cities, industrial IoT, and autonomous vehicles require memory solutions that minimize power consumption while delivering real-time processing capabilities.

Mobile Device Miniaturization Drives Innovation in Embedded Memory Solutions

The smartphone industry’s relentless pursuit of thinner form factors and longer battery life creates perfect conditions for embedded DRAM adoption. As flagship smartphones increasingly incorporate advanced computational photography, on-device AI processing, and augmented reality features, the need for memory architectures that save space while reducing power consumption becomes critical. Process node shrink limitations below 7nm further incentivize innovative packaging approaches – with recent industry analyses showing that embedded DRAM solutions can reduce memory subsystem power consumption by up to 60% compared to conventional designs in mobile applications. This technological advantage positions embedded discrete DRAM as a key enabler for next-generation mobile devices.

Automotive Semiconductor Expansion Creates New Growth Vectors

The automotive industry’s transformation towards autonomous driving and advanced driver assistance systems (ADAS) represents a significant opportunity for embedded discrete DRAM providers. Modern vehicle architectures require failsafe memory solutions that combine high bandwidth with low latency, particularly for processing inputs from multiple high-resolution sensors in real time. The automotive semiconductor market is projected to grow at over 12% CAGR through 2030, with memory solutions accounting for an increasingly larger portion of bill-of-materials. Embedded DRAM’s ability to meet stringent automotive reliability standards while reducing system complexity makes it particularly attractive for functional safety applications in next-generation vehicles.

MARKET RESTRAINTS

High Development Costs and Technical Complexities Limit Market Penetration

While embedded discrete DRAM offers compelling technical advantages, its adoption faces significant economic barriers. The development of advanced packaging solutions like 2.5D and 3D integration requires substantial capital expenditure, with mask set costs for new designs exceeding conventional DRAM products by 3-5x. This pricing dynamic creates challenges for widespread adoption outside flagship applications where performance justifies the premium. Furthermore, the complex thermal management and signal integrity requirements of stacked memory configurations require specialized design expertise that remains concentrated among a limited number of semiconductor firms.

Limited Manufacturing Capacity Constrains Market Expansion

The semiconductor industry’s transition to advanced packaging technologies has outpaced the development of corresponding manufacturing infrastructure. Available capacity for 2.5D and 3D integration remains concentrated among a handful of foundries, creating potential supply chain bottlenecks as demand grows. This constraint is particularly acute for embedded DRAM solutions requiring sophisticated through-silicon via (TSV) technologies, where qualification cycles for new production lines can exceed 18 months. The resulting supply-demand imbalance could temporarily limit market growth despite strong underlying demand drivers.

Standardization Challenges Impede Ecosystem Development

The lack of industry-wide standards for embedded discrete DRAM interfaces creates integration challenges that hinder broader adoption. Unlike conventional DRAM technologies that benefit from well-established JEDEC specifications, emerging embedded solutions often require custom interfaces tailored to specific processor architectures. This fragmentation increases development costs for system integrators and limits interoperability between components from different vendors. The absence of common design rules for power delivery, signaling, and thermal management in 3D-stacked configurations further complicates the development of multi-vendor solutions.

MARKET CHALLENGES

Yield Optimization Remains Critical Challenge for Mass Production

Embedded discrete DRAM manufacturing faces unique yield challenges compared to conventional memory solutions. The complex interplay between logic devices and memory arrays in advanced packaging configurations compounds the impact of defects, with yield losses at any stage potentially rendering the entire stacked assembly unusable. Current industry estimates suggest that mature embedded DRAM production lines achieve yields 15-20% lower than comparable conventional DRAM processes. This yield gap represents a significant cost penalty that must be overcome through continued process refinement and design-for-manufacturing innovations.

Thermal Management Issues Demand Innovative Solutions

The tight integration of processing elements with memory arrays in embedded DRAM configurations creates formidable thermal management challenges. Memory cells exhibit temperature sensitivity that can impact retention characteristics, while densely packed logic devices generate significant heat. This thermal coupling can lead to performance throttling or reliability degradation if not properly addressed. Advanced packaging approaches compound these issues by introducing additional thermal interfaces and reducing the effectiveness of traditional cooling solutions. Recent studies suggest thermal considerations may limit maximum clock frequencies for some embedded DRAM configurations by 10-15% compared to discrete implementations.

MARKET OPPORTUNITIES

Emerging Memory-Centric Architectures Present Growth Potential

The semiconductor industry’s shift toward memory-centric computing architectures creates significant opportunities for embedded DRAM solutions. New computational paradigms like processing-in-memory (PIM) and near-memory computing rely on tight integration of logic and memory components to overcome data movement bottlenecks. These approaches could increase embedded DRAM attach rates in data center accelerators and high-performance computing applications by 3-4x over current levels within five years. The growing recognition of memory bandwidth as a critical performance limiter across multiple computing domains further strengthens the business case for adoption.

Heterogeneous Integration Trends Drive New Applications

Advancements in heterogeneous integration technologies enable novel combinations of processors, memory, and specialized accelerators that were previously unachievable. This trend opens new application areas for embedded discrete DRAM beyond traditional strongholds, including ultra-low-power wearable devices, high-performance medical imaging systems, and space-constrained industrial automation equipment. The ability to customize memory configurations for specific workload requirements while maintaining small form factors presents compelling value propositions across multiple industries.

Advanced Packaging Roadmaps Enable Cost Reductions

Ongoing innovations in semiconductor packaging technologies promise to address current cost barriers to embedded DRAM adoption. The development of high-density interconnect schemes, improved TSV processes, and wafer-level packaging techniques could reduce manufacturing costs by 30-40% over the next three years. These improvements, combined with increasing production volumes, will enhance the economic viability of embedded solutions for mid-range applications. Packaging technology roadmaps also indicate potential for mixed-node integration, allowing optimized pairing of mature memory processes with cutting-edge logic technologies to further optimize cost-performance tradeoffs.

EMBEDDED DISCRETE DRAM MARKET TRENDS

Rising Adoption in AI and Autonomous Driving to Drive Market Growth

The increasing integration of embedded discrete DRAM in artificial intelligence (AI) accelerators and autonomous driving systems is a key driver of market expansion. AI workloads, particularly those involving deep learning and neural network training, demand ultra-low latency and high-bandwidth memory solutions. Embedded DRAM, with its proximity to processing units, offers significant performance advantages, reducing data transfer bottlenecks. In the automotive sector, advanced driver-assistance systems (ADAS) and autonomous vehicles rely on embedded DRAM for real-time data processing. The market for autonomous vehicle semiconductors is projected to grow significantly, further fueling demand for high-performance memory solutions.

Other Trends

2.5D and 3D Integration Technologies

Advanced packaging techniques like 2.5D and 3D integration are transforming the embedded discrete DRAM landscape by enabling higher-density memory stacks with improved thermal efficiency. These technologies allow DRAM to be vertically integrated with processors using interposers or through-silicon vias (TSVs), dramatically increasing bandwidth while reducing power consumption. The 2.5D integration segment alone is expected to witness substantial growth due to its cost-effectiveness and scalability. Furthermore, 3D stacking continues to evolve, with major semiconductor players investing heavily in next-generation packaging solutions to meet the demands of high-performance computing.

Mobile Device Innovation and IoT Expansion

The proliferation of 5G-enabled smartphones and Internet of Things (IoT) devices is creating robust demand for embedded discrete DRAM solutions. Mobile device manufacturers are prioritizing power efficiency and compact form factors, making embedded DRAM particularly attractive compared to traditional discrete memory modules. In IoT applications, where energy consumption and space constraints are critical, embedded memory solutions offer significant advantages. The accelerating deployment of edge computing devices and wearables is further expanding the application scope for these memory technologies, with market projections indicating steady growth in these sectors through the forecast period.

Competitive Landscape and Regional Growth Patterns

The market is characterized by intense competition among leading semiconductor giants, with significant R&D investments focused on developing more efficient embedded memory solutions. While North America currently holds a substantial market share due to its concentration of AI and autonomous vehicle technology companies, the Asia-Pacific region is emerging as the fastest-growing market. China and South Korea, in particular, are witnessing rapid adoption of embedded DRAM technologies across various applications, supported by government initiatives in semiconductor self-sufficiency and smart manufacturing. Meanwhile, European markets show particular strength in automotive applications, with leading manufacturers integrating advanced memory solutions into next-generation vehicle architectures.

COMPETITIVE LANDSCAPE

Key Industry Players

Semiconductor Giants and Niche Suppliers Battle for Market Dominance

The global embedded discrete DRAM market features a dynamic competitive landscape where established semiconductor leaders compete with specialized memory suppliers. Samsung Electronics and SK Hynix collectively dominate nearly 60% of the market share, leveraging their advanced process nodes and vertical integration capabilities. These Korean conglomerates continue to invest heavily in 3D-stacking technologies to maintain their leadership position.

Micron Technology has emerged as a strong contender, particularly in the North American market, where its partnerships with automotive and AI chip designers have driven significant growth. The company’s development of next-generation GDDR6-based embedded solutions positions it well for future market expansion.

Meanwhile, Taiwanese players Taiwan Semiconductor Manufacturing Company (TSMC) and United Microelectronics Corporation are gaining traction through their foundry services, enabling fabless semiconductor companies to integrate DRAM into advanced SoC designs. Their collaboration with packaging specialists in the development of chiplet architectures represents a key competitive advantage.

The market also features several specialized suppliers like Innodisk and Arcotek that focus on industrial and automotive applications. These companies compete through application-specific optimizations and reliability enhancements, particularly in extreme temperature environments.

List of Key Embedded Discrete DRAM Companies

Segment Analysis:

By Type

2.5D Integration Leads Market Growth Due to High Adoption in AI and Autonomous Systems

The market is segmented based on type into:

  • 2.5D Integration
    • Subvariants: Silicon interposer-based, organic interposer-based, and others
  • 3D Integration
  • Advanced Packaging
    • Subvariants: Fan-out wafer-level packaging, chip-on-wafer, wafer-on-wafer
  • Hybrid Solutions

By Application

AI Accelerators Show Highest Potential Due to Increasing Demand for High-Performance Computing

The market is segmented based on application into:

  • Mobile Devices
  • Artificial Intelligence
    • Subapplications: Machine learning processors, neural network accelerators
  • Autonomous Driving
  • IoT Edge Devices
  • High-Performance Computing

By End-User

Consumer Electronics Sector Drives Market Adoption Through Smartphone and Wearable Technologies

The market is segmented based on end-user into:

  • Consumer Electronics
    • Subsegments: Smartphones, tablets, wearables
  • Automotive
  • Data Centers
  • Industrial Automation
  • Medical Devices

By Technology Node

Sub-10nm Nodes Gain Traction for Power-Efficient Embedded Memory Solutions

The market is segmented based on technology node into:

  • Above 28nm
  • 16-28nm
  • 10-16nm
  • Below 10nm
    • Subcategories: 7nm, 5nm, 3nm

Regional Analysis: Embedded Discrete DRAM Market

Asia-Pacific
The Asia-Pacific region dominates the global Embedded Discrete DRAM market, accounting for over 45% of the total revenue share in 2024, driven largely by China, South Korea, and Japan. This leadership stems from the region’s strong semiconductor manufacturing base, with key players like Samsung Electronics, SK Hynix, and Taiwan Semiconductor Manufacturing Company (TSMC) investing heavily in advanced packaging technologies such as 2.5D and 3D integration. The rapid adoption of AI accelerators, 5G-enabled mobile devices, and IoT applications further fuels demand for high-bandwidth, low-latency memory solutions. However, geopolitical tensions and export controls on semiconductor technologies present supply chain risks that companies must navigate strategically.

North America
North America is a hub for innovation in Embedded Discrete DRAM, with the U.S. leading in R&D and early adoption across AI data centers, autonomous vehicles, and edge computing. Major tech firms collaborate with memory manufacturers like Micron and Intel to develop customized solutions, particularly for high-performance computing (HPC) applications. The region benefits from substantial venture capital funding in AI startups and federal initiatives like the CHIPS Act, which allocated $52 billion to bolster domestic semiconductor production. Stringent IP protection laws also encourage proprietary technology development, though dependence on Asian foundries for manufacturing remains a vulnerability.

Europe
Europe’s market growth is propelled by automotive and industrial IoT applications, with Germany and France at the forefront. The region emphasizes energy-efficient designs to align with EU sustainability goals, driving demand for embedded DRAM in smart sensors and automotive ECUs. Collaborative research projects such as the EuroHPC initiative accelerate innovation, while stringent data privacy regulations shape memory architecture requirements. Nonetheless, slower adoption rates in consumer electronics compared to Asia and limited local DRAM production capacity restrain market expansion.

South America
The South American market shows nascent but promising growth, primarily in Brazil and Argentina, where telecom infrastructure upgrades and Industry 4.0 initiatives create opportunities for embedded memory solutions. Local manufacturers face challenges due to limited semiconductor ecosystem maturity and reliance on imported components, though increasing partnerships with global suppliers aim to bridge this gap. Economic volatility and inconsistent policy support continue to hinder large-scale investments in advanced packaging facilities.

Middle East & Africa
This emerging market is witnessing gradual adoption, led by smart city projects in the UAE and Saudi Arabia that incorporate AI and IoT technologies. While the lack of local semiconductor fabrication limits direct production, government-led technology diversification plans are attracting foreign memory suppliers to establish regional design centers. The emphasis on data localization in financial and healthcare sectors presents a unique growth niche for secure embedded memory solutions, albeit at a slower pace compared to other regions.

Report Scope

This market research report provides a comprehensive analysis of the Global Embedded Discrete DRAM Market, covering the forecast period 2024–2032. It offers detailed insights into market dynamics, technological advancements, competitive landscape, and key trends shaping the industry.

Key focus areas of the report include:

  • Market Size & Forecast: Historical data and future projections for revenue, unit shipments, and market value across major regions and segments. The global market was valued at USD 1,725 million in 2024 and is projected to reach USD 2,603 million by 2032, growing at a CAGR of 6.9%.
  • Segmentation Analysis: Detailed breakdown by type (2.5D Integration, 3D Integration) and application (Mobile Devices, Artificial Intelligence, Autonomous Driving) to identify high-growth segments.
  • Regional Outlook: Insights into market performance across North America, Europe, Asia-Pacific, Latin America, and Middle East & Africa, with country-level analysis. The U.S. and China are key growth markets.
  • Competitive Landscape: Profiles of leading players including Samsung Electronics, SK Hynix, Micron, Intel, and Taiwan Semiconductor, covering their product portfolios, market share, and strategic developments.
  • Technology Trends & Innovation: Assessment of advanced packaging technologies like 2.5D/3D integration and their impact on performance and power efficiency.
  • Market Drivers & Restraints: Evaluation of factors such as AI/ML adoption, 5G expansion, and IoT growth versus challenges like supply chain constraints and fabrication complexity.
  • Stakeholder Analysis: Strategic insights for semiconductor manufacturers, foundries, OEMs, and investors regarding emerging opportunities.

The report employs primary and secondary research methodologies, including expert interviews and verified market data, to ensure accuracy and reliability.

FREQUENTLY ASKED QUESTIONS:

What is the current market size of Global Embedded Discrete DRAM Market?

-> Embedded Discrete DRAM Market was valued at 1725 million in 2024 and is projected to reach US$ 2603 million by 2032, at a CAGR of 6.9% during the forecast period.

Which key companies operate in this market?

-> Major players include Samsung Electronics, SK Hynix, Micron, Intel, Taiwan Semiconductor, Kingston Technology, and Kioxia.

What are the key growth drivers?

-> Growth is driven by rising demand for high-performance computing, AI/ML applications, 5G adoption, and autonomous vehicles.

Which region dominates the market?

-> Asia-Pacific leads in both production and consumption, with North America being a key innovation hub.

What are the emerging trends?

-> Key trends include 3D-stacked DRAM adoption, heterogeneous integration, and development of ultra-low-power solutions for edge devices.

Embedded Discrete DRAM Market, Trends, Business Strategies 2025-2032

Get Sample Report PDF for Exclusive Insights

Report Sample Includes

  • Table of Contents
  • List of Tables & Figures
  • Charts, Research Methodology, and more...
PDF Icon Download Sample Report PDF

Download Sample Report

Table of Content

1 Introduction to Research & Analysis Reports
1.1 Embedded Discrete DRAM Market Definition
1.2 Market Segments
1.2.1 Segment by Type
1.2.2 Segment by Application
1.3 Global Embedded Discrete DRAM Market Overview
1.4 Features & Benefits of This Report
1.5 Methodology & Sources of Information
1.5.1 Research Methodology
1.5.2 Research Process
1.5.3 Base Year
1.5.4 Report Assumptions & Caveats
2 Global Embedded Discrete DRAM Overall Market Size
2.1 Global Embedded Discrete DRAM Market Size: 2024 VS 2032
2.2 Global Embedded Discrete DRAM Market Size, Prospects & Forecasts: 2020-2032
2.3 Global Embedded Discrete DRAM Sales: 2020-2032
3 Company Landscape
3.1 Top Embedded Discrete DRAM Players in Global Market
3.2 Top Global Embedded Discrete DRAM Companies Ranked by Revenue
3.3 Global Embedded Discrete DRAM Revenue by Companies
3.4 Global Embedded Discrete DRAM Sales by Companies
3.5 Global Embedded Discrete DRAM Price by Manufacturer (2020-2025)
3.6 Top 3 and Top 5 Embedded Discrete DRAM Companies in Global Market, by Revenue in 2024
3.7 Global Manufacturers Embedded Discrete DRAM Product Type
3.8 Tier 1, Tier 2, and Tier 3 Embedded Discrete DRAM Players in Global Market
3.8.1 List of Global Tier 1 Embedded Discrete DRAM Companies
3.8.2 List of Global Tier 2 and Tier 3 Embedded Discrete DRAM Companies
4 Sights by Product
4.1 Overview
4.1.1 Segment by Type – Global Embedded Discrete DRAM Market Size Markets, 2024 & 2032
4.1.2 2.5D Integration
4.1.3 3D Integration
4.2 Segment by Type – Global Embedded Discrete DRAM Revenue & Forecasts
4.2.1 Segment by Type – Global Embedded Discrete DRAM Revenue, 2020-2025
4.2.2 Segment by Type – Global Embedded Discrete DRAM Revenue, 2026-2032
4.2.3 Segment by Type – Global Embedded Discrete DRAM Revenue Market Share, 2020-2032
4.3 Segment by Type – Global Embedded Discrete DRAM Sales & Forecasts
4.3.1 Segment by Type – Global Embedded Discrete DRAM Sales, 2020-2025
4.3.2 Segment by Type – Global Embedded Discrete DRAM Sales, 2026-2032
4.3.3 Segment by Type – Global Embedded Discrete DRAM Sales Market Share, 2020-2032
4.4 Segment by Type – Global Embedded Discrete DRAM Price (Manufacturers Selling Prices), 2020-2032
5 Sights by Application
5.1 Overview
5.1.1 Segment by Application – Global Embedded Discrete DRAM Market Size, 2024 & 2032
5.1.2 Mobile Devices
5.1.3 Artificial Intelligence
5.1.4 Autonomous Driving
5.2 Segment by Application – Global Embedded Discrete DRAM Revenue & Forecasts
5.2.1 Segment by Application – Global Embedded Discrete DRAM Revenue, 2020-2025
5.2.2 Segment by Application – Global Embedded Discrete DRAM Revenue, 2026-2032
5.2.3 Segment by Application – Global Embedded Discrete DRAM Revenue Market Share, 2020-2032
5.3 Segment by Application – Global Embedded Discrete DRAM Sales & Forecasts
5.3.1 Segment by Application – Global Embedded Discrete DRAM Sales, 2020-2025
5.3.2 Segment by Application – Global Embedded Discrete DRAM Sales, 2026-2032
5.3.3 Segment by Application – Global Embedded Discrete DRAM Sales Market Share, 2020-2032
5.4 Segment by Application – Global Embedded Discrete DRAM Price (Manufacturers Selling Prices), 2020-2032
6 Sights by Region
6.1 By Region – Global Embedded Discrete DRAM Market Size, 2024 & 2032
6.2 By Region – Global Embedded Discrete DRAM Revenue & Forecasts
6.2.1 By Region – Global Embedded Discrete DRAM Revenue, 2020-2025
6.2.2 By Region – Global Embedded Discrete DRAM Revenue, 2026-2032
6.2.3 By Region – Global Embedded Discrete DRAM Revenue Market Share, 2020-2032
6.3 By Region – Global Embedded Discrete DRAM Sales & Forecasts
6.3.1 By Region – Global Embedded Discrete DRAM Sales, 2020-2025
6.3.2 By Region – Global Embedded Discrete DRAM Sales, 2026-2032
6.3.3 By Region – Global Embedded Discrete DRAM Sales Market Share, 2020-2032
6.4 North America
6.4.1 By Country – North America Embedded Discrete DRAM Revenue, 2020-2032
6.4.2 By Country – North America Embedded Discrete DRAM Sales, 2020-2032
6.4.3 United States Embedded Discrete DRAM Market Size, 2020-2032
6.4.4 Canada Embedded Discrete DRAM Market Size, 2020-2032
6.4.5 Mexico Embedded Discrete DRAM Market Size, 2020-2032
6.5 Europe
6.5.1 By Country – Europe Embedded Discrete DRAM Revenue, 2020-2032
6.5.2 By Country – Europe Embedded Discrete DRAM Sales, 2020-2032
6.5.3 Germany Embedded Discrete DRAM Market Size, 2020-2032
6.5.4 France Embedded Discrete DRAM Market Size, 2020-2032
6.5.5 U.K. Embedded Discrete DRAM Market Size, 2020-2032
6.5.6 Italy Embedded Discrete DRAM Market Size, 2020-2032
6.5.7 Russia Embedded Discrete DRAM Market Size, 2020-2032
6.5.8 Nordic Countries Embedded Discrete DRAM Market Size, 2020-2032
6.5.9 Benelux Embedded Discrete DRAM Market Size, 2020-2032
6.6 Asia
6.6.1 By Region – Asia Embedded Discrete DRAM Revenue, 2020-2032
6.6.2 By Region – Asia Embedded Discrete DRAM Sales, 2020-2032
6.6.3 China Embedded Discrete DRAM Market Size, 2020-2032
6.6.4 Japan Embedded Discrete DRAM Market Size, 2020-2032
6.6.5 South Korea Embedded Discrete DRAM Market Size, 2020-2032
6.6.6 Southeast Asia Embedded Discrete DRAM Market Size, 2020-2032
6.6.7 India Embedded Discrete DRAM Market Size, 2020-2032
6.7 South America
6.7.1 By Country – South America Embedded Discrete DRAM Revenue, 2020-2032
6.7.2 By Country – South America Embedded Discrete DRAM Sales, 2020-2032
6.7.3 Brazil Embedded Discrete DRAM Market Size, 2020-2032
6.7.4 Argentina Embedded Discrete DRAM Market Size, 2020-2032
6.8 Middle East & Africa
6.8.1 By Country – Middle East & Africa Embedded Discrete DRAM Revenue, 2020-2032
6.8.2 By Country – Middle East & Africa Embedded Discrete DRAM Sales, 2020-2032
6.8.3 Turkey Embedded Discrete DRAM Market Size, 2020-2032
6.8.4 Israel Embedded Discrete DRAM Market Size, 2020-2032
6.8.5 Saudi Arabia Embedded Discrete DRAM Market Size, 2020-2032
6.8.6 UAE Embedded Discrete DRAM Market Size, 2020-2032
7 Manufacturers & Brands Profiles
7.1 Kingston Technology
7.1.1 Kingston Technology Company Summary
7.1.2 Kingston Technology Business Overview
7.1.3 Kingston Technology Embedded Discrete DRAM Major Product Offerings
7.1.4 Kingston Technology Embedded Discrete DRAM Sales and Revenue in Global (2020-2025)
7.1.5 Kingston Technology Key News & Latest Developments
7.2 Samsung Electronics
7.2.1 Samsung Electronics Company Summary
7.2.2 Samsung Electronics Business Overview
7.2.3 Samsung Electronics Embedded Discrete DRAM Major Product Offerings
7.2.4 Samsung Electronics Embedded Discrete DRAM Sales and Revenue in Global (2020-2025)
7.2.5 Samsung Electronics Key News & Latest Developments
7.3 SK Hynix
7.3.1 SK Hynix Company Summary
7.3.2 SK Hynix Business Overview
7.3.3 SK Hynix Embedded Discrete DRAM Major Product Offerings
7.3.4 SK Hynix Embedded Discrete DRAM Sales and Revenue in Global (2020-2025)
7.3.5 SK Hynix Key News & Latest Developments
7.4 Micron
7.4.1 Micron Company Summary
7.4.2 Micron Business Overview
7.4.3 Micron Embedded Discrete DRAM Major Product Offerings
7.4.4 Micron Embedded Discrete DRAM Sales and Revenue in Global (2020-2025)
7.4.5 Micron Key News & Latest Developments
7.5 Taiwan Semiconductor
7.5.1 Taiwan Semiconductor Company Summary
7.5.2 Taiwan Semiconductor Business Overview
7.5.3 Taiwan Semiconductor Embedded Discrete DRAM Major Product Offerings
7.5.4 Taiwan Semiconductor Embedded Discrete DRAM Sales and Revenue in Global (2020-2025)
7.5.5 Taiwan Semiconductor Key News & Latest Developments
7.6 Intel
7.6.1 Intel Company Summary
7.6.2 Intel Business Overview
7.6.3 Intel Embedded Discrete DRAM Major Product Offerings
7.6.4 Intel Embedded Discrete DRAM Sales and Revenue in Global (2020-2025)
7.6.5 Intel Key News & Latest Developments
7.7 Kioxia
7.7.1 Kioxia Company Summary
7.7.2 Kioxia Business Overview
7.7.3 Kioxia Embedded Discrete DRAM Major Product Offerings
7.7.4 Kioxia Embedded Discrete DRAM Sales and Revenue in Global (2020-2025)
7.7.5 Kioxia Key News & Latest Developments
7.8 United Microelectronics Corporation
7.8.1 United Microelectronics Corporation Company Summary
7.8.2 United Microelectronics Corporation Business Overview
7.8.3 United Microelectronics Corporation Embedded Discrete DRAM Major Product Offerings
7.8.4 United Microelectronics Corporation Embedded Discrete DRAM Sales and Revenue in Global (2020-2025)
7.8.5 United Microelectronics Corporation Key News & Latest Developments
7.9 Innodisk
7.9.1 Innodisk Company Summary
7.9.2 Innodisk Business Overview
7.9.3 Innodisk Embedded Discrete DRAM Major Product Offerings
7.9.4 Innodisk Embedded Discrete DRAM Sales and Revenue in Global (2020-2025)
7.9.5 Innodisk Key News & Latest Developments
7.10 Arcotek
7.10.1 Arcotek Company Summary
7.10.2 Arcotek Business Overview
7.10.3 Arcotek Embedded Discrete DRAM Major Product Offerings
7.10.4 Arcotek Embedded Discrete DRAM Sales and Revenue in Global (2020-2025)
7.10.5 Arcotek Key News & Latest Developments
7.11 Elpida Memory, Inc
7.11.1 Elpida Memory, Inc Company Summary
7.11.2 Elpida Memory, Inc Business Overview
7.11.3 Elpida Memory, Inc Embedded Discrete DRAM Major Product Offerings
7.11.4 Elpida Memory, Inc Embedded Discrete DRAM Sales and Revenue in Global (2020-2025)
7.11.5 Elpida Memory, Inc Key News & Latest Developments
8 Global Embedded Discrete DRAM Production Capacity, Analysis
8.1 Global Embedded Discrete DRAM Production Capacity, 2020-2032
8.2 Embedded Discrete DRAM Production Capacity of Key Manufacturers in Global Market
8.3 Global Embedded Discrete DRAM Production by Region
9 Key Market Trends, Opportunity, Drivers and Restraints
9.1 Market Opportunities & Trends
9.2 Market Drivers
9.3 Market Restraints
10 Embedded Discrete DRAM Supply Chain Analysis
10.1 Embedded Discrete DRAM Industry Value Chain
10.2 Embedded Discrete DRAM Upstream Market
10.3 Embedded Discrete DRAM Downstream and Clients
10.4 Marketing Channels Analysis
10.4.1 Marketing Channels
10.4.2 Embedded Discrete DRAM Distributors and Sales Agents in Global
11 Conclusion
12 Appendix
12.1 Note
12.2 Examples of Clients
12.3 DisclaimerList of Tables
Table 1. Key Players of Embedded Discrete DRAM in Global Market
Table 2. Top Embedded Discrete DRAM Players in Global Market, Ranking by Revenue (2024)
Table 3. Global Embedded Discrete DRAM Revenue by Companies, (US$, Mn), 2020-2025
Table 4. Global Embedded Discrete DRAM Revenue Share by Companies, 2020-2025
Table 5. Global Embedded Discrete DRAM Sales by Companies, (K Units), 2020-2025
Table 6. Global Embedded Discrete DRAM Sales Share by Companies, 2020-2025
Table 7. Key Manufacturers Embedded Discrete DRAM Price (2020-2025) & (US$/Unit)
Table 8. Global Manufacturers Embedded Discrete DRAM Product Type
Table 9. List of Global Tier 1 Embedded Discrete DRAM Companies, Revenue (US$, Mn) in 2024 and Market Share
Table 10. List of Global Tier 2 and Tier 3 Embedded Discrete DRAM Companies, Revenue (US$, Mn) in 2024 and Market Share
Table 11. Segment by Type – Global Embedded Discrete DRAM Revenue, (US$, Mn), 2024 & 2032
Table 12. Segment by Type – Global Embedded Discrete DRAM Revenue (US$, Mn), 2020-2025
Table 13. Segment by Type – Global Embedded Discrete DRAM Revenue (US$, Mn), 2026-2032
Table 14. Segment by Type – Global Embedded Discrete DRAM Sales (K Units), 2020-2025
Table 15. Segment by Type – Global Embedded Discrete DRAM Sales (K Units), 2026-2032
Table 16. Segment by Application – Global Embedded Discrete DRAM Revenue, (US$, Mn), 2024 & 2032
Table 17. Segment by Application – Global Embedded Discrete DRAM Revenue, (US$, Mn), 2020-2025
Table 18. Segment by Application – Global Embedded Discrete DRAM Revenue, (US$, Mn), 2026-2032
Table 19. Segment by Application – Global Embedded Discrete DRAM Sales, (K Units), 2020-2025
Table 20. Segment by Application – Global Embedded Discrete DRAM Sales, (K Units), 2026-2032
Table 21. By Region – Global Embedded Discrete DRAM Revenue, (US$, Mn), 2025-2032
Table 22. By Region – Global Embedded Discrete DRAM Revenue, (US$, Mn), 2020-2025
Table 23. By Region – Global Embedded Discrete DRAM Revenue, (US$, Mn), 2026-2032
Table 24. By Region – Global Embedded Discrete DRAM Sales, (K Units), 2020-2025
Table 25. By Region – Global Embedded Discrete DRAM Sales, (K Units), 2026-2032
Table 26. By Country – North America Embedded Discrete DRAM Revenue, (US$, Mn), 2020-2025
Table 27. By Country – North America Embedded Discrete DRAM Revenue, (US$, Mn), 2026-2032
Table 28. By Country – North America Embedded Discrete DRAM Sales, (K Units), 2020-2025
Table 29. By Country – North America Embedded Discrete DRAM Sales, (K Units), 2026-2032
Table 30. By Country – Europe Embedded Discrete DRAM Revenue, (US$, Mn), 2020-2025
Table 31. By Country – Europe Embedded Discrete DRAM Revenue, (US$, Mn), 2026-2032
Table 32. By Country – Europe Embedded Discrete DRAM Sales, (K Units), 2020-2025
Table 33. By Country – Europe Embedded Discrete DRAM Sales, (K Units), 2026-2032
Table 34. By Region – Asia Embedded Discrete DRAM Revenue, (US$, Mn), 2020-2025
Table 35. By Region – Asia Embedded Discrete DRAM Revenue, (US$, Mn), 2026-2032
Table 36. By Region – Asia Embedded Discrete DRAM Sales, (K Units), 2020-2025
Table 37. By Region – Asia Embedded Discrete DRAM Sales, (K Units), 2026-2032
Table 38. By Country – South America Embedded Discrete DRAM Revenue, (US$, Mn), 2020-2025
Table 39. By Country – South America Embedded Discrete DRAM Revenue, (US$, Mn), 2026-2032
Table 40. By Country – South America Embedded Discrete DRAM Sales, (K Units), 2020-2025
Table 41. By Country – South America Embedded Discrete DRAM Sales, (K Units), 2026-2032
Table 42. By Country – Middle East & Africa Embedded Discrete DRAM Revenue, (US$, Mn), 2020-2025
Table 43. By Country – Middle East & Africa Embedded Discrete DRAM Revenue, (US$, Mn), 2026-2032
Table 44. By Country – Middle East & Africa Embedded Discrete DRAM Sales, (K Units), 2020-2025
Table 45. By Country – Middle East & Africa Embedded Discrete DRAM Sales, (K Units), 2026-2032
Table 46. Kingston Technology Company Summary
Table 47. Kingston Technology Embedded Discrete DRAM Product Offerings
Table 48. Kingston Technology Embedded Discrete DRAM Sales (K Units), Revenue (US$, Mn) and Average Price (US$/Unit) & (2020-2025)
Table 49. Kingston Technology Key News & Latest Developments
Table 50. Samsung Electronics Company Summary
Table 51. Samsung Electronics Embedded Discrete DRAM Product Offerings
Table 52. Samsung Electronics Embedded Discrete DRAM Sales (K Units), Revenue (US$, Mn) and Average Price (US$/Unit) & (2020-2025)
Table 53. Samsung Electronics Key News & Latest Developments
Table 54. SK Hynix Company Summary
Table 55. SK Hynix Embedded Discrete DRAM Product Offerings
Table 56. SK Hynix Embedded Discrete DRAM Sales (K Units), Revenue (US$, Mn) and Average Price (US$/Unit) & (2020-2025)
Table 57. SK Hynix Key News & Latest Developments
Table 58. Micron Company Summary
Table 59. Micron Embedded Discrete DRAM Product Offerings
Table 60. Micron Embedded Discrete DRAM Sales (K Units), Revenue (US$, Mn) and Average Price (US$/Unit) & (2020-2025)
Table 61. Micron Key News & Latest Developments
Table 62. Taiwan Semiconductor Company Summary
Table 63. Taiwan Semiconductor Embedded Discrete DRAM Product Offerings
Table 64. Taiwan Semiconductor Embedded Discrete DRAM Sales (K Units), Revenue (US$, Mn) and Average Price (US$/Unit) & (2020-2025)
Table 65. Taiwan Semiconductor Key News & Latest Developments
Table 66. Intel Company Summary
Table 67. Intel Embedded Discrete DRAM Product Offerings
Table 68. Intel Embedded Discrete DRAM Sales (K Units), Revenue (US$, Mn) and Average Price (US$/Unit) & (2020-2025)
Table 69. Intel Key News & Latest Developments
Table 70. Kioxia Company Summary
Table 71. Kioxia Embedded Discrete DRAM Product Offerings
Table 72. Kioxia Embedded Discrete DRAM Sales (K Units), Revenue (US$, Mn) and Average Price (US$/Unit) & (2020-2025)
Table 73. Kioxia Key News & Latest Developments
Table 74. United Microelectronics Corporation Company Summary
Table 75. United Microelectronics Corporation Embedded Discrete DRAM Product Offerings
Table 76. United Microelectronics Corporation Embedded Discrete DRAM Sales (K Units), Revenue (US$, Mn) and Average Price (US$/Unit) & (2020-2025)
Table 77. United Microelectronics Corporation Key News & Latest Developments
Table 78. Innodisk Company Summary
Table 79. Innodisk Embedded Discrete DRAM Product Offerings
Table 80. Innodisk Embedded Discrete DRAM Sales (K Units), Revenue (US$, Mn) and Average Price (US$/Unit) & (2020-2025)
Table 81. Innodisk Key News & Latest Developments
Table 82. Arcotek Company Summary
Table 83. Arcotek Embedded Discrete DRAM Product Offerings
Table 84. Arcotek Embedded Discrete DRAM Sales (K Units), Revenue (US$, Mn) and Average Price (US$/Unit) & (2020-2025)
Table 85. Arcotek Key News & Latest Developments
Table 86. Elpida Memory, Inc Company Summary
Table 87. Elpida Memory, Inc Embedded Discrete DRAM Product Offerings
Table 88. Elpida Memory, Inc Embedded Discrete DRAM Sales (K Units), Revenue (US$, Mn) and Average Price (US$/Unit) & (2020-2025)
Table 89. Elpida Memory, Inc Key News & Latest Developments
Table 90. Embedded Discrete DRAM Capacity of Key Manufacturers in Global Market, 2023-2025 (K Units)
Table 91. Global Embedded Discrete DRAM Capacity Market Share of Key Manufacturers, 2023-2025
Table 92. Global Embedded Discrete DRAM Production by Region, 2020-2025 (K Units)
Table 93. Global Embedded Discrete DRAM Production by Region, 2026-2032 (K Units)
Table 94. Embedded Discrete DRAM Market Opportunities & Trends in Global Market
Table 95. Embedded Discrete DRAM Market Drivers in Global Market
Table 96. Embedded Discrete DRAM Market Restraints in Global Market
Table 97. Embedded Discrete DRAM Raw Materials
Table 98. Embedded Discrete DRAM Raw Materials Suppliers in Global Market
Table 99. Typical Embedded Discrete DRAM Downstream
Table 100. Embedded Discrete DRAM Downstream Clients in Global Market
Table 101. Embedded Discrete DRAM Distributors and Sales Agents in Global Market

List of Figures
Figure 1. Embedded Discrete DRAM Product Picture
Figure 2. Embedded Discrete DRAM Segment by Type in 2024
Figure 3. Embedded Discrete DRAM Segment by Application in 2024
Figure 4. Global Embedded Discrete DRAM Market Overview: 2024
Figure 5. Key Caveats
Figure 6. Global Embedded Discrete DRAM Market Size: 2024 VS 2032 (US$, Mn)
Figure 7. Global Embedded Discrete DRAM Revenue: 2020-2032 (US$, Mn)
Figure 8. Embedded Discrete DRAM Sales in Global Market: 2020-2032 (K Units)
Figure 9. The Top 3 and 5 Players Market Share by Embedded Discrete DRAM Revenue in 2024
Figure 10. Segment by Type – Global Embedded Discrete DRAM Revenue, (US$, Mn), 2024 & 2032
Figure 11. Segment by Type – Global Embedded Discrete DRAM Revenue Market Share, 2020-2032
Figure 12. Segment by Type – Global Embedded Discrete DRAM Sales Market Share, 2020-2032
Figure 13. Segment by Type – Global Embedded Discrete DRAM Price (US$/Unit), 2020-2032
Figure 14. Segment by Application – Global Embedded Discrete DRAM Revenue, (US$, Mn), 2024 & 2032
Figure 15. Segment by Application – Global Embedded Discrete DRAM Revenue Market Share, 2020-2032
Figure 16. Segment by Application – Global Embedded Discrete DRAM Sales Market Share, 2020-2032
Figure 17. Segment by Application -Global Embedded Discrete DRAM Price (US$/Unit), 2020-2032
Figure 18. By Region – Global Embedded Discrete DRAM Revenue, (US$, Mn), 2025 & 2032
Figure 19. By Region – Global Embedded Discrete DRAM Revenue Market Share, 2020 VS 2024 VS 2032
Figure 20. By Region – Global Embedded Discrete DRAM Revenue Market Share, 2020-2032
Figure 21. By Region – Global Embedded Discrete DRAM Sales Market Share, 2020-2032
Figure 22. By Country – North America Embedded Discrete DRAM Revenue Market Share, 2020-2032
Figure 23. By Country – North America Embedded Discrete DRAM Sales Market Share, 2020-2032
Figure 24. United States Embedded Discrete DRAM Revenue, (US$, Mn), 2020-2032
Figure 25. Canada Embedded Discrete DRAM Revenue, (US$, Mn), 2020-2032
Figure 26. Mexico Embedded Discrete DRAM Revenue, (US$, Mn), 2020-2032
Figure 27. By Country – Europe Embedded Discrete DRAM Revenue Market Share, 2020-2032
Figure 28. By Country – Europe Embedded Discrete DRAM Sales Market Share, 2020-2032
Figure 29. Germany Embedded Discrete DRAM Revenue, (US$, Mn), 2020-2032
Figure 30. France Embedded Discrete DRAM Revenue, (US$, Mn), 2020-2032
Figure 31. U.K. Embedded Discrete DRAM Revenue, (US$, Mn), 2020-2032
Figure 32. Italy Embedded Discrete DRAM Revenue, (US$, Mn), 2020-2032
Figure 33. Russia Embedded Discrete DRAM Revenue, (US$, Mn), 2020-2032
Figure 34. Nordic Countries Embedded Discrete DRAM Revenue, (US$, Mn), 2020-2032
Figure 35. Benelux Embedded Discrete DRAM Revenue, (US$, Mn), 2020-2032
Figure 36. By Region – Asia Embedded Discrete DRAM Revenue Market Share, 2020-2032
Figure 37. By Region – Asia Embedded Discrete DRAM Sales Market Share, 2020-2032
Figure 38. China Embedded Discrete DRAM Revenue, (US$, Mn), 2020-2032
Figure 39. Japan Embedded Discrete DRAM Revenue, (US$, Mn), 2020-2032
Figure 40. South Korea Embedded Discrete DRAM Revenue, (US$, Mn), 2020-2032
Figure 41. Southeast Asia Embedded Discrete DRAM Revenue, (US$, Mn), 2020-2032
Figure 42. India Embedded Discrete DRAM Revenue, (US$, Mn), 2020-2032
Figure 43. By Country – South America Embedded Discrete DRAM Revenue Market Share, 2020-2032
Figure 44. By Country – South America Embedded Discrete DRAM Sales, Market Share, 2020-2032
Figure 45. Brazil Embedded Discrete DRAM Revenue, (US$, Mn), 2020-2032
Figure 46. Argentina Embedded Discrete DRAM Revenue, (US$, Mn), 2020-2032
Figure 47. By Country – Middle East & Africa Embedded Discrete DRAM Revenue, Market Share, 2020-2032
Figure 48. By Country – Middle East & Africa Embedded Discrete DRAM Sales, Market Share, 2020-2032
Figure 49. Turkey Embedded Discrete DRAM Revenue, (US$, Mn), 2020-2032
Figure 50. Israel Embedded Discrete DRAM Revenue, (US$, Mn), 2020-2032
Figure 51. Saudi Arabia Embedded Discrete DRAM Revenue, (US$, Mn), 2020-2032
Figure 52. UAE Embedded Discrete DRAM Revenue, (US$, Mn), 2020-2032
Figure 53. Global Embedded Discrete DRAM Production Capacity (K Units), 2020-2032
Figure 54. The Percentage of Production Embedded Discrete DRAM by Region, 2024 VS 2032
Figure 55. Embedded Discrete DRAM Industry Value Chain
Figure 56. Marketing Channels