Electrostatic Chuck Market, Trends, Business Strategies 2025-2032

Electrostatic Chuck Market was valued at 1653 million in 2024 and is projected to reach US$ 2368 million by 2032, at a CAGR of 5.4% during the forecast period

PDF Icon Download Sample Report PDF
  • Quick Dispatch

    All Orders

  • Secure Payment

    100% Secure Payment

Price range: $1,500.00 through $4,250.00

Clear

MARKET INSIGHTS

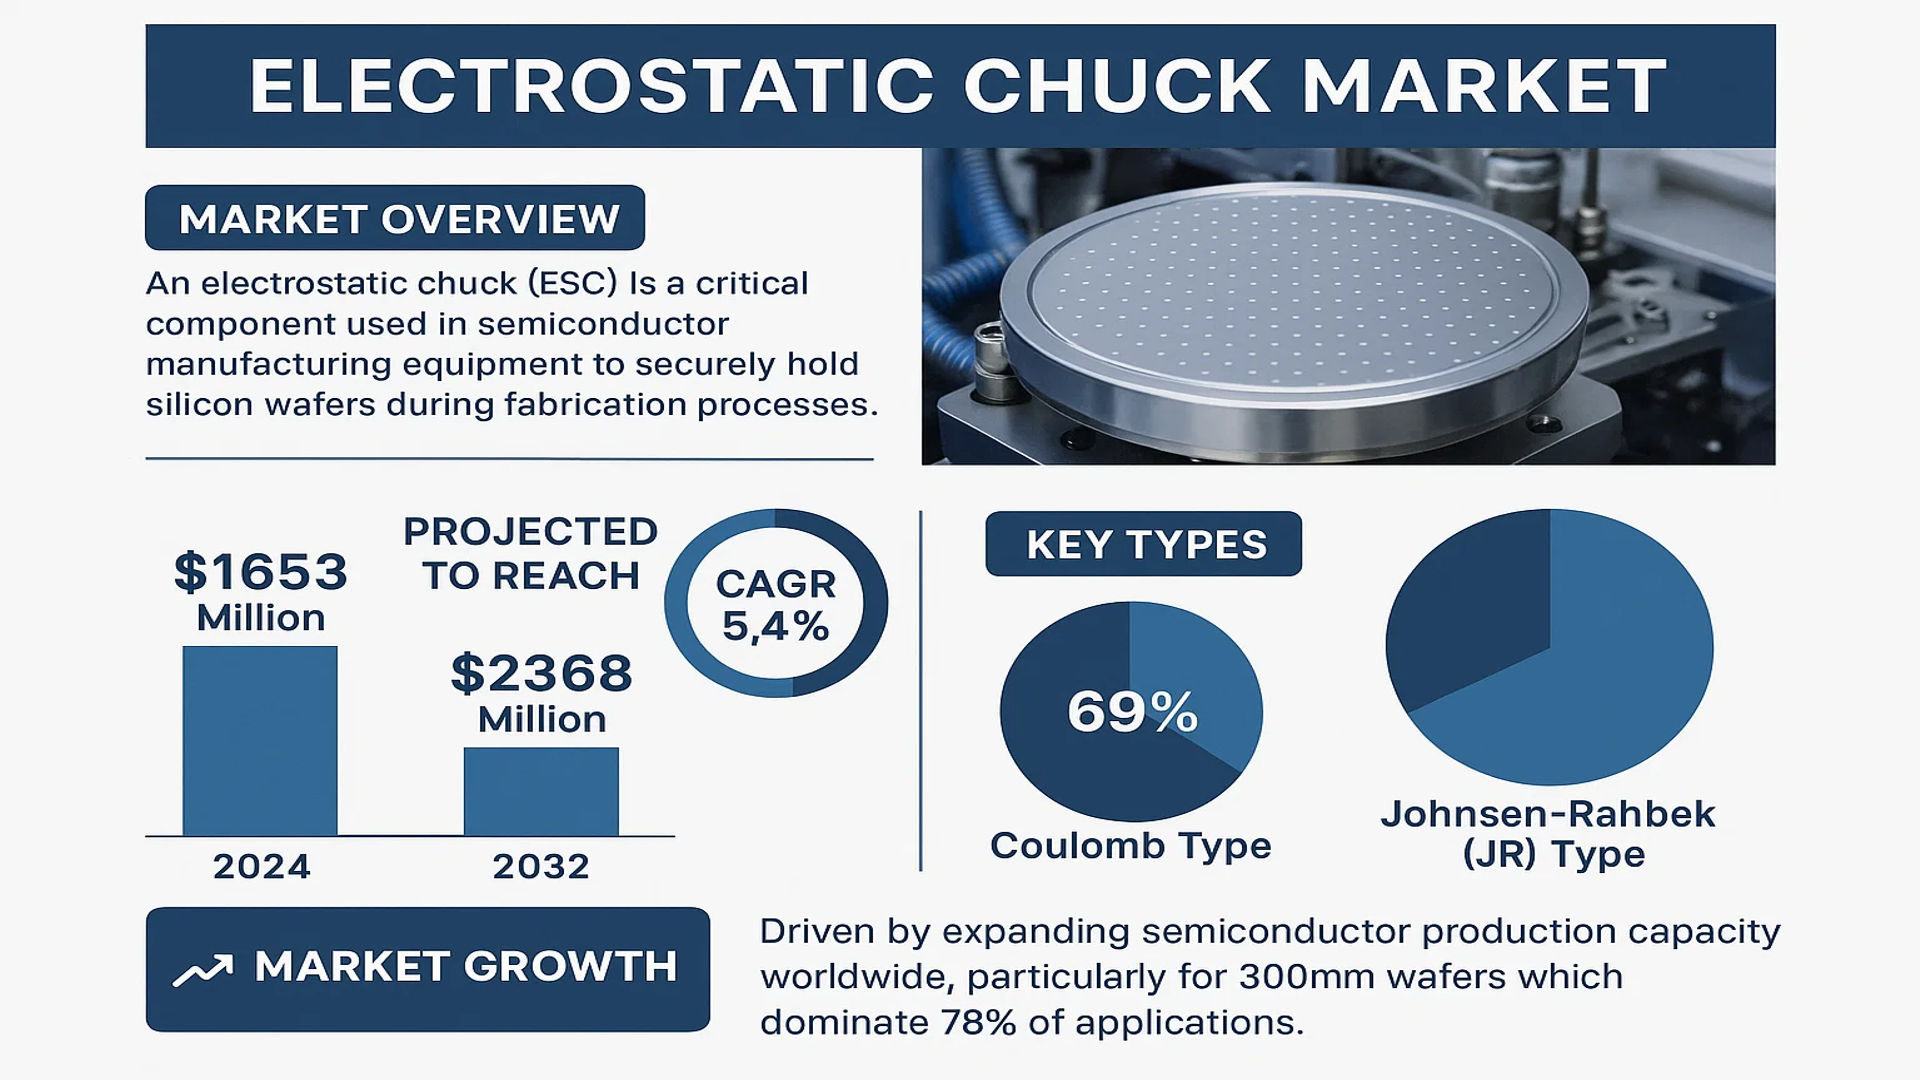
The global Electrostatic Chuck Market was valued at 1653 million in 2024 and is projected to reach US$ 2368 million by 2032, at a CAGR of 5.4% during the forecast period.

An electrostatic chuck (ESC) is a critical component used in semiconductor manufacturing equipment to securely hold silicon wafers during fabrication processes. These devices utilize electrostatic forces for wafer clamping, ensuring precision and stability in high-temperature and vacuum environments. The market primarily consists of two key types: Coulomb Type (holding 69% market share) and Johnsen-Rahbek (JR) Type.

The market growth is driven by expanding semiconductor production capacity worldwide, particularly for 300mm wafers which dominate 78% of applications. Asia Pacific leads regional demand with 75% market share, reflecting the concentration of semiconductor fabs in countries like Taiwan, South Korea, and China. Key industry players including Applied Materials, Lam Research, and SHINKO collectively control 93% of the market, leveraging their technological expertise in wafer processing equipment. Recent investments in advanced semiconductor nodes below 7nm are further propelling ESC adoption for improved thermal management and yield optimization.

Electrostatic Chuck Market

MARKET DYNAMICS

MARKET DRIVERS

Surge in Semiconductor Demand Fuels Adoption of Electrostatic Chucks

The global semiconductor industry is witnessing exponential growth, fueled by advances in IoT, AI, and 5G technologies. This has directly increased demand for electrostatic chucks (ESCs), critical components in wafer processing equipment. Semiconductor manufacturers are investing heavily in new fabrication facilities, with over 40 new fabs either under construction or planned worldwide through 2025. The 300mm wafer market, which accounts for 78% of ESC applications, continues to dominate as it offers better economies of scale for chipmakers. Leading manufacturers are developing advanced ESCs with enhanced thermal management and contamination control to meet the evolving needs of next-generation chip production.

Transition to Advanced Nodes Accelerates ESC Innovation

As semiconductor fabrication migrates to 5nm and below process nodes, the requirements for wafer handling precision have intensified significantly. ESCs play a crucial role in maintaining nanometer-level stability during complex processes like EUV lithography. The Coulomb-type segment, representing 69% of the market, is particularly benefiting from this trend due to its superior clamping force uniformity. Recent developments include ESCs with integrated heating elements that maintain temperature uniformity within ±0.5°C across 300mm wafers, a critical requirement for advanced patterning processes. This technological evolution is driving replacement cycles in existing fabs while becoming standard in new facilities.

Geopolitical Factors Reshaping Regional Supply Chains

Recent trade policies and supply chain concerns have accelerated semiconductor equipment investments in multiple regions. Asia Pacific accounts for 75% of global ESC demand, with government initiatives like China’s “Big Fund” and Japan’s semiconductor revitalization plan bolstering local production capabilities. The U.S. CHIPS Act is similarly driving North American investments, where ESC demand is projected to grow at above-average rates. These regional developments are prompting ESC suppliers to expand manufacturing footprints and establish strategic partnerships with local equipment manufacturers, creating new growth avenues.

MARKET RESTRAINTS

High Development Costs Create Barrier for New Market Entrants

The electrostatic chuck market faces significant entry barriers due to the specialized nature of its technology. Developing ESCs capable of meeting semiconductor industry specifications requires substantial R&D investment in materials science and precision engineering. The top five manufacturers hold a 93% market share, leveraging decades of accumulated process knowledge. New competitors must overcome challenges in ceramic material development, electrostatic field optimization, and contamination control – each requiring specialized expertise and multi-million-dollar investments. This concentration of technical know-how among established players makes market penetration difficult for newcomers.

Stringent Quality Requirements Increase Production Complexities

ESC manufacturers must adhere to exceptionally tight tolerances to meet semiconductor industry standards. Contamination levels must remain below 0.1 particles/cm², while dielectric materials must maintain consistent properties across thermal cycling. These requirements necessitate specialized manufacturing environments with class 100 cleanrooms and sophisticated metrology equipment. Furthermore, qualification processes for new ESC models often take 12-18 months as they undergo rigorous testing in customer production environments. Such extensive validation periods delay time-to-market and increase development costs, particularly for innovative designs attempting to push technical boundaries.

MARKET CHALLENGES

Materials Innovation Presents Technical Hurdles

ESC manufacturers face ongoing challenges in developing advanced materials capable of withstanding increasingly harsh semiconductor processes. The transition to high-power plasma etching and deposition processes requires dielectric materials that maintain stability at temperatures exceeding 500°C while resisting plasma erosion. Current alumina-based ceramics show limitations under these conditions, prompting research into novel composites. However, material innovations must balance performance with cost considerations – an optimization challenge that has slowed adoption of next-generation ESCs despite clear technical advantages.

Other Challenges

Supply Chain Vulnerabilities
The ESC market remains susceptible to disruptions in ceramic raw material supplies and precision component availability. Recent geopolitical tensions have spotlighted dependencies on specific regions for high-purity alumina and specialty metals used in ESC construction. Long lead times for critical components continue to impact production scheduling, forcing manufacturers to maintain higher inventory levels than historically typical for this industry.

Technical Support Requirements
As semiconductor nodes advance, ESC maintenance and troubleshooting require increasingly specialized knowledge. Semiconductor manufacturers report growing challenges in finding personnel capable of properly diagnosing ESC-related process issues, extending equipment downtime during maintenance events. This skills gap is particularly acute in emerging semiconductor regions building their first advanced fabs.

MARKET OPPORTUNITIES

Emerging Applications in Advanced Packaging Offer New Growth Avenues

The rapid growth of heterogeneous integration and 3D packaging technologies is creating new opportunities for specialized ESCs. Advanced packaging applications require modified chuck designs capable of handling thinner wafers and panels while maintaining precise thermal control. Equipment suppliers are developing ESCs optimized for packaging processes like hybrid bonding with clamping forces tailored to fragile structures. This segment represents one of the fastest-growing ESC applications, projected to increase at a compound annual growth rate nearly twice that of traditional front-end applications through the forecast period.

AI-Driven ESC Optimization Presents Untapped Potential

Artificial intelligence applications in semiconductor equipment maintenance are opening new possibilities for ESC performance enhancement. Predictive maintenance algorithms can analyze ESC performance data to forecast maintenance needs, potentially reducing unplanned downtime. Some manufacturers are exploring real-time adaptive clamping solutions that adjust electrostatic fields based on wafer warpage measurements. These innovations could significantly improve process yields while extending ESC service life, creating substantial value for semiconductor manufacturers.

ELECTROSTATIC CHUCK MARKET TRENDS

Semiconductor Industry Expansion Driving Demand for Electrostatic Chucks

The global electrostatic chuck market is expected to grow at a steady compound annual growth rate (CAGR) of 5.4% through 2032, fueled primarily by the semiconductor industry’s rapid expansion. With semiconductor manufacturing equipment installations increasing annually, the need for precision wafer handling solutions like electrostatic chucks continues to escalate. The Asia Pacific region dominates this market with approximately 75% share, reflecting the concentration of semiconductor fabrication plants in countries like Taiwan, South Korea, and China. This region’s strong position stems from both established semiconductor manufacturers and emerging players investing heavily in next-generation chip production facilities.

Other Trends

Shift Toward Larger Wafer Sizes

There is a notable industry transition toward 300mm wafer processing, which currently accounts for about 78% of the electrostatic chuck market by application. This shift is driven by semiconductor manufacturers’ pursuit of greater production efficiency and cost reductions per chip. While 200mm wafer capacity remains important for legacy devices, newer fabs overwhelmingly favor 300mm technology. This trend directly impacts electrostatic chuck design requirements, pushing manufacturers to develop larger surface area solutions with enhanced thermal management capabilities.

Technological Advancements in Chuck Design

Recent innovations focus on improving the performance and durability of electrostatic chucks, particularly for advanced semiconductor nodes. Manufacturers are developing next-generation Coulomb-type chucks (holding 69% market share) with improved dielectric materials and electrode configurations to handle the precision requirements of EUV lithography processes. Additionally, there’s growing investment in Johnsen-Rahbek type chucks for specialized applications requiring lower clamping voltages. The market is also seeing increased integration of advanced cooling systems to manage heat dissipation in high-power semiconductor manufacturing processes.

COMPETITIVE LANDSCAPE

Key Industry Players

Semiconductor Giants Dominate the Electrostatic Chuck Market with Advanced Technological Solutions

The global electrostatic chuck market exhibits a highly concentrated competitive landscape, dominated by a handful of semiconductor equipment manufacturers that collectively hold over 90% market share in 2024. Applied Materials and Lam Research emerge as clear market leaders, leveraging their extensive R&D capabilities and strategic partnerships with wafer fabrication plants across Asia, North America, and Europe. These companies benefit from vertically integrated manufacturing processes that allow them to maintain quality control while scaling production to meet soaring demand.

Japanese firms such as SHINKO, TOTO, and Sumitomo Osaka Cement have secured strong positions in the market through their specialization in precision ceramic components. Their expertise in Johnsen-Rahbek (JR) Type electrostatic chucks—particularly for applications requiring high thermal conductivity—has made them preferred suppliers for advanced logic and memory chip manufacturing. Meanwhile, Kyocera and NGK Insulators are gaining traction by offering durable, corrosion-resistant chuck solutions optimized for harsh semiconductor processing environments.

The market is witnessing intensified competition as second-tier players implement aggressive expansion strategies. Entegris recently acquired a smaller electrostatic chuck manufacturer to strengthen its portfolio, while Creative Technology Corporation secured multiple patents for next-generation chuck designs with enhanced wafer flatness control. Such developments indicate that technological differentiation—rather than pricing—will likely drive future market share gains.

List of Key Electrostatic Chuck Manufacturers

Segment Analysis:

By Type

Coulomb Type Segment Dominates Due to High Adoption in Advanced Semiconductor Manufacturing

The market is segmented based on type into:

  • Coulomb Type
    • Subtypes: Single-pole, Multi-pole, Bipolar Clamping
  • Johnsen-Rahbek (JR) Type

By Application

300 mm Wafer Segment Leads Due to Higher Demand in Cutting-Edge Semiconductor Fabrication

The market is segmented based on application into:

  • 300 mm Wafer
  • 200 mm Wafer
  • Others

By End User

Foundries Segment Dominates Owing to High-volume Semiconductor Production Needs

The market is segmented based on end user into:

  • Foundries
  • IDMs (Integrated Device Manufacturers)
  • Research Institutes

By Material

Ceramic Segment Leads Due to Superior Thermal and Electrical Properties

The market is segmented based on material into:

  • Ceramic
    • Subtypes: Alumina, AlN, Silicon Carbide
  • Composite

Regional Analysis: Electrostatic Chuck Market

Asia-Pacific
The Asia-Pacific region dominates the electrostatic chuck (ESC) market, commanding approximately 75% of global demand, with key contributions from semiconductor manufacturing hubs such as China, Japan, South Korea, and Taiwan. Rapid expansion of foundries, driven by the semiconductor boom and IoT adoption, fuels sustained demand for wafer-handling solutions. Major players like SHINKO, TOTO, and Sumitomo Osaka Cement benefit from localized production clusters. While China leads in volume, Japan and South Korea dominate in high-precision ESC technologies for advanced nodes (e.g., 5 nm and below). The region’s competitive cost structures and government subsidies for semiconductor self-sufficiency solidify its leadership.

North America
North America accounts for 19% of the global ESC market, primarily driven by U.S.-based semiconductor equipment giants Applied Materials and Lam Research, who integrate ESCs into their etching and deposition systems. The CHIPS and Science Act’s $52.7 billion allocation for domestic semiconductor R&D and manufacturing is accelerating facility expansions, directly benefiting ESC suppliers. However, labor costs and reliance on Asian supply chains for components pose challenges. Demand leans toward Coulomb-type ESCs (69% market share) for 300 mm wafer processing in logic and memory fabs.

Europe
Europe holds a 5% market share, with Germany and the Netherlands as key contributors due to specialty semiconductor applications (e.g., automotive and industrial sensors). EU initiatives like the European Chips Act aim to double Europe’s semiconductor share to 20% by 2030, but progress lags behind Asia. Local players face stiff competition from Asian imports, though niche demand for Johnsen-Rahbek (JR) ESCs in research institutions and legacy fabs persists. Environmental regulations also drive innovation in ESC materials to reduce perfluorocarbon (PFC) emissions.

South America
The market in South America remains nascent, with Brazil showing gradual growth due to investments in microelectronics education and small-scale fabrication. Limited local production and dependence on imports constrain adoption, but partnerships with Asian ESC manufacturers are emerging to serve regional automotive and medical device industries. Economic instability and underdeveloped supply chains hinder scalability, though the proximity to North American markets offers long-term potential for logistics optimization.

Middle East & Africa
This region is in the early stages of semiconductor infrastructure development, with Israel and the UAE leading in R&D-focused ESC applications (e.g., photonics and MEMS). While demand is minimal compared to other regions, strategic investments in tech hubs (e.g., Neom in Saudi Arabia) could spur future growth. High costs and a lack of localized expertise currently limit large-scale adoption, but collaborations with Entegris and Kyocera aim to bridge this gap through knowledge transfer.

Report Scope

This market research report provides a comprehensive analysis of the Global Electrostatic Chuck Market, covering the forecast period 2024–2032. It offers detailed insights into market dynamics, technological advancements, competitive landscape, and key trends shaping the industry.

Key focus areas of the report include:

  • Market Size & Forecast: Historical data and future projections for revenue, unit shipments, and market value across major regions and segments. The market was valued at USD 1,653 million in 2024 and is projected to reach USD 2,368 million by 2032, growing at a CAGR of 5.4%.
  • Segmentation Analysis: Detailed breakdown by product type (Coulomb Type, Johnsen-Rahbek Type), application (300 mm Wafer, 200 mm Wafer, Others), and end-user industry to identify high-growth segments and investment opportunities.
  • Regional Outlook: Insights into market performance across North America, Europe, Asia-Pacific, Latin America, and the Middle East & Africa. Asia-Pacific dominates with a 75% market share, followed by North America (19%) and Europe (5%).
  • Competitive Landscape: Profiles of leading market participants, including their product offerings, R&D focus, manufacturing capacity, pricing strategies, and recent developments. The top five players hold a 93% market share.
  • Technology Trends & Innovation: Assessment of emerging technologies, semiconductor design trends, fabrication techniques, and evolving industry standards in wafer handling and processing.
  • Market Drivers & Restraints: Evaluation of factors driving market growth (increasing semiconductor demand, IoT adoption) along with challenges (supply chain constraints, high R&D costs).
  • Stakeholder Analysis: Insights for component suppliers, OEMs, system integrators, investors, and policymakers regarding the evolving semiconductor equipment ecosystem and strategic opportunities.

Primary and secondary research methods are employed, including interviews with industry experts, data from verified sources, and real-time market intelligence to ensure the accuracy and reliability of the insights presented.

FREQUENTLY ASKED QUESTIONS:

What is the current market size of Global Electrostatic Chuck Market?

-> Electrostatic Chuck Market was valued at 1653 million in 2024 and is projected to reach US$ 2368 million by 2032, at a CAGR of 5.4% during the forecast period.

Which key companies operate in Global Electrostatic Chuck Market?

-> Key players include Applied Materials, Lam Research, SHINKO, TOTO, Sumitomo Osaka Cement, Creative Technology Corporation, Kyocera, and Entegris, among others.

What are the key growth drivers?

-> Key growth drivers include rising semiconductor demand, increasing wafer sizes (300mm adoption), and growth in IoT and AI applications.

Which region dominates the market?

-> Asia-Pacific is the largest market with 75% share, driven by semiconductor manufacturing hubs in China, Japan, South Korea, and Taiwan.

What are the emerging trends?

-> Emerging trends include development of next-generation chucks for advanced nodes, integration of smart monitoring systems, and materials innovation for improved thermal management.

Electrostatic Chuck Market, Trends, Business Strategies 2025-2032

Get Sample Report PDF for Exclusive Insights

Report Sample Includes

  • Table of Contents
  • List of Tables & Figures
  • Charts, Research Methodology, and more...
PDF Icon Download Sample Report PDF

Download Sample Report

Table of Content

1 Introduction to Research & Analysis Reports
1.1 Electrostatic Chuck Market Definition
1.2 Market Segments
1.2.1 Segment by Type
1.2.2 Segment by Application
1.3 Global Electrostatic Chuck Market Overview
1.4 Features & Benefits of This Report
1.5 Methodology & Sources of Information
1.5.1 Research Methodology
1.5.2 Research Process
1.5.3 Base Year
1.5.4 Report Assumptions & Caveats
2 Global Electrostatic Chuck Overall Market Size
2.1 Global Electrostatic Chuck Market Size: 2024 VS 2032
2.2 Global Electrostatic Chuck Market Size, Prospects & Forecasts: 2020-2032
2.3 Global Electrostatic Chuck Sales: 2020-2032
3 Company Landscape
3.1 Top Electrostatic Chuck Players in Global Market
3.2 Top Global Electrostatic Chuck Companies Ranked by Revenue
3.3 Global Electrostatic Chuck Revenue by Companies
3.4 Global Electrostatic Chuck Sales by Companies
3.5 Global Electrostatic Chuck Price by Manufacturer (2020-2025)
3.6 Top 3 and Top 5 Electrostatic Chuck Companies in Global Market, by Revenue in 2024
3.7 Global Manufacturers Electrostatic Chuck Product Type
3.8 Tier 1, Tier 2, and Tier 3 Electrostatic Chuck Players in Global Market
3.8.1 List of Global Tier 1 Electrostatic Chuck Companies
3.8.2 List of Global Tier 2 and Tier 3 Electrostatic Chuck Companies
4 Sights by Product
4.1 Overview
4.1.1 Segment by Type – Global Electrostatic Chuck Market Size Markets, 2024 & 2032
4.1.2 Coulomb Type
4.1.3 Johnsen-Rahbek (JR) Type
4.2 Segment by Type – Global Electrostatic Chuck Revenue & Forecasts
4.2.1 Segment by Type – Global Electrostatic Chuck Revenue, 2020-2025
4.2.2 Segment by Type – Global Electrostatic Chuck Revenue, 2026-2032
4.2.3 Segment by Type – Global Electrostatic Chuck Revenue Market Share, 2020-2032
4.3 Segment by Type – Global Electrostatic Chuck Sales & Forecasts
4.3.1 Segment by Type – Global Electrostatic Chuck Sales, 2020-2025
4.3.2 Segment by Type – Global Electrostatic Chuck Sales, 2026-2032
4.3.3 Segment by Type – Global Electrostatic Chuck Sales Market Share, 2020-2032
4.4 Segment by Type – Global Electrostatic Chuck Price (Manufacturers Selling Prices), 2020-2032
5 Sights by Application
5.1 Overview
5.1.1 Segment by Application – Global Electrostatic Chuck Market Size, 2024 & 2032
5.1.2 300 mm Wafer
5.1.3 200 mm Wafer
5.1.4 Others
5.2 Segment by Application – Global Electrostatic Chuck Revenue & Forecasts
5.2.1 Segment by Application – Global Electrostatic Chuck Revenue, 2020-2025
5.2.2 Segment by Application – Global Electrostatic Chuck Revenue, 2026-2032
5.2.3 Segment by Application – Global Electrostatic Chuck Revenue Market Share, 2020-2032
5.3 Segment by Application – Global Electrostatic Chuck Sales & Forecasts
5.3.1 Segment by Application – Global Electrostatic Chuck Sales, 2020-2025
5.3.2 Segment by Application – Global Electrostatic Chuck Sales, 2026-2032
5.3.3 Segment by Application – Global Electrostatic Chuck Sales Market Share, 2020-2032
5.4 Segment by Application – Global Electrostatic Chuck Price (Manufacturers Selling Prices), 2020-2032
6 Sights by Region
6.1 By Region – Global Electrostatic Chuck Market Size, 2024 & 2032
6.2 By Region – Global Electrostatic Chuck Revenue & Forecasts
6.2.1 By Region – Global Electrostatic Chuck Revenue, 2020-2025
6.2.2 By Region – Global Electrostatic Chuck Revenue, 2026-2032
6.2.3 By Region – Global Electrostatic Chuck Revenue Market Share, 2020-2032
6.3 By Region – Global Electrostatic Chuck Sales & Forecasts
6.3.1 By Region – Global Electrostatic Chuck Sales, 2020-2025
6.3.2 By Region – Global Electrostatic Chuck Sales, 2026-2032
6.3.3 By Region – Global Electrostatic Chuck Sales Market Share, 2020-2032
6.4 North America
6.4.1 By Country – North America Electrostatic Chuck Revenue, 2020-2032
6.4.2 By Country – North America Electrostatic Chuck Sales, 2020-2032
6.4.3 United States Electrostatic Chuck Market Size, 2020-2032
6.4.4 Canada Electrostatic Chuck Market Size, 2020-2032
6.4.5 Mexico Electrostatic Chuck Market Size, 2020-2032
6.5 Europe
6.5.1 By Country – Europe Electrostatic Chuck Revenue, 2020-2032
6.5.2 By Country – Europe Electrostatic Chuck Sales, 2020-2032
6.5.3 Germany Electrostatic Chuck Market Size, 2020-2032
6.5.4 France Electrostatic Chuck Market Size, 2020-2032
6.5.5 U.K. Electrostatic Chuck Market Size, 2020-2032
6.5.6 Italy Electrostatic Chuck Market Size, 2020-2032
6.5.7 Russia Electrostatic Chuck Market Size, 2020-2032
6.5.8 Nordic Countries Electrostatic Chuck Market Size, 2020-2032
6.5.9 Benelux Electrostatic Chuck Market Size, 2020-2032
6.6 Asia
6.6.1 By Region – Asia Electrostatic Chuck Revenue, 2020-2032
6.6.2 By Region – Asia Electrostatic Chuck Sales, 2020-2032
6.6.3 China Electrostatic Chuck Market Size, 2020-2032
6.6.4 Japan Electrostatic Chuck Market Size, 2020-2032
6.6.5 South Korea Electrostatic Chuck Market Size, 2020-2032
6.6.6 Southeast Asia Electrostatic Chuck Market Size, 2020-2032
6.6.7 India Electrostatic Chuck Market Size, 2020-2032
6.7 South America
6.7.1 By Country – South America Electrostatic Chuck Revenue, 2020-2032
6.7.2 By Country – South America Electrostatic Chuck Sales, 2020-2032
6.7.3 Brazil Electrostatic Chuck Market Size, 2020-2032
6.7.4 Argentina Electrostatic Chuck Market Size, 2020-2032
6.8 Middle East & Africa
6.8.1 By Country – Middle East & Africa Electrostatic Chuck Revenue, 2020-2032
6.8.2 By Country – Middle East & Africa Electrostatic Chuck Sales, 2020-2032
6.8.3 Turkey Electrostatic Chuck Market Size, 2020-2032
6.8.4 Israel Electrostatic Chuck Market Size, 2020-2032
6.8.5 Saudi Arabia Electrostatic Chuck Market Size, 2020-2032
6.8.6 UAE Electrostatic Chuck Market Size, 2020-2032
7 Manufacturers & Brands Profiles
7.1 Applied Materials
7.1.1 Applied Materials Company Summary
7.1.2 Applied Materials Business Overview
7.1.3 Applied Materials Electrostatic Chuck Major Product Offerings
7.1.4 Applied Materials Electrostatic Chuck Sales and Revenue in Global (2020-2025)
7.1.5 Applied Materials Key News & Latest Developments
7.2 Lam Research
7.2.1 Lam Research Company Summary
7.2.2 Lam Research Business Overview
7.2.3 Lam Research Electrostatic Chuck Major Product Offerings
7.2.4 Lam Research Electrostatic Chuck Sales and Revenue in Global (2020-2025)
7.2.5 Lam Research Key News & Latest Developments
7.3 SHINKO
7.3.1 SHINKO Company Summary
7.3.2 SHINKO Business Overview
7.3.3 SHINKO Electrostatic Chuck Major Product Offerings
7.3.4 SHINKO Electrostatic Chuck Sales and Revenue in Global (2020-2025)
7.3.5 SHINKO Key News & Latest Developments
7.4 TOTO
7.4.1 TOTO Company Summary
7.4.2 TOTO Business Overview
7.4.3 TOTO Electrostatic Chuck Major Product Offerings
7.4.4 TOTO Electrostatic Chuck Sales and Revenue in Global (2020-2025)
7.4.5 TOTO Key News & Latest Developments
7.5 Sumitomo Osaka Cement
7.5.1 Sumitomo Osaka Cement Company Summary
7.5.2 Sumitomo Osaka Cement Business Overview
7.5.3 Sumitomo Osaka Cement Electrostatic Chuck Major Product Offerings
7.5.4 Sumitomo Osaka Cement Electrostatic Chuck Sales and Revenue in Global (2020-2025)
7.5.5 Sumitomo Osaka Cement Key News & Latest Developments
7.6 Creative Technology Corporation
7.6.1 Creative Technology Corporation Company Summary
7.6.2 Creative Technology Corporation Business Overview
7.6.3 Creative Technology Corporation Electrostatic Chuck Major Product Offerings
7.6.4 Creative Technology Corporation Electrostatic Chuck Sales and Revenue in Global (2020-2025)
7.6.5 Creative Technology Corporation Key News & Latest Developments
7.7 Kyocera
7.7.1 Kyocera Company Summary
7.7.2 Kyocera Business Overview
7.7.3 Kyocera Electrostatic Chuck Major Product Offerings
7.7.4 Kyocera Electrostatic Chuck Sales and Revenue in Global (2020-2025)
7.7.5 Kyocera Key News & Latest Developments
7.8 Entegris
7.8.1 Entegris Company Summary
7.8.2 Entegris Business Overview
7.8.3 Entegris Electrostatic Chuck Major Product Offerings
7.8.4 Entegris Electrostatic Chuck Sales and Revenue in Global (2020-2025)
7.8.5 Entegris Key News & Latest Developments
7.9 NTK CERATEC
7.9.1 NTK CERATEC Company Summary
7.9.2 NTK CERATEC Business Overview
7.9.3 NTK CERATEC Electrostatic Chuck Major Product Offerings
7.9.4 NTK CERATEC Electrostatic Chuck Sales and Revenue in Global (2020-2025)
7.9.5 NTK CERATEC Key News & Latest Developments
7.10 II-VI M Cubed
7.10.1 II-VI M Cubed Company Summary
7.10.2 II-VI M Cubed Business Overview
7.10.3 II-VI M Cubed Electrostatic Chuck Major Product Offerings
7.10.4 II-VI M Cubed Electrostatic Chuck Sales and Revenue in Global (2020-2025)
7.10.5 II-VI M Cubed Key News & Latest Developments
7.11 Tsukuba Seiko
7.11.1 Tsukuba Seiko Company Summary
7.11.2 Tsukuba Seiko Business Overview
7.11.3 Tsukuba Seiko Electrostatic Chuck Major Product Offerings
7.11.4 Tsukuba Seiko Electrostatic Chuck Sales and Revenue in Global (2020-2025)
7.11.5 Tsukuba Seiko Key News & Latest Developments
7.12 Calitech
7.12.1 Calitech Company Summary
7.12.2 Calitech Business Overview
7.12.3 Calitech Electrostatic Chuck Major Product Offerings
7.12.4 Calitech Electrostatic Chuck Sales and Revenue in Global (2020-2025)
7.12.5 Calitech Key News & Latest Developments
7.13 Beijing U-PRECISION TECH
7.13.1 Beijing U-PRECISION TECH Company Summary
7.13.2 Beijing U-PRECISION TECH Business Overview
7.13.3 Beijing U-PRECISION TECH Electrostatic Chuck Major Product Offerings
7.13.4 Beijing U-PRECISION TECH Electrostatic Chuck Sales and Revenue in Global (2020-2025)
7.13.5 Beijing U-PRECISION TECH Key News & Latest Developments
7.14 NGK Insulators
7.14.1 NGK Insulators Company Summary
7.14.2 NGK Insulators Business Overview
7.14.3 NGK Insulators Electrostatic Chuck Major Product Offerings
7.14.4 NGK Insulators Electrostatic Chuck Sales and Revenue in Global (2020-2025)
7.14.5 NGK Insulators Key News & Latest Developments
8 Global Electrostatic Chuck Production Capacity, Analysis
8.1 Global Electrostatic Chuck Production Capacity, 2020-2032
8.2 Electrostatic Chuck Production Capacity of Key Manufacturers in Global Market
8.3 Global Electrostatic Chuck Production by Region
9 Key Market Trends, Opportunity, Drivers and Restraints
9.1 Market Opportunities & Trends
9.2 Market Drivers
9.3 Market Restraints
10 Electrostatic Chuck Supply Chain Analysis
10.1 Electrostatic Chuck Industry Value Chain
10.2 Electrostatic Chuck Upstream Market
10.3 Electrostatic Chuck Downstream and Clients
10.4 Marketing Channels Analysis
10.4.1 Marketing Channels
10.4.2 Electrostatic Chuck Distributors and Sales Agents in Global
11 Conclusion
12 Appendix
12.1 Note
12.2 Examples of Clients
12.3 DisclaimerList of Tables
Table 1. Key Players of Electrostatic Chuck in Global Market
Table 2. Top Electrostatic Chuck Players in Global Market, Ranking by Revenue (2024)
Table 3. Global Electrostatic Chuck Revenue by Companies, (US$, Mn), 2020-2025
Table 4. Global Electrostatic Chuck Revenue Share by Companies, 2020-2025
Table 5. Global Electrostatic Chuck Sales by Companies, (Units), 2020-2025
Table 6. Global Electrostatic Chuck Sales Share by Companies, 2020-2025
Table 7. Key Manufacturers Electrostatic Chuck Price (2020-2025) & (US$/Unit)
Table 8. Global Manufacturers Electrostatic Chuck Product Type
Table 9. List of Global Tier 1 Electrostatic Chuck Companies, Revenue (US$, Mn) in 2024 and Market Share
Table 10. List of Global Tier 2 and Tier 3 Electrostatic Chuck Companies, Revenue (US$, Mn) in 2024 and Market Share
Table 11. Segment by Type – Global Electrostatic Chuck Revenue, (US$, Mn), 2024 & 2032
Table 12. Segment by Type – Global Electrostatic Chuck Revenue (US$, Mn), 2020-2025
Table 13. Segment by Type – Global Electrostatic Chuck Revenue (US$, Mn), 2026-2032
Table 14. Segment by Type – Global Electrostatic Chuck Sales (Units), 2020-2025
Table 15. Segment by Type – Global Electrostatic Chuck Sales (Units), 2026-2032
Table 16. Segment by Application – Global Electrostatic Chuck Revenue, (US$, Mn), 2024 & 2032
Table 17. Segment by Application – Global Electrostatic Chuck Revenue, (US$, Mn), 2020-2025
Table 18. Segment by Application – Global Electrostatic Chuck Revenue, (US$, Mn), 2026-2032
Table 19. Segment by Application – Global Electrostatic Chuck Sales, (Units), 2020-2025
Table 20. Segment by Application – Global Electrostatic Chuck Sales, (Units), 2026-2032
Table 21. By Region – Global Electrostatic Chuck Revenue, (US$, Mn), 2025-2032
Table 22. By Region – Global Electrostatic Chuck Revenue, (US$, Mn), 2020-2025
Table 23. By Region – Global Electrostatic Chuck Revenue, (US$, Mn), 2026-2032
Table 24. By Region – Global Electrostatic Chuck Sales, (Units), 2020-2025
Table 25. By Region – Global Electrostatic Chuck Sales, (Units), 2026-2032
Table 26. By Country – North America Electrostatic Chuck Revenue, (US$, Mn), 2020-2025
Table 27. By Country – North America Electrostatic Chuck Revenue, (US$, Mn), 2026-2032
Table 28. By Country – North America Electrostatic Chuck Sales, (Units), 2020-2025
Table 29. By Country – North America Electrostatic Chuck Sales, (Units), 2026-2032
Table 30. By Country – Europe Electrostatic Chuck Revenue, (US$, Mn), 2020-2025
Table 31. By Country – Europe Electrostatic Chuck Revenue, (US$, Mn), 2026-2032
Table 32. By Country – Europe Electrostatic Chuck Sales, (Units), 2020-2025
Table 33. By Country – Europe Electrostatic Chuck Sales, (Units), 2026-2032
Table 34. By Region – Asia Electrostatic Chuck Revenue, (US$, Mn), 2020-2025
Table 35. By Region – Asia Electrostatic Chuck Revenue, (US$, Mn), 2026-2032
Table 36. By Region – Asia Electrostatic Chuck Sales, (Units), 2020-2025
Table 37. By Region – Asia Electrostatic Chuck Sales, (Units), 2026-2032
Table 38. By Country – South America Electrostatic Chuck Revenue, (US$, Mn), 2020-2025
Table 39. By Country – South America Electrostatic Chuck Revenue, (US$, Mn), 2026-2032
Table 40. By Country – South America Electrostatic Chuck Sales, (Units), 2020-2025
Table 41. By Country – South America Electrostatic Chuck Sales, (Units), 2026-2032
Table 42. By Country – Middle East & Africa Electrostatic Chuck Revenue, (US$, Mn), 2020-2025
Table 43. By Country – Middle East & Africa Electrostatic Chuck Revenue, (US$, Mn), 2026-2032
Table 44. By Country – Middle East & Africa Electrostatic Chuck Sales, (Units), 2020-2025
Table 45. By Country – Middle East & Africa Electrostatic Chuck Sales, (Units), 2026-2032
Table 46. Applied Materials Company Summary
Table 47. Applied Materials Electrostatic Chuck Product Offerings
Table 48. Applied Materials Electrostatic Chuck Sales (Units), Revenue (US$, Mn) and Average Price (US$/Unit) & (2020-2025)
Table 49. Applied Materials Key News & Latest Developments
Table 50. Lam Research Company Summary
Table 51. Lam Research Electrostatic Chuck Product Offerings
Table 52. Lam Research Electrostatic Chuck Sales (Units), Revenue (US$, Mn) and Average Price (US$/Unit) & (2020-2025)
Table 53. Lam Research Key News & Latest Developments
Table 54. SHINKO Company Summary
Table 55. SHINKO Electrostatic Chuck Product Offerings
Table 56. SHINKO Electrostatic Chuck Sales (Units), Revenue (US$, Mn) and Average Price (US$/Unit) & (2020-2025)
Table 57. SHINKO Key News & Latest Developments
Table 58. TOTO Company Summary
Table 59. TOTO Electrostatic Chuck Product Offerings
Table 60. TOTO Electrostatic Chuck Sales (Units), Revenue (US$, Mn) and Average Price (US$/Unit) & (2020-2025)
Table 61. TOTO Key News & Latest Developments
Table 62. Sumitomo Osaka Cement Company Summary
Table 63. Sumitomo Osaka Cement Electrostatic Chuck Product Offerings
Table 64. Sumitomo Osaka Cement Electrostatic Chuck Sales (Units), Revenue (US$, Mn) and Average Price (US$/Unit) & (2020-2025)
Table 65. Sumitomo Osaka Cement Key News & Latest Developments
Table 66. Creative Technology Corporation Company Summary
Table 67. Creative Technology Corporation Electrostatic Chuck Product Offerings
Table 68. Creative Technology Corporation Electrostatic Chuck Sales (Units), Revenue (US$, Mn) and Average Price (US$/Unit) & (2020-2025)
Table 69. Creative Technology Corporation Key News & Latest Developments
Table 70. Kyocera Company Summary
Table 71. Kyocera Electrostatic Chuck Product Offerings
Table 72. Kyocera Electrostatic Chuck Sales (Units), Revenue (US$, Mn) and Average Price (US$/Unit) & (2020-2025)
Table 73. Kyocera Key News & Latest Developments
Table 74. Entegris Company Summary
Table 75. Entegris Electrostatic Chuck Product Offerings
Table 76. Entegris Electrostatic Chuck Sales (Units), Revenue (US$, Mn) and Average Price (US$/Unit) & (2020-2025)
Table 77. Entegris Key News & Latest Developments
Table 78. NTK CERATEC Company Summary
Table 79. NTK CERATEC Electrostatic Chuck Product Offerings
Table 80. NTK CERATEC Electrostatic Chuck Sales (Units), Revenue (US$, Mn) and Average Price (US$/Unit) & (2020-2025)
Table 81. NTK CERATEC Key News & Latest Developments
Table 82. II-VI M Cubed Company Summary
Table 83. II-VI M Cubed Electrostatic Chuck Product Offerings
Table 84. II-VI M Cubed Electrostatic Chuck Sales (Units), Revenue (US$, Mn) and Average Price (US$/Unit) & (2020-2025)
Table 85. II-VI M Cubed Key News & Latest Developments
Table 86. Tsukuba Seiko Company Summary
Table 87. Tsukuba Seiko Electrostatic Chuck Product Offerings
Table 88. Tsukuba Seiko Electrostatic Chuck Sales (Units), Revenue (US$, Mn) and Average Price (US$/Unit) & (2020-2025)
Table 89. Tsukuba Seiko Key News & Latest Developments
Table 90. Calitech Company Summary
Table 91. Calitech Electrostatic Chuck Product Offerings
Table 92. Calitech Electrostatic Chuck Sales (Units), Revenue (US$, Mn) and Average Price (US$/Unit) & (2020-2025)
Table 93. Calitech Key News & Latest Developments
Table 94. Beijing U-PRECISION TECH Company Summary
Table 95. Beijing U-PRECISION TECH Electrostatic Chuck Product Offerings
Table 96. Beijing U-PRECISION TECH Electrostatic Chuck Sales (Units), Revenue (US$, Mn) and Average Price (US$/Unit) & (2020-2025)
Table 97. Beijing U-PRECISION TECH Key News & Latest Developments
Table 98. NGK Insulators Company Summary
Table 99. NGK Insulators Electrostatic Chuck Product Offerings
Table 100. NGK Insulators Electrostatic Chuck Sales (Units), Revenue (US$, Mn) and Average Price (US$/Unit) & (2020-2025)
Table 101. NGK Insulators Key News & Latest Developments
Table 102. Electrostatic Chuck Capacity of Key Manufacturers in Global Market, 2023-2025 (Units)
Table 103. Global Electrostatic Chuck Capacity Market Share of Key Manufacturers, 2023-2025
Table 104. Global Electrostatic Chuck Production by Region, 2020-2025 (Units)
Table 105. Global Electrostatic Chuck Production by Region, 2026-2032 (Units)
Table 106. Electrostatic Chuck Market Opportunities & Trends in Global Market
Table 107. Electrostatic Chuck Market Drivers in Global Market
Table 108. Electrostatic Chuck Market Restraints in Global Market
Table 109. Electrostatic Chuck Raw Materials
Table 110. Electrostatic Chuck Raw Materials Suppliers in Global Market
Table 111. Typical Electrostatic Chuck Downstream
Table 112. Electrostatic Chuck Downstream Clients in Global Market
Table 113. Electrostatic Chuck Distributors and Sales Agents in Global Market

List of Figures
Figure 1. Electrostatic Chuck Product Picture
Figure 2. Electrostatic Chuck Segment by Type in 2024
Figure 3. Electrostatic Chuck Segment by Application in 2024
Figure 4. Global Electrostatic Chuck Market Overview: 2024
Figure 5. Key Caveats
Figure 6. Global Electrostatic Chuck Market Size: 2024 VS 2032 (US$, Mn)
Figure 7. Global Electrostatic Chuck Revenue: 2020-2032 (US$, Mn)
Figure 8. Electrostatic Chuck Sales in Global Market: 2020-2032 (Units)
Figure 9. The Top 3 and 5 Players Market Share by Electrostatic Chuck Revenue in 2024
Figure 10. Segment by Type – Global Electrostatic Chuck Revenue, (US$, Mn), 2024 & 2032
Figure 11. Segment by Type – Global Electrostatic Chuck Revenue Market Share, 2020-2032
Figure 12. Segment by Type – Global Electrostatic Chuck Sales Market Share, 2020-2032
Figure 13. Segment by Type – Global Electrostatic Chuck Price (US$/Unit), 2020-2032
Figure 14. Segment by Application – Global Electrostatic Chuck Revenue, (US$, Mn), 2024 & 2032
Figure 15. Segment by Application – Global Electrostatic Chuck Revenue Market Share, 2020-2032
Figure 16. Segment by Application – Global Electrostatic Chuck Sales Market Share, 2020-2032
Figure 17. Segment by Application -Global Electrostatic Chuck Price (US$/Unit), 2020-2032
Figure 18. By Region – Global Electrostatic Chuck Revenue, (US$, Mn), 2025 & 2032
Figure 19. By Region – Global Electrostatic Chuck Revenue Market Share, 2020 VS 2024 VS 2032
Figure 20. By Region – Global Electrostatic Chuck Revenue Market Share, 2020-2032
Figure 21. By Region – Global Electrostatic Chuck Sales Market Share, 2020-2032
Figure 22. By Country – North America Electrostatic Chuck Revenue Market Share, 2020-2032
Figure 23. By Country – North America Electrostatic Chuck Sales Market Share, 2020-2032
Figure 24. United States Electrostatic Chuck Revenue, (US$, Mn), 2020-2032
Figure 25. Canada Electrostatic Chuck Revenue, (US$, Mn), 2020-2032
Figure 26. Mexico Electrostatic Chuck Revenue, (US$, Mn), 2020-2032
Figure 27. By Country – Europe Electrostatic Chuck Revenue Market Share, 2020-2032
Figure 28. By Country – Europe Electrostatic Chuck Sales Market Share, 2020-2032
Figure 29. Germany Electrostatic Chuck Revenue, (US$, Mn), 2020-2032
Figure 30. France Electrostatic Chuck Revenue, (US$, Mn), 2020-2032
Figure 31. U.K. Electrostatic Chuck Revenue, (US$, Mn), 2020-2032
Figure 32. Italy Electrostatic Chuck Revenue, (US$, Mn), 2020-2032
Figure 33. Russia Electrostatic Chuck Revenue, (US$, Mn), 2020-2032
Figure 34. Nordic Countries Electrostatic Chuck Revenue, (US$, Mn), 2020-2032
Figure 35. Benelux Electrostatic Chuck Revenue, (US$, Mn), 2020-2032
Figure 36. By Region – Asia Electrostatic Chuck Revenue Market Share, 2020-2032
Figure 37. By Region – Asia Electrostatic Chuck Sales Market Share, 2020-2032
Figure 38. China Electrostatic Chuck Revenue, (US$, Mn), 2020-2032
Figure 39. Japan Electrostatic Chuck Revenue, (US$, Mn), 2020-2032
Figure 40. South Korea Electrostatic Chuck Revenue, (US$, Mn), 2020-2032
Figure 41. Southeast Asia Electrostatic Chuck Revenue, (US$, Mn), 2020-2032
Figure 42. India Electrostatic Chuck Revenue, (US$, Mn), 2020-2032
Figure 43. By Country – South America Electrostatic Chuck Revenue Market Share, 2020-2032
Figure 44. By Country – South America Electrostatic Chuck Sales, Market Share, 2020-2032
Figure 45. Brazil Electrostatic Chuck Revenue, (US$, Mn), 2020-2032
Figure 46. Argentina Electrostatic Chuck Revenue, (US$, Mn), 2020-2032
Figure 47. By Country – Middle East & Africa Electrostatic Chuck Revenue, Market Share, 2020-2032
Figure 48. By Country – Middle East & Africa Electrostatic Chuck Sales, Market Share, 2020-2032
Figure 49. Turkey Electrostatic Chuck Revenue, (US$, Mn), 2020-2032
Figure 50. Israel Electrostatic Chuck Revenue, (US$, Mn), 2020-2032
Figure 51. Saudi Arabia Electrostatic Chuck Revenue, (US$, Mn), 2020-2032
Figure 52. UAE Electrostatic Chuck Revenue, (US$, Mn), 2020-2032
Figure 53. Global Electrostatic Chuck Production Capacity (Units), 2020-2032
Figure 54. The Percentage of Production Electrostatic Chuck by Region, 2024 VS 2032
Figure 55. Electrostatic Chuck Industry Value Chain
Figure 56. Marketing Channels