Electronic Parts Carrier Tape Market, Trends, Business Strategies 2026-2034

Global Electronic Parts Carrier Tape Market was valued at USD 248 million in 2025 and is expected to reach USD 349 million by 2034, at a CAGR of 5.1% during the forecast period

PDF Icon Download Sample Report PDF
  • Quick Dispatch

    All Orders

  • Secure Payment

    100% Secure Payment

Price range: $1,500.00 through $4,250.00

Clear

Electronic Parts Carrier Tape Market Insights

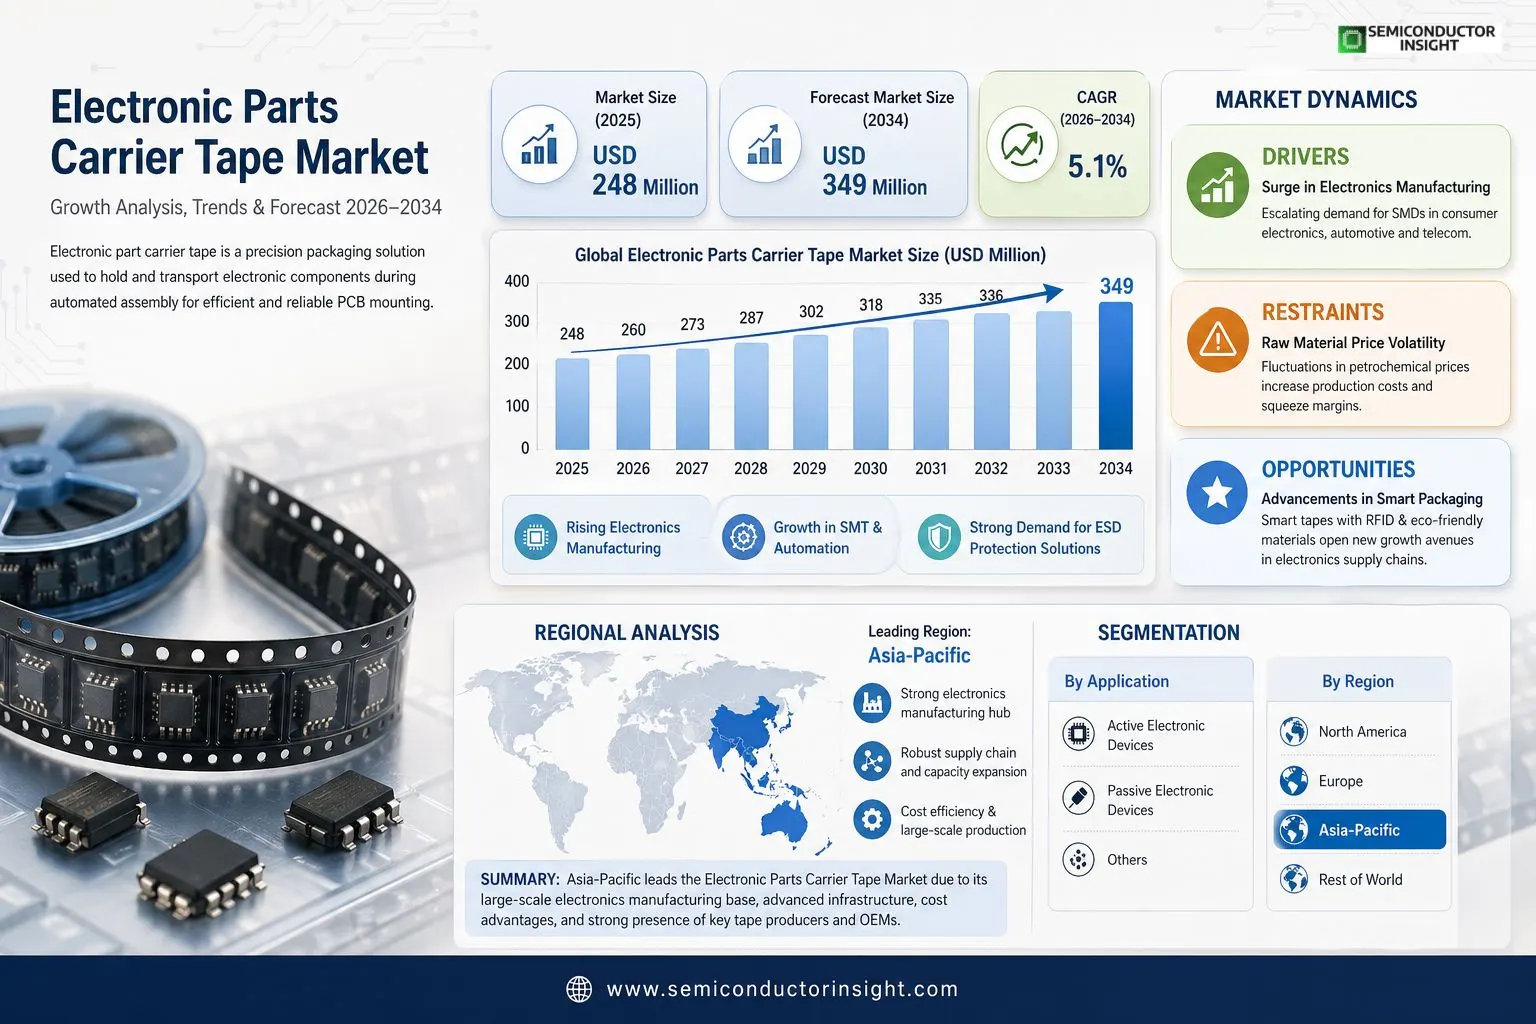
Global Electronic Parts Carrier Tape market size was valued at USD 248 million in 2025. The market is projected to reach USD 349 million by 2034, exhibiting a CAGR of 5.1% during the forecast period.

Electronic component carrier tape is a strip product used in the field of electronics and packaging. It features a specific thickness with evenly distributed pockets for holding electronic components and positioning holes for precise indexing. During mounting, the cover tape is peeled away, allowing automated equipment to extract components from the pockets via index hole alignment and place them onto printed circuit boards, enabling fully automated, efficient, reliable, and cost-effective chip packaging installation.

The market is experiencing steady growth due to surging demand in semiconductor and consumer electronics manufacturing, alongside the rise of surface-mount technology (SMT) and automation in assembly processes. Furthermore, miniaturization trends and the need for electrostatic discharge (ESD) protection in handling sensitive components are fueling expansion. Key players including 3M, Shin-Etsu, YAC Garter, K-Tech GmbH, Asahi Kasei, Fukuda, Keaco, LLC., Jabon, Ultra-Pak Industries, and Chung King Enterprise lead with diverse portfolios and ongoing innovations.

Electronic Parts Carrier Tape Market

MARKET DRIVERS

Surge in Electronics Manufacturing

Electronic Parts Carrier Tape Market is propelled by the escalating demand for surface-mount devices (SMDs) in consumer electronics, automotive, and telecommunications sectors. With global smartphone shipments exceeding 1.2 billion units annually and the rise of electric vehicles incorporating advanced semiconductors, carrier tapes ensure precise component handling during assembly processes. This growth is further fueled by automation in pick-and-place machines, enhancing throughput in high-volume production lines.

Expansion of Semiconductor Industry

Semiconductor fabrication facilities worldwide are scaling up to meet the needs of 5G infrastructure and IoT devices, driving the adoption of specialized carrier tapes for delicate chips. Market projections indicate a compound annual growth rate (CAGR) of around 6% for Electronic Parts Carrier Tape Market through 2030, supported by investments totaling over $500 billion in semiconductor capacity. Embossed and pocketed designs dominate, accommodating miniaturization trends in electronic components.

Innovative materials like conductive polymers improve ESD protection, reducing defects by up to 20% in assembly lines

Additionally, the shift toward lead-free soldering and RoHS compliance standards reinforces the need for robust carrier tapes that withstand high-temperature reflow processes, solidifying market momentum.

MARKET CHALLENGES

Raw Material Price Volatility

Fluctuations in petrochemical prices directly impact the production costs of polystyrene and polycarbonate-based carrier tapes in Electronic Parts Carrier Tape Market. Supply chain disruptions, as seen in recent global events, have led to a 15-20% rise in input costs, squeezing margins for manufacturers reliant on consistent resin supplies.

Other Challenges

Recycling and Sustainability Pressures

Traditional carrier tapes pose environmental disposal issues, with low recycling rates prompting stricter regulations. Industry players face hurdles in developing biodegradable alternatives without compromising mechanical strength or tape integrity during high-speed reeling.

MARKET RESTRAINTS

Regulatory Compliance Burdens

Stringent environmental regulations on plastic usage and waste management constrain expansion in Electronic Parts Carrier Tape Market. Compliance with REACH and TSCA standards requires costly material substitutions, slowing innovation cycles for tape producers serving global electronics assemblers.Geopolitical tensions and trade tariffs further limit cross-border material sourcing, with Asia-Pacific manufacturers,holding over 70% market share,facing export barriers that inflate costs for downstream users in Europe and North America.Moreover, the maturity of standard tape formats hinders rapid adoption of custom solutions, as equipment compatibility demands standardized dimensions, restricting flexibility amid evolving component sizes.

MARKET OPPORTUNITIES

Advancements in Smart Packaging

Electronic Parts Carrier Tape Market presents opportunities through integration of RFID and smart sensors for real-time inventory tracking in electronics supply chains. This innovation could reduce handling errors by 25%, appealing to high-precision sectors like aerospace and medical devices.Growing demand in emerging markets, particularly India and Southeast Asia with their burgeoning electronics manufacturing hubs, offers untapped potential estimated at $1.5 billion by 2028. Development of eco-friendly tapes using recycled polymers aligns with sustainability goals, capturing premium pricing from green-conscious OEMs.Furthermore, the proliferation of flexible electronics and wearables necessitates advanced tape designs with finer pitches, positioning early adopters to gain competitive edges in a market projected to surpass $4 billion globally.

Electronic Parts Carrier Tape Market Trends

Rising Demand Driven by Electronics Assembly Automation

Electronic Parts Carrier Tape Market continues to evolve with the surge in automated electronics manufacturing processes. Carrier tapes, essential for holding and positioning components during surface mount technology assembly, feature precise pockets and indexing holes that enable high-speed, reliable component placement on printed circuit boards. This trend reflects broader industry shifts toward fully automated, efficient production lines, reducing costs and enhancing reliability in chip packaging. Key players like 3M, Shin-Etsu, and Asahi Kasei are innovating tape designs to meet escalating demands from semiconductor and consumer electronics sectors.

Other Trends

Growth in Specialized Tape Segments

Segments such as conductive carrier tape and antistatic tapes are gaining prominence due to heightened focus on electrostatic discharge protection in sensitive electronic components. Conductive variants ensure safe handling of active electronic devices, while antistatic options cater to passive devices, minimizing risks during transportation and mounting. Insulating tapes also play a role in diverse applications, supporting the market’s diversification. Manufacturers are responding by refining material compositions to balance conductivity, durability, and environmental resistance, aligning with industry standards for high-volume production.

Regional Expansion and Competitive Dynamics

Asia-Pacific regions, particularly China, Japan, and South Korea, dominate Electronic Parts Carrier Tape Market, fueled by robust electronics manufacturing hubs and expanding consumer device production. North America and Europe follow, with emphasis on advanced applications in automotive and telecommunications. Competitive landscapes show top global players like YAC Garter, K-Tech GmbH, and Fukuda holding substantial revenue shares through strategic developments, mergers, and localized supply chains. Ongoing surveys among suppliers highlight challenges like raw material fluctuations and opportunities in sustainable packaging, positioning the market for steady adaptation amid global supply chain realignments. Industry experts note that downstream demands from active and passive devices will sustain momentum, encouraging investments in R&D for next-generation tapes.

COMPETITIVE LANDSCAPE

Key Industry Players

Strategic Positioning of Leading Manufacturers in the Global Electronic Parts Carrier Tape Market

Electronic Parts Carrier Tape Market exhibits a moderately concentrated structure, with the global top five players commanding a substantial revenue share in 2025. Industry leaders like 3M and Shin-Etsu Polymer dominate due to their scale, technological prowess in producing conductive, antistatic, and insulating carrier tapes, and robust supply chains tailored for high-volume electronics assembly. These firms leverage precision engineering to ensure compatibility with automated surface-mount technology (SMT) equipment, supporting applications in active and passive electronic devices. The market’s growth from USD 248 million in 2025 to USD 349 million by 2034 at a 5.1% CAGR underscores their influence amid rising demand for reliable packaging solutions in semiconductors and consumer electronics.

Beyond the frontrunners, a cadre of specialized niche players enriches the competitive dynamics, including Asahi Kasei, YAC Garter, and K-Tech GmbH, which focus on customized tapes for specific regional needs and material innovations to mitigate electrostatic discharge risks. Emerging contributors such as Fukuda, Keaco LLC, Jabon, and Ultra-Pak Industries are carving niches through agile manufacturing and expansions in Asia-Pacific hubs like China and Japan. Additional significant entities like Chung King Enterprise, CARRIER-TECH, Jeni Metal Chemical, Zhejiang Jiemei Electronic and Technology, and Shenzhen Prince New Material intensify rivalry by targeting cost-sensitive segments and advancing sustainable, high-performance carrier tapes, fostering overall market innovation and efficiency.

List of Key Electronic Parts Carrier Tape Companies Profiled

  • 3M
  • Shin-Etsu
  • YAC Garter
  • K-Tech GmbH
  • Asahi Kasei
  • Fukuda
  • Keaco, LLC.
  • Jabon
  • Ultra-Pak Industries
  • Chung King Enterprise
  • CARRIER-TECH
  • Jeni Metal Chemical
  • Zhejiang Jiemei Electronic and Technology
  • Shenzhen Prince New Material

Segment Analysis:

Segment Category Sub-Segments Key Insights
By Type
  • Conductive Carrier Tape
  • Antistatic (Static Dissipative) Carrier Tape
  • Insulating Carrier Tape
Antistatic (Static Dissipative) Carrier Tape

  • Delivers essential protection against electrostatic discharge, critical for handling delicate semiconductors in automated assembly lines.
  • Offers balanced electrical properties that ensure component safety throughout transportation, storage, and mounting processes.
  • Compatible with diverse cover tapes, facilitating seamless integration into high-speed surface mount technology equipment.
  • Supports industry shift toward smaller, more sensitive components by maintaining tape stability under varying humidity conditions.
By Application
  • Active Electronic Devices
  • Passive Electronic Devices
Passive Electronic Devices

  • Dominates due to extensive use in resistors, capacitors, and inductors which require reliable packaging for high-volume production.
  • Enables efficient reel-to-reel feeding in pick-and-place machines, optimizing throughput in electronics manufacturing.
  • Addresses challenges of miniaturization by providing precise pocket designs that prevent component damage and misalignment.
By End User
  • Consumer Electronics
  • Automotive Electronics
  • Industrial Equipment
  • Telecommunications
Consumer Electronics

  • Leads as manufacturers prioritize carrier tapes for compact devices like smartphones and wearables demanding flawless component placement.
  • Facilitates rapid prototyping and high-mix, low-volume runs through versatile tape configurations.
  • Meets stringent quality standards for dust-free environments, reducing defects in final assembly stages.
  • Aligns with fast-paced innovation cycles, enabling just-in-time supply chain integration globally.
By Material
  • Polystyrene (PS)
  • Polycarbonate (PC)
  • Polyester (PET)
Polystyrene (PS)

  • Prevalent for its superior formability, allowing complex pocket geometries tailored to diverse component shapes.
  • Provides cost-effective solution with robust mechanical properties for withstand repeated handling in automation.
  • Exhibits excellent adhesion with cover tapes, ensuring secure component retention during transit.
By Sprocket Pitch
  • 4mm
  • 8mm
  • 12mm
  • 16mm and Above
8mm

  • Stands out as the standard for small to medium SMD components, ensuring universal compatibility with feeder systems.
  • Optimizes production efficiency by accommodating high-density reels in space-constrained assembly environments.
  • Supports precise indexing for minimal misalignment errors in ultra-fine pitch applications.
  • Facilitates smooth transitions across global manufacturing lines with established tooling infrastructure.

Regional Analysis: Electronic Parts Carrier Tape Market

Asia-Pacific

Asia-Pacific dominates Electronic Parts Carrier Tape Market, fueled by its position as the global epicenter of electronics manufacturing. Rapid expansion in consumer electronics, semiconductors, and automotive sectors drives robust demand for carrier tapes that ensure precise component handling and protection during high-volume production. Countries like China, Japan, South Korea, and Taiwan host sprawling assembly lines where innovations in flexible packaging solutions address miniaturization challenges in advanced devices. Local manufacturers are advancing material technologies, such as embossed and pocketed tapes, to withstand electrostatic discharge and improve feeding accuracy in automated pick-and-place systems. Supply chain resilience efforts post-global disruptions have led to increased domestic production, reducing reliance on imports. Collaborative ecosystems between tape producers and electronics giants foster customized solutions for 5G modules and IoT components. Sustainability initiatives push biodegradable alternatives, aligning with regional green manufacturing policies. Market dynamics reflect intense competition, with scale advantages enabling cost efficiencies and rapid adaptation to evolving standards in surface-mount technology. This region’s forward momentum positions it as the vanguard for carrier tape innovations through 2034.

Asia-Pacific Key Drivers
Booming electronics assembly hubs propel demand for Electronic Parts Carrier Tape Market solutions. Surge in smartphone production and semiconductor fabs necessitates tapes with superior adhesion and durability. Automotive electrification trends amplify needs for reliable packaging in EV component handling.
Asia-Pacific Major Players
Leading firms innovate in advanced polymer formulations for precision tapes. Strong R&D collaborations with device makers enhance tape designs for ultra-fine pitch components. Regional giants leverage vertical integration for swift market responsiveness.
Asia-Pacific Trends
Shift toward eco-friendly tapes gains traction amid regulatory pressures. Adoption of anti-static enhancements supports high-speed automation. Customization for wearables and flexible electronics redefines tape specifications.
Asia-Pacific Opportunities
Expansion in display and sensor manufacturing opens avenues for specialized tapes. Supply chain localization initiatives invite new entrants. Tech upgrades in SMT lines boost demand for performance-optimized carrier solutions.

North America
North America plays a pivotal role in Electronic Parts Carrier Tape Market, emphasizing high-tech applications in aerospace, medical devices, and telecommunications. Innovation-driven ecosystems prioritize tapes with exceptional purity and ESD protection for sensitive components. U.S.-based firms focus on advanced materials to support next-generation computing and defense electronics. Steady growth stems from reshoring efforts in semiconductor packaging, enhancing tape usage in domestic fabs. Collaborative ventures between tape suppliers and OEMs drive standards for reliability in harsh environments. Sustainability efforts explore recyclable options, aligning with corporate ESG goals. Competitive landscape features premium pricing for custom-engineered products, with market dynamics influenced by R&D investments and proximity to end-users. Regional strengths in quality assurance position it for sustained contributions to global Electronic Parts Carrier Tape Market evolution.

Europe
Europe’s Electronic Parts Carrier Tape Market thrives on stringent quality norms and diversified industrial bases in automotive and industrial automation. Germany and other nations lead in precision engineering, demanding tapes optimized for robotic assembly and miniaturization. Emphasis on circular economy principles accelerates development of sustainable carrier materials. Regulatory frameworks promote eco-compliant packaging, influencing supplier strategies. Growth is supported by robust automotive sector transitions to electric vehicles, requiring durable tapes for battery management systems. Strategic partnerships foster innovations in conductive films and embossing techniques. Market competition revolves around compliance certifications, with dynamics favoring established players adept at multi-standard adherence. Europe’s focus on value-added features ensures its relevance in the expanding Electronic Parts Carrier Tape Market landscape.

South America
South America emerges as a growing niche in Electronic Parts Carrier Tape Market, driven by expanding consumer electronics assembly and automotive localization. Brazil and regional hubs see rising demand for cost-effective tapes amid import substitution policies. Challenges in infrastructure spur adaptations in tape robustness for variable humidity conditions. Local manufacturers partner with multinationals to upscale production for white goods and telecom gear. Investment in training enhances SMT line efficiencies, boosting carrier tape volumes. Market dynamics reflect price sensitivity balanced by quality improvements. Emerging opportunities in renewable energy components further stimulate the sector, positioning South America for incremental gains in the global Electronic Parts Carrier Tape Market.

Middle East & Africa
The Middle East & Africa region in Electronic Parts Carrier Tape Market is nascent yet promising, anchored by oil-funded diversification into electronics and renewables. UAE and South Africa lead assembly initiatives for consumer gadgets and solar inverters. Demand focuses on heat-resistant tapes suited to arid climates. Infrastructure projects drive telecom infrastructure builds, elevating carrier needs. Collaborations with Asian suppliers bridge technology gaps while local content rules encourage domestic production. Market growth hinges on workforce skilling and logistics enhancements. Dynamics emphasize affordability and reliability, with potential in data center expansions. This region’s strategic investments signal a pathway to deeper integration in Electronic Parts Carrier Tape Market.

Report Scope

This market research report provides a comprehensive analysis of Electronic Parts Carrier Tape Market, covering the forecast period 2026–2034. It offers detailed insights into market dynamics, technological advancements, competitive landscape, and key trends shaping the industry.

Key focus areas of the report include:

  • Market Overview: The report begins with an overview outlining its current market scenario, key growth indicators, and industry transformation drivers. It discusses macroeconomic factors, demand–supply balance, regulatory landscape, and the strategic role of semiconductors in powering advancements across industries such as automotive, telecommunications, consumer electronics, and industrial automation.
  • Market Size & Forecast: Historical data and future projections for revenue, unit shipments, and market value across major regions and segments.
  • Segmentation Analysis: Detailed breakdown by product type, technology, application, and end-user industry to identify high-growth segments and investment opportunities.
  • Regional Insights: Insights into market performance across North America, Europe, Asia-Pacific, Latin America, and the Middle East & Africa, including country-level analysis where relevant.
  • Competitive Landscape: Profiles of leading market participants, including their product offerings, R&D focus, manufacturing capacity, pricing strategies, and recent developments such as mergers, acquisitions, and partnerships.
  • Technology Trends & Innovation: Assessment of emerging technologies, integration of AI/IoT, semiconductor design trends, fabrication techniques, and evolving industry standards.
  • Market Drivers & Restraints: Evaluation of factors driving market growth along with challenges, supply chain constraints, regulatory issues, and market-entry barriers.
  • Stakeholder Insights: Insights for component suppliers, OEMs, system integrators, investors, and policymakers regarding the evolving ecosystem and strategic opportunities.

Primary and secondary research methods are employed, including interviews with industry experts, data from verified sources, and real-time market intelligence to ensure the accuracy and reliability of the insights presented.

FREQUENTLY ASKED QUESTIONS:

What is the current market size of Electronic Parts Carrier Tape Market?

-> Global Electronic Parts Carrier Tape Market was valued at USD 248 million in 2025 and is expected to reach USD 349 million by 2034, at a CAGR of 5.1% during the forecast period.

Which key companies operate in Electronic Parts Carrier Tape Market?

-> Key players include 3M, Shin-Etsu, YAC Garter, K-Tech Gmbh, Asahi Kasei, Fukuda, Keaco, LLC., Jabon, Ultra-Pak Industries, and Chung King Enterprise, among others.

What are the key growth drivers?

-> Key growth drivers include demand for automated electronic component mounting, expansion in electronics packaging, and growth in semiconductor and consumer electronics industries.

Which region dominates the market?

-> Asia dominates the market, with significant contributions from China, Japan, and South Korea.

What are the emerging trends?

-> Emerging trends include advancements in conductive and antistatic carrier tapes, improvements in ESD protection for active and passive electronic devices, and enhanced automation in SMT processes.

Electronic Parts Carrier Tape Market, Trends, Business Strategies 2026-2034

Get Sample Report PDF for Exclusive Insights

Report Sample Includes

  • Table of Contents
  • List of Tables & Figures
  • Charts, Research Methodology, and more...
PDF Icon Download Sample Report PDF
SKU: 6aff59d95db3
Category:
License Type

Corporate License, Excel License, PDF and Excel Databook License

Download Sample Report

Table of Content

1 Introduction to Research & Analysis Reports
1.1 Electronic Parts Carrier Tape Market Definition
1.2 Market Segments
1.2.1 Segment by Type
1.2.2 Segment by Application
1.3 Global Electronic Parts Carrier Tape Market Overview
1.4 Features & Benefits of This Report
1.5 Methodology & Sources of Information
1.5.1 Research Methodology
1.5.2 Research Process
1.5.3 Base Year
1.5.4 Report Assumptions & Caveats
2 Global Electronic Parts Carrier Tape Overall Market Size
2.1 Global Electronic Parts Carrier Tape Market Size: 2025 VS 2034
2.2 Global Electronic Parts Carrier Tape Market Size, Prospects & Forecasts: 2021-2034
2.3 Global Electronic Parts Carrier Tape Sales: 2021-2034
3 Company Landscape
3.1 Top Electronic Parts Carrier Tape Players in Global Market
3.2 Top Global Electronic Parts Carrier Tape Companies Ranked by Revenue
3.3 Global Electronic Parts Carrier Tape Revenue by Companies
3.4 Global Electronic Parts Carrier Tape Sales by Companies
3.5 Global Electronic Parts Carrier Tape Price by Manufacturer (2021-2026)
3.6 Top 3 and Top 5 Electronic Parts Carrier Tape Companies in Global Market, by Revenue in 2025
3.7 Global Manufacturers Electronic Parts Carrier Tape Product Type
3.8 Tier 1, Tier 2, and Tier 3 Electronic Parts Carrier Tape Players in Global Market
3.8.1 List of Global Tier 1 Electronic Parts Carrier Tape Companies
3.8.2 List of Global Tier 2 and Tier 3 Electronic Parts Carrier Tape Companies
4 Sights by Type
4.1 Overview
4.1.1 Segment by Type – Global Electronic Parts Carrier Tape Market Size Markets, 2025 & 2034
4.1.2 Conductive Carrier Tape
4.1.3 Antistatic (Static Dissipative) Carrier Tape
4.1.4 Insulating Carrier Tape
4.2 Segment by Type – Global Electronic Parts Carrier Tape Revenue & Forecasts
4.2.1 Segment by Type – Global Electronic Parts Carrier Tape Revenue, 2021-2026
4.2.2 Segment by Type – Global Electronic Parts Carrier Tape Revenue, 2027-2034
4.2.3 Segment by Type – Global Electronic Parts Carrier Tape Revenue Market Share, 2021-2034
4.3 Segment by Type – Global Electronic Parts Carrier Tape Sales & Forecasts
4.3.1 Segment by Type – Global Electronic Parts Carrier Tape Sales, 2021-2026
4.3.2 Segment by Type – Global Electronic Parts Carrier Tape Sales, 2027-2034
4.3.3 Segment by Type – Global Electronic Parts Carrier Tape Sales Market Share, 2021-2034
4.4 Segment by Type – Global Electronic Parts Carrier Tape Price (Manufacturers Selling Prices), 2021-2034
5 Sights by Application
5.1 Overview
5.1.1 Segment by Application – Global Electronic Parts Carrier Tape Market Size, 2025 & 2034
5.1.2 Active Electronic Devices
5.1.3 Passive Electronic Devices
5.2 Segment by Application – Global Electronic Parts Carrier Tape Revenue & Forecasts
5.2.1 Segment by Application – Global Electronic Parts Carrier Tape Revenue, 2021-2026
5.2.2 Segment by Application – Global Electronic Parts Carrier Tape Revenue, 2027-2034
5.2.3 Segment by Application – Global Electronic Parts Carrier Tape Revenue Market Share, 2021-2034
5.3 Segment by Application – Global Electronic Parts Carrier Tape Sales & Forecasts
5.3.1 Segment by Application – Global Electronic Parts Carrier Tape Sales, 2021-2026
5.3.2 Segment by Application – Global Electronic Parts Carrier Tape Sales, 2027-2034
5.3.3 Segment by Application – Global Electronic Parts Carrier Tape Sales Market Share, 2021-2034
5.4 Segment by Application – Global Electronic Parts Carrier Tape Price (Manufacturers Selling Prices), 2021-2034
6 Sights Region
6.1 By Region – Global Electronic Parts Carrier Tape Market Size, 2025 & 2034
6.2 By Region – Global Electronic Parts Carrier Tape Revenue & Forecasts
6.2.1 By Region – Global Electronic Parts Carrier Tape Revenue, 2021-2026
6.2.2 By Region – Global Electronic Parts Carrier Tape Revenue, 2027-2034
6.2.3 By Region – Global Electronic Parts Carrier Tape Revenue Market Share, 2021-2034
6.3 By Region – Global Electronic Parts Carrier Tape Sales & Forecasts
6.3.1 By Region – Global Electronic Parts Carrier Tape Sales, 2021-2026
6.3.2 By Region – Global Electronic Parts Carrier Tape Sales, 2027-2034
6.3.3 By Region – Global Electronic Parts Carrier Tape Sales Market Share, 2021-2034
6.4 North America
6.4.1 By Country – North America Electronic Parts Carrier Tape Revenue, 2021-2034
6.4.2 By Country – North America Electronic Parts Carrier Tape Sales, 2021-2034
6.4.3 United States Electronic Parts Carrier Tape Market Size, 2021-2034
6.4.4 Canada Electronic Parts Carrier Tape Market Size, 2021-2034
6.4.5 Mexico Electronic Parts Carrier Tape Market Size, 2021-2034
6.5 Europe
6.5.1 By Country – Europe Electronic Parts Carrier Tape Revenue, 2021-2034
6.5.2 By Country – Europe Electronic Parts Carrier Tape Sales, 2021-2034
6.5.3 Germany Electronic Parts Carrier Tape Market Size, 2021-2034
6.5.4 France Electronic Parts Carrier Tape Market Size, 2021-2034
6.5.5 U.K. Electronic Parts Carrier Tape Market Size, 2021-2034
6.5.6 Italy Electronic Parts Carrier Tape Market Size, 2021-2034
6.5.7 Russia Electronic Parts Carrier Tape Market Size, 2021-2034
6.5.8 Nordic Countries Electronic Parts Carrier Tape Market Size, 2021-2034
6.5.9 Benelux Electronic Parts Carrier Tape Market Size, 2021-2034
6.6 Asia
6.6.1 By Region – Asia Electronic Parts Carrier Tape Revenue, 2021-2034
6.6.2 By Region – Asia Electronic Parts Carrier Tape Sales, 2021-2034
6.6.3 China Electronic Parts Carrier Tape Market Size, 2021-2034
6.6.4 Japan Electronic Parts Carrier Tape Market Size, 2021-2034
6.6.5 South Korea Electronic Parts Carrier Tape Market Size, 2021-2034
6.6.6 Southeast Asia Electronic Parts Carrier Tape Market Size, 2021-2034
6.6.7 India Electronic Parts Carrier Tape Market Size, 2021-2034
6.7 South America
6.7.1 By Country – South America Electronic Parts Carrier Tape Revenue, 2021-2034
6.7.2 By Country – South America Electronic Parts Carrier Tape Sales, 2021-2034
6.7.3 Brazil Electronic Parts Carrier Tape Market Size, 2021-2034
6.7.4 Argentina Electronic Parts Carrier Tape Market Size, 2021-2034
6.8 Middle East & Africa
6.8.1 By Country – Middle East & Africa Electronic Parts Carrier Tape Revenue, 2021-2034
6.8.2 By Country – Middle East & Africa Electronic Parts Carrier Tape Sales, 2021-2034
6.8.3 Turkey Electronic Parts Carrier Tape Market Size, 2021-2034
6.8.4 Israel Electronic Parts Carrier Tape Market Size, 2021-2034
6.8.5 Saudi Arabia Electronic Parts Carrier Tape Market Size, 2021-2034
6.8.6 UAE Electronic Parts Carrier Tape Market Size, 2021-2034
7 Manufacturers & Brands Profiles
7.1 3M
7.1.1 3M Company Summary
7.1.2 3M Business Overview
7.1.3 3M Electronic Parts Carrier Tape Major Product Offerings
7.1.4 3M Electronic Parts Carrier Tape Sales and Revenue in Global (2021-2026)
7.1.5 3M Key News & Latest Developments
7.2 Shin-Etsu
7.2.1 Shin-Etsu Company Summary
7.2.2 Shin-Etsu Business Overview
7.2.3 Shin-Etsu Electronic Parts Carrier Tape Major Product Offerings
7.2.4 Shin-Etsu Electronic Parts Carrier Tape Sales and Revenue in Global (2021-2026)
7.2.5 Shin-Etsu Key News & Latest Developments
7.3 YAC Garter
7.3.1 YAC Garter Company Summary
7.3.2 YAC Garter Business Overview
7.3.3 YAC Garter Electronic Parts Carrier Tape Major Product Offerings
7.3.4 YAC Garter Electronic Parts Carrier Tape Sales and Revenue in Global (2021-2026)
7.3.5 YAC Garter Key News & Latest Developments
7.4 K-Tech Gmbh
7.4.1 K-Tech Gmbh Company Summary
7.4.2 K-Tech Gmbh Business Overview
7.4.3 K-Tech Gmbh Electronic Parts Carrier Tape Major Product Offerings
7.4.4 K-Tech Gmbh Electronic Parts Carrier Tape Sales and Revenue in Global (2021-2026)
7.4.5 K-Tech Gmbh Key News & Latest Developments
7.5 Asahi Kasei
7.5.1 Asahi Kasei Company Summary
7.5.2 Asahi Kasei Business Overview
7.5.3 Asahi Kasei Electronic Parts Carrier Tape Major Product Offerings
7.5.4 Asahi Kasei Electronic Parts Carrier Tape Sales and Revenue in Global (2021-2026)
7.5.5 Asahi Kasei Key News & Latest Developments
7.6 Fukuda
7.6.1 Fukuda Company Summary
7.6.2 Fukuda Business Overview
7.6.3 Fukuda Electronic Parts Carrier Tape Major Product Offerings
7.6.4 Fukuda Electronic Parts Carrier Tape Sales and Revenue in Global (2021-2026)
7.6.5 Fukuda Key News & Latest Developments
7.7 Keaco, LLC.
7.7.1 Keaco, LLC. Company Summary
7.7.2 Keaco, LLC. Business Overview
7.7.3 Keaco, LLC. Electronic Parts Carrier Tape Major Product Offerings
7.7.4 Keaco, LLC. Electronic Parts Carrier Tape Sales and Revenue in Global (2021-2026)
7.7.5 Keaco, LLC. Key News & Latest Developments
7.8 Jabon
7.8.1 Jabon Company Summary
7.8.2 Jabon Business Overview
7.8.3 Jabon Electronic Parts Carrier Tape Major Product Offerings
7.8.4 Jabon Electronic Parts Carrier Tape Sales and Revenue in Global (2021-2026)
7.8.5 Jabon Key News & Latest Developments
7.9 Ultra-Pak Industries
7.9.1 Ultra-Pak Industries Company Summary
7.9.2 Ultra-Pak Industries Business Overview
7.9.3 Ultra-Pak Industries Electronic Parts Carrier Tape Major Product Offerings
7.9.4 Ultra-Pak Industries Electronic Parts Carrier Tape Sales and Revenue in Global (2021-2026)
7.9.5 Ultra-Pak Industries Key News & Latest Developments
7.10 Chung King Enterprise
7.10.1 Chung King Enterprise Company Summary
7.10.2 Chung King Enterprise Business Overview
7.10.3 Chung King Enterprise Electronic Parts Carrier Tape Major Product Offerings
7.10.4 Chung King Enterprise Electronic Parts Carrier Tape Sales and Revenue in Global (2021-2026)
7.10.5 Chung King Enterprise Key News & Latest Developments
7.11 CARRIER-TECH
7.11.1 CARRIER-TECH Company Summary
7.11.2 CARRIER-TECH Business Overview
7.11.3 CARRIER-TECH Electronic Parts Carrier Tape Major Product Offerings
7.11.4 CARRIER-TECH Electronic Parts Carrier Tape Sales and Revenue in Global (2021-2026)
7.11.5 CARRIER-TECH Key News & Latest Developments
7.12 Jeni Metal Chemical
7.12.1 Jeni Metal Chemical Company Summary
7.12.2 Jeni Metal Chemical Business Overview
7.12.3 Jeni Metal Chemical Electronic Parts Carrier Tape Major Product Offerings
7.12.4 Jeni Metal Chemical Electronic Parts Carrier Tape Sales and Revenue in Global (2021-2026)
7.12.5 Jeni Metal Chemical Key News & Latest Developments
7.13 Zhejiang Jiemei Electronic and Technology
7.13.1 Zhejiang Jiemei Electronic and Technology Company Summary
7.13.2 Zhejiang Jiemei Electronic and Technology Business Overview
7.13.3 Zhejiang Jiemei Electronic and Technology Electronic Parts Carrier Tape Major Product Offerings
7.13.4 Zhejiang Jiemei Electronic and Technology Electronic Parts Carrier Tape Sales and Revenue in Global (2021-2026)
7.13.5 Zhejiang Jiemei Electronic and Technology Key News & Latest Developments
7.14 Shenzhen Prince New Material
7.14.1 Shenzhen Prince New Material Company Summary
7.14.2 Shenzhen Prince New Material Business Overview
7.14.3 Shenzhen Prince New Material Electronic Parts Carrier Tape Major Product Offerings
7.14.4 Shenzhen Prince New Material Electronic Parts Carrier Tape Sales and Revenue in Global (2021-2026)
7.14.5 Shenzhen Prince New Material Key News & Latest Developments
8 Global Electronic Parts Carrier Tape Production Capacity, Analysis
8.1 Global Electronic Parts Carrier Tape Production Capacity, 2021-2034
8.2 Electronic Parts Carrier Tape Production Capacity of Key Manufacturers in Global Market
8.3 Global Electronic Parts Carrier Tape Production by Region
9 Key Market Trends, Opportunity, Drivers and Restraints
9.1 Market Opportunities & Trends
9.2 Market Drivers
9.3 Market Restraints
10 Electronic Parts Carrier Tape Supply Chain Analysis
10.1 Electronic Parts Carrier Tape Industry Value Chain
10.2 Electronic Parts Carrier Tape Upstream Market
10.3 Electronic Parts Carrier Tape Downstream and Clients
10.4 Marketing Channels Analysis
10.4.1 Marketing Channels
10.4.2 Electronic Parts Carrier Tape Distributors and Sales Agents in Global
11 Conclusion
12 Appendix
12.1 Note
12.2 Examples of Clients
12.3 DisclaimerList of Tables
Table 1. Key Players of Electronic Parts Carrier Tape in Global Market
Table 2. Top Electronic Parts Carrier Tape Players in Global Market, Ranking by Revenue (2025)
Table 3. Global Electronic Parts Carrier Tape Revenue by Companies, (US$, Mn), 2021-2026
Table 4. Global Electronic Parts Carrier Tape Revenue Share by Companies, 2021-2026
Table 5. Global Electronic Parts Carrier Tape Sales by Companies, (K Sqm), 2021-2026
Table 6. Global Electronic Parts Carrier Tape Sales Share by Companies, 2021-2026
Table 7. Key Manufacturers Electronic Parts Carrier Tape Price (2021-2026) & (US$/Sq m)
Table 8. Global Manufacturers Electronic Parts Carrier Tape Product Type
Table 9. List of Global Tier 1 Electronic Parts Carrier Tape Companies, Revenue (US$, Mn) in 2025 and Market Share
Table 10. List of Global Tier 2 and Tier 3 Electronic Parts Carrier Tape Companies, Revenue (US$, Mn) in 2025 and Market Share
Table 11. Segment by Type – Global Electronic Parts Carrier Tape Revenue, (US$, Mn), 2025 & 2034
Table 12. Segment by Type – Global Electronic Parts Carrier Tape Revenue (US$, Mn), 2021-2026
Table 13. Segment by Type – Global Electronic Parts Carrier Tape Revenue (US$, Mn), 2027-2034
Table 14. Segment by Type – Global Electronic Parts Carrier Tape Sales (K Sqm), 2021-2026
Table 15. Segment by Type – Global Electronic Parts Carrier Tape Sales (K Sqm), 2027-2034
Table 16. Segment by Application – Global Electronic Parts Carrier Tape Revenue, (US$, Mn), 2025 & 2034
Table 17. Segment by Application – Global Electronic Parts Carrier Tape Revenue, (US$, Mn), 2021-2026
Table 18. Segment by Application – Global Electronic Parts Carrier Tape Revenue, (US$, Mn), 2027-2034
Table 19. Segment by Application – Global Electronic Parts Carrier Tape Sales, (K Sqm), 2021-2026
Table 20. Segment by Application – Global Electronic Parts Carrier Tape Sales, (K Sqm), 2027-2034
Table 21. By Region – Global Electronic Parts Carrier Tape Revenue, (US$, Mn), 2025 & 2034
Table 22. By Region – Global Electronic Parts Carrier Tape Revenue, (US$, Mn), 2021-2026
Table 23. By Region – Global Electronic Parts Carrier Tape Revenue, (US$, Mn), 2027-2034
Table 24. By Region – Global Electronic Parts Carrier Tape Sales, (K Sqm), 2021-2026
Table 25. By Region – Global Electronic Parts Carrier Tape Sales, (K Sqm), 2027-2034
Table 26. By Country – North America Electronic Parts Carrier Tape Revenue, (US$, Mn), 2021-2026
Table 27. By Country – North America Electronic Parts Carrier Tape Revenue, (US$, Mn), 2027-2034
Table 28. By Country – North America Electronic Parts Carrier Tape Sales, (K Sqm), 2021-2026
Table 29. By Country – North America Electronic Parts Carrier Tape Sales, (K Sqm), 2027-2034
Table 30. By Country – Europe Electronic Parts Carrier Tape Revenue, (US$, Mn), 2021-2026
Table 31. By Country – Europe Electronic Parts Carrier Tape Revenue, (US$, Mn), 2027-2034
Table 32. By Country – Europe Electronic Parts Carrier Tape Sales, (K Sqm), 2021-2026
Table 33. By Country – Europe Electronic Parts Carrier Tape Sales, (K Sqm), 2027-2034
Table 34. By Region – Asia Electronic Parts Carrier Tape Revenue, (US$, Mn), 2021-2026
Table 35. By Region – Asia Electronic Parts Carrier Tape Revenue, (US$, Mn), 2027-2034
Table 36. By Region – Asia Electronic Parts Carrier Tape Sales, (K Sqm), 2021-2026
Table 37. By Region – Asia Electronic Parts Carrier Tape Sales, (K Sqm), 2027-2034
Table 38. By Country – South America Electronic Parts Carrier Tape Revenue, (US$, Mn), 2021-2026
Table 39. By Country – South America Electronic Parts Carrier Tape Revenue, (US$, Mn), 2027-2034
Table 40. By Country – South America Electronic Parts Carrier Tape Sales, (K Sqm), 2021-2026
Table 41. By Country – South America Electronic Parts Carrier Tape Sales, (K Sqm), 2027-2034
Table 42. By Country – Middle East & Africa Electronic Parts Carrier Tape Revenue, (US$, Mn), 2021-2026
Table 43. By Country – Middle East & Africa Electronic Parts Carrier Tape Revenue, (US$, Mn), 2027-2034
Table 44. By Country – Middle East & Africa Electronic Parts Carrier Tape Sales, (K Sqm), 2021-2026
Table 45. By Country – Middle East & Africa Electronic Parts Carrier Tape Sales, (K Sqm), 2027-2034
Table 46. 3M Company Summary
Table 47. 3M Electronic Parts Carrier Tape Product Offerings
Table 48. 3M Electronic Parts Carrier Tape Sales (K Sqm), Revenue (US$, Mn) and Average Price (US$/Sq m) & (2021-2026)
Table 49. 3M Key News & Latest Developments
Table 50. Shin-Etsu Company Summary
Table 51. Shin-Etsu Electronic Parts Carrier Tape Product Offerings
Table 52. Shin-Etsu Electronic Parts Carrier Tape Sales (K Sqm), Revenue (US$, Mn) and Average Price (US$/Sq m) & (2021-2026)
Table 53. Shin-Etsu Key News & Latest Developments
Table 54. YAC Garter Company Summary
Table 55. YAC Garter Electronic Parts Carrier Tape Product Offerings
Table 56. YAC Garter Electronic Parts Carrier Tape Sales (K Sqm), Revenue (US$, Mn) and Average Price (US$/Sq m) & (2021-2026)
Table 57. YAC Garter Key News & Latest Developments
Table 58. K-Tech Gmbh Company Summary
Table 59. K-Tech Gmbh Electronic Parts Carrier Tape Product Offerings
Table 60. K-Tech Gmbh Electronic Parts Carrier Tape Sales (K Sqm), Revenue (US$, Mn) and Average Price (US$/Sq m) & (2021-2026)
Table 61. K-Tech Gmbh Key News & Latest Developments
Table 62. Asahi Kasei Company Summary
Table 63. Asahi Kasei Electronic Parts Carrier Tape Product Offerings
Table 64. Asahi Kasei Electronic Parts Carrier Tape Sales (K Sqm), Revenue (US$, Mn) and Average Price (US$/Sq m) & (2021-2026)
Table 65. Asahi Kasei Key News & Latest Developments
Table 66. Fukuda Company Summary
Table 67. Fukuda Electronic Parts Carrier Tape Product Offerings
Table 68. Fukuda Electronic Parts Carrier Tape Sales (K Sqm), Revenue (US$, Mn) and Average Price (US$/Sq m) & (2021-2026)
Table 69. Fukuda Key News & Latest Developments
Table 70. Keaco, LLC. Company Summary
Table 71. Keaco, LLC. Electronic Parts Carrier Tape Product Offerings
Table 72. Keaco, LLC. Electronic Parts Carrier Tape Sales (K Sqm), Revenue (US$, Mn) and Average Price (US$/Sq m) & (2021-2026)
Table 73. Keaco, LLC. Key News & Latest Developments
Table 74. Jabon Company Summary
Table 75. Jabon Electronic Parts Carrier Tape Product Offerings
Table 76. Jabon Electronic Parts Carrier Tape Sales (K Sqm), Revenue (US$, Mn) and Average Price (US$/Sq m) & (2021-2026)
Table 77. Jabon Key News & Latest Developments
Table 78. Ultra-Pak Industries Company Summary
Table 79. Ultra-Pak Industries Electronic Parts Carrier Tape Product Offerings
Table 80. Ultra-Pak Industries Electronic Parts Carrier Tape Sales (K Sqm), Revenue (US$, Mn) and Average Price (US$/Sq m) & (2021-2026)
Table 81. Ultra-Pak Industries Key News & Latest Developments
Table 82. Chung King Enterprise Company Summary
Table 83. Chung King Enterprise Electronic Parts Carrier Tape Product Offerings
Table 84. Chung King Enterprise Electronic Parts Carrier Tape Sales (K Sqm), Revenue (US$, Mn) and Average Price (US$/Sq m) & (2021-2026)
Table 85. Chung King Enterprise Key News & Latest Developments
Table 86. CARRIER-TECH Company Summary
Table 87. CARRIER-TECH Electronic Parts Carrier Tape Product Offerings
Table 88. CARRIER-TECH Electronic Parts Carrier Tape Sales (K Sqm), Revenue (US$, Mn) and Average Price (US$/Sq m) & (2021-2026)
Table 89. CARRIER-TECH Key News & Latest Developments
Table 90. Jeni Metal Chemical Company Summary
Table 91. Jeni Metal Chemical Electronic Parts Carrier Tape Product Offerings
Table 92. Jeni Metal Chemical Electronic Parts Carrier Tape Sales (K Sqm), Revenue (US$, Mn) and Average Price (US$/Sq m) & (2021-2026)
Table 93. Jeni Metal Chemical Key News & Latest Developments
Table 94. Zhejiang Jiemei Electronic and Technology Company Summary
Table 95. Zhejiang Jiemei Electronic and Technology Electronic Parts Carrier Tape Product Offerings
Table 96. Zhejiang Jiemei Electronic and Technology Electronic Parts Carrier Tape Sales (K Sqm), Revenue (US$, Mn) and Average Price (US$/Sq m) & (2021-2026)
Table 97. Zhejiang Jiemei Electronic and Technology Key News & Latest Developments
Table 98. Shenzhen Prince New Material Company Summary
Table 99. Shenzhen Prince New Material Electronic Parts Carrier Tape Product Offerings
Table 100. Shenzhen Prince New Material Electronic Parts Carrier Tape Sales (K Sqm), Revenue (US$, Mn) and Average Price (US$/Sq m) & (2021-2026)
Table 101. Shenzhen Prince New Material Key News & Latest Developments
Table 102. Electronic Parts Carrier Tape Capacity of Key Manufacturers in Global Market, 2024-2026 (K Sqm)
Table 103. Global Electronic Parts Carrier Tape Capacity Market Share of Key Manufacturers, 2024-2026
Table 104. Global Electronic Parts Carrier Tape Production by Region, 2021-2026 (K Sqm)
Table 105. Global Electronic Parts Carrier Tape Production by Region, 2027-2034 (K Sqm)
Table 106. Electronic Parts Carrier Tape Market Opportunities & Trends in Global Market
Table 107. Electronic Parts Carrier Tape Market Drivers in Global Market
Table 108. Electronic Parts Carrier Tape Market Restraints in Global Market
Table 109. Electronic Parts Carrier Tape Raw Materials
Table 110. Electronic Parts Carrier Tape Raw Materials Suppliers in Global Market
Table 111. Typical Electronic Parts Carrier Tape Downstream
Table 112. Electronic Parts Carrier Tape Downstream Clients in Global Market
Table 113. Electronic Parts Carrier Tape Distributors and Sales Agents in Global Market

List of Figures
Figure 1. Electronic Parts Carrier Tape Product Picture
Figure 2. Electronic Parts Carrier Tape Segment by Type in 2025
Figure 3. Electronic Parts Carrier Tape Segment by Application in 2025
Figure 4. Global Electronic Parts Carrier Tape Market Overview: 2025
Figure 5. Key Caveats
Figure 6. Global Electronic Parts Carrier Tape Market Size: 2025 VS 2034 (US$, Mn)
Figure 7. Global Electronic Parts Carrier Tape Revenue: 2021-2034 (US$, Mn)
Figure 8. Electronic Parts Carrier Tape Sales in Global Market: 2021-2034 (K Sqm)
Figure 9. The Top 3 and 5 Players Market Share by Electronic Parts Carrier Tape Revenue in 2025
Figure 10. Segment by Type – Global Electronic Parts Carrier Tape Revenue, (US$, Mn), 2025 & 2034
Figure 11. Segment by Type – Global Electronic Parts Carrier Tape Revenue Market Share, 2021-2034
Figure 12. Segment by Type – Global Electronic Parts Carrier Tape Sales Market Share, 2021-2034
Figure 13. Segment by Type – Global Electronic Parts Carrier Tape Price (US$/Sq m), 2021-2034
Figure 14. Segment by Application – Global Electronic Parts Carrier Tape Revenue, (US$, Mn), 2025 & 2034
Figure 15. Segment by Application – Global Electronic Parts Carrier Tape Revenue Market Share, 2021-2034
Figure 16. Segment by Application – Global Electronic Parts Carrier Tape Sales Market Share, 2021-2034
Figure 17. Segment by Application -Global Electronic Parts Carrier Tape Price (US$/Sq m), 2021-2034
Figure 18. By Region – Global Electronic Parts Carrier Tape Revenue, (US$, Mn), 2025 & 2034
Figure 19. By Region – Global Electronic Parts Carrier Tape Revenue Market Share, 2021 VS 2025 VS 2034
Figure 20. By Region – Global Electronic Parts Carrier Tape Revenue Market Share, 2021-2034
Figure 21. By Region – Global Electronic Parts Carrier Tape Sales Market Share, 2021-2034
Figure 22. By Country – North America Electronic Parts Carrier Tape Revenue Market Share, 2021-2034
Figure 23. By Country – North America Electronic Parts Carrier Tape Sales Market Share, 2021-2034
Figure 24. United States Electronic Parts Carrier Tape Revenue, (US$, Mn), 2021-2034
Figure 25. Canada Electronic Parts Carrier Tape Revenue, (US$, Mn), 2021-2034
Figure 26. Mexico Electronic Parts Carrier Tape Revenue, (US$, Mn), 2021-2034
Figure 27. By Country – Europe Electronic Parts Carrier Tape Revenue Market Share, 2021-2034
Figure 28. By Country – Europe Electronic Parts Carrier Tape Sales Market Share, 2021-2034
Figure 29. Germany Electronic Parts Carrier Tape Revenue, (US$, Mn), 2021-2034
Figure 30. France Electronic Parts Carrier Tape Revenue, (US$, Mn), 2021-2034
Figure 31. U.K. Electronic Parts Carrier Tape Revenue, (US$, Mn), 2021-2034
Figure 32. Italy Electronic Parts Carrier Tape Revenue, (US$, Mn), 2021-2034
Figure 33. Russia Electronic Parts Carrier Tape Revenue, (US$, Mn), 2021-2034
Figure 34. Nordic Countries Electronic Parts Carrier Tape Revenue, (US$, Mn), 2021-2034
Figure 35. Benelux Electronic Parts Carrier Tape Revenue, (US$, Mn), 2021-2034
Figure 36. By Region – Asia Electronic Parts Carrier Tape Revenue Market Share, 2021-2034
Figure 37. By Region – Asia Electronic Parts Carrier Tape Sales Market Share, 2021-2034
Figure 38. China Electronic Parts Carrier Tape Revenue, (US$, Mn), 2021-2034
Figure 39. Japan Electronic Parts Carrier Tape Revenue, (US$, Mn), 2021-2034
Figure 40. South Korea Electronic Parts Carrier Tape Revenue, (US$, Mn), 2021-2034
Figure 41. Southeast Asia Electronic Parts Carrier Tape Revenue, (US$, Mn), 2021-2034
Figure 42. India Electronic Parts Carrier Tape Revenue, (US$, Mn), 2021-2034
Figure 43. By Country – South America Electronic Parts Carrier Tape Revenue Market Share, 2021-2034
Figure 44. By Country – South America Electronic Parts Carrier Tape Sales, Market Share, 2021-2034
Figure 45. Brazil Electronic Parts Carrier Tape Revenue, (US$, Mn), 2021-2034
Figure 46. Argentina Electronic Parts Carrier Tape Revenue, (US$, Mn), 2021-2034
Figure 47. By Country – Middle East & Africa Electronic Parts Carrier Tape Revenue, Market Share, 2021-2034
Figure 48. By Country – Middle East & Africa Electronic Parts Carrier Tape Sales, Market Share, 2021-2034
Figure 49. Turkey Electronic Parts Carrier Tape Revenue, (US$, Mn), 2021-2034
Figure 50. Israel Electronic Parts Carrier Tape Revenue, (US$, Mn), 2021-2034
Figure 51. Saudi Arabia Electronic Parts Carrier Tape Revenue, (US$, Mn), 2021-2034
Figure 52. UAE Electronic Parts Carrier Tape Revenue, (US$, Mn), 2021-2034
Figure 53. Global Electronic Parts Carrier Tape Production Capacity (K Sqm), 2021-2034
Figure 54. The Percentage of Production Electronic Parts Carrier Tape by Region, 2025 VS 2034
Figure 55. Electronic Parts Carrier Tape Industry Value Chain
Figure 56. Marketing Channels