Electrolytic DC Source Market, Global Business Strategies 2025-2032

Electrolytic DC Source Market size was valued at USD 183 million in 2024 to USD 213 million by 2032, exhibiting a CAGR of 2.3% during the forecast period

PDF Icon Download Sample Report PDF
  • Quick Dispatch

    All Orders

  • Secure Payment

    100% Secure Payment

Price range: $1,500.00 through $4,250.00

Clear

MARKET INSIGHTS

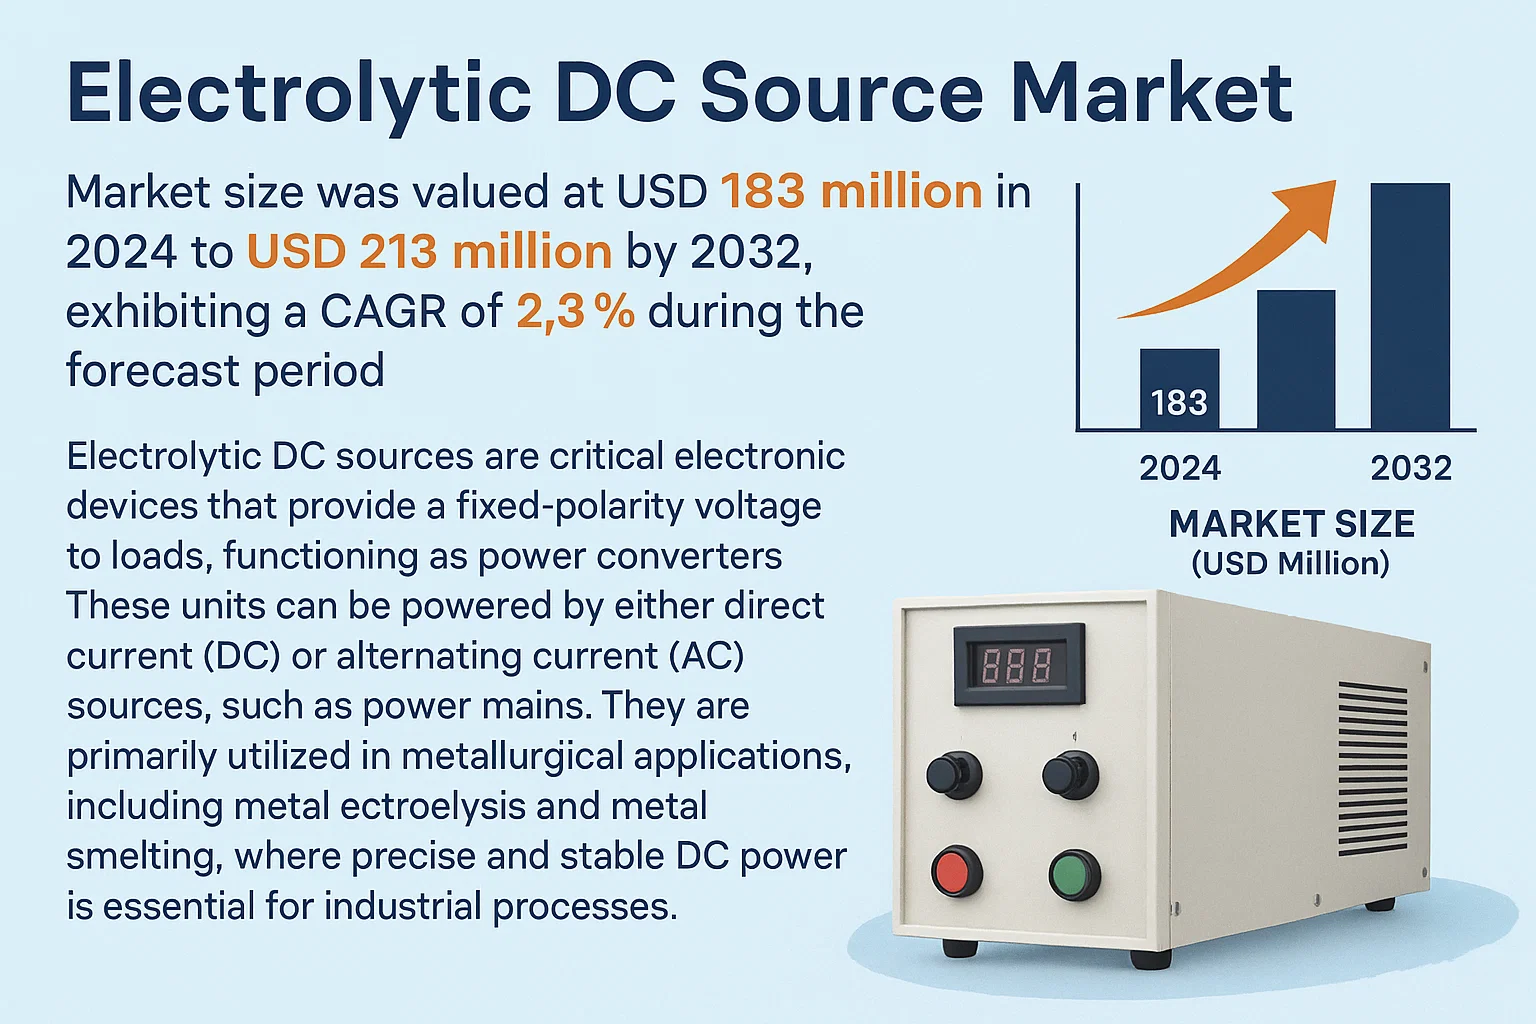
Global Electrolytic DC Source Market size was valued at USD 183 million in 2024 to USD 213 million by 2032, exhibiting a CAGR of 2.3% during the forecast period.

Electrolytic DC sources are critical electronic devices that provide a fixed-polarity voltage to loads, functioning as power converters. These units can be powered by either direct current (DC) or alternating current (AC) sources, such as power mains. They are primarily utilized in metallurgical applications, including metal electrolysis and metal smelting, where precise and stable DC power is essential for industrial processes.

The market growth is driven by increasing demand for efficient power solutions in metallurgical industries and advancements in electrolysis technologies. Key players such as Chiyoda Electronics (holding a 12% market share), AEG, and Kikusui dominate the competitive landscape. While the market remains steady, innovations in high-frequency switch and silicon-controlled rectifier technologies are expected to create new opportunities. The Asia-Pacific region, particularly China, leads in both production and consumption due to its robust metal processing sector.

Electrolytic DC Source Market

MARKET DRIVERS


Renewable Energy Integration Driving Demand

The global push towards decarbonization has accelerated the adoption of renewable energy sources like solar and wind, which primarily generate DC power. This requires efficient conversion and utilization through advanced electrolytic DC sources, significantly driving market growth.

High-Precision Manufacturing Requirements

Industries such as semiconductor manufacturing, aerospace, and medical devices require extremely precise and stable DC power supplies to ensure product quality and performance. This demand for high-precision electrolytic DC sources is a major driver across multiple sectors.

The transition to Industry 4.0 and smart manufacturing is increasing the demand for reliable and efficient power sources, including advanced electrolytic DC sources.

Additionally, the growth of electric vehicles and their charging infrastructure requires high-quality DC power, further driving market expansion.

MARKET CHALLENGES


High Initial Investment Costs

The advanced technology and materials required for high-performance electrolytic DC sources result in significantly higher initial costs compared to conventional power supplies. This can be a barrier for small and medium enterprises looking to adopt these systems.

Other Challenges

Technical Complexity in Voltage Stability
Maintaining stable voltage output across varying load conditions requires sophisticated control systems. This complexity increases both development costs and the need for specialized technical expertise, which can be challenging for manufacturers.

MARKET RESTRAINTS


Limited Adoption in Developing Regions

Despite global growth, the adoption of advanced electrolytic DC sources remains limited in many developing economies due to lack of technical expertise, infrastructure, and funding for large-scale projects. This creates a significant restraint on market expansion.

MARKET OPPORTUNITIES


Electric Vehicle Infrastructure Expansion

The rapid global expansion of electric vehicle adoption requires extensive charging infrastructure that relies on high-quality DC power. This creates substantial opportunities for advanced electrolytic DC sources in charging stations and battery management systems.

Growth in Renewable Energy Projects

As countries continue to invest in renewable energy projects, the need for efficient power conversion and management systems grows. This creates significant opportunities for advanced electrolytic DC sources in solar farms, wind farms, and grid stabilization projects.

Electrolytic DC Source Market Trends
Steady Market Growth Driven by Industrial Applications

The global Electrolytic DC Source market has demonstrated consistent growth, with market value reaching $183 million in 2024 and projected to reach $213 million by 2032, reflecting a compound annual growth rate (CAGR) of 2.3%. This growth is primarily driven by increasing adoption in metal processing industries and the expansion of industrial electrification projects worldwide.

Other Trends

Regional Market Expansion

Market analysis indicates significant growth in the Asia-Pacific region, particularly in China and India, where rapid industrialization and infrastructure development are driving demand for electro-chemical processing equipment. North America and Europe maintain strong market positions due to advanced manufacturing sectors and stringent environmental regulations requiring efficient energy utilization.

Technological Advancements and Efficiency Improvements

Recent technological advancements have focused on improving energy efficiency and reducing operational costs. Modern Electrolytic DC Sources now feature enhanced power conversion efficiency, reaching up to 95% in some models, while maintaining precise voltage and current control essential for sensitive industrial processes. These improvements contribute significantly to operational cost reduction in metal processing and electroplating industries.

Environmental Compliance Driving Innovation

The global push towards environmentally sustainable manufacturing has accelerated the adoption of energy-efficient Electrolytic DC Sources. Manufacturers are increasingly developing systems that minimize energy waste and reduce carbon footprint, aligning with international environmental standards and corporate sustainability initiatives. This trend is particularly evident in regions with strict environmental regulations, where industries are upgrading older, less efficient equipment with modern, energy-saving alternatives.

COMPETITIVE LANDSCAPE

Key Industry Players

Leading Players in Electrolytic DC Source Manufacturing

Chiyoda Electronics leads the global Electrolytic DC Source market with 12% market share, followed by Chroma and Kikusui as major competitors. These companies specialize in high-frequency switching and silicon-controlled rectifier technologies that dominate the industrial electrochemistry sector.

AEG Power Solutions and Darrah Electric have established strong positions in European and Asian markets respectively, offering specialized DC power solutions for metal processing applications. Emerging manufacturers from China, including Taision and Yueyang, are rapidly gaining market share through competitive pricing and technological innovation.

List of Key Electrolytic DC Source Manufacturers

  • Chiyoda Electronics
  • Chroma ATE Inc.
  • Kikusui Electronics
  • AEG Power Solutions
  • Darrah Electric
  • Taision
  • GERE
  • Yueyang
  • Ainuo
  • Kori
  • GooLee
  • Zhouyuan
  • Efficient Power
  • Nenghua
  • KaiDeLi

Segment Analysis:

Segment Category Sub-Segments Key Insights
By Type
  • Conventional Rectifier Systems
  • High-Frequency Switching Systems
  • Pulse-Width Modulation Systems
High-Frequency Switching Systems are gaining significant traction due to their superior energy efficiency and compact design. These systems enable more precise voltage regulation which is critical in sensitive electrolytic applications.
By Application
  • Electroplating and Metal Finishing
  • Wastewater Treatment and Electrolysis
  • Laboratory Research and Development
  • Semiconductor Manufacturing
Electroplating and Metal Finishing remains the dominant application segment due to the extensive use of electrolytic DC sources in decorative and industrial coating processes. The demand for precision metal finishing in automotive and electronics drives this segment.
By End User
  • Automotive Manufacturers
  • Industrial Machinery Manufacturers
  • Wastewater Treatment Plants
Industrial Machinery Manufacturers represent the most significant segment as they incorporate electrolytic DC sources into larger manufacturing systems. These manufacturers prioritize reliability and durability in harsh industrial environments.
By Power Rating
  • Low Power (Below 10kW)
  • Medium Power (10kW to 100kW)
  • High Power (Above 100kW)
Medium Power (10kW to 100kW) systems dominate the market as they offer the optimal balance between performance and cost-efficiency. These units provide sufficient power for most industrial applications without the excessive cost of high-power systems.
By Technology
  • Traditional Rectifier Technology
  • Switched-Mode Power Supply Technology
  • Hybrid Systems
Switched-Mode Power Supply Technology is increasingly adopted due to its superior efficiency and controllability. These systems allow for digital control interfaces which enable integration with modern industrial automation and control systems.

Regional Analysis: Electrolytic DC Source Market

Asia-Pacific

Asia-Pacific dominates the global electrolytic DC source market, accounting for over 45% of worldwide demand. This dominance stems from massive industrial expansion, particularly in China, India, and Southeast Asia, where rapid industrialization drives demand for electroplating, metal finishing, and electrochemical processing. The region benefits from strong government support for manufacturing and infrastructure development, with countries like South Korea and Japan leading in high-precision electrochemical applications. The market is characterized by intense competition among local manufacturers who offer cost-effective solutions while maintaining quality standards that meet international requirements.

Regional Manufacturing Hub
Asia-Pacific’s manufacturing dominance in electrochemical equipment creates natural advantage for DC source production. Local manufacturers leverage regional supply chains to produce units at competitive prices while maintaining technical specifications required by international markets. This positions the region as both primary consumer and leading producer.
Industrial Policy Influence
Government initiatives across Asia-Pacific actively promote advanced manufacturing and surface engineering, creating sustained demand for electrochemical equipment. Countries implement policies supporting domestic production of key components, reducing dependency on imports. This creates a self-reinforcing ecosystem where production and consumption grow simultaneously.
Technology Adoption Rate
Asia-Pacific demonstrates the fastest adoption rate for advanced electrochemical technologies, particularly in semiconductor fabrication and precision electroplating. This rapid adoption stems from aggressive investment in R&D and willingness to implement latest-generation equipment. The region leads in developing integrated solutions combining power supply units with automation and process control systems.
Specialization and Diversification
Different sub-regions specialize in particular market segments. China focuses on high-volume, cost-effective units for traditional industries while Japan and South Korea concentrate on high-precision, low-volume specialty applications. Southeast Asian manufacturers increasingly target niche markets with customized solutions. This diversification creates comprehensive market coverage across all application areas.

North America
North America maintains strong demand for high-performance electrolytic DC sources, particularly in aerospace, defense, and specialty chemical applications. The market is characterized by demand for cutting-edge technology with emphasis on reliability and precision. Canadian and U.S. manufacturers focus on developing specialized units with advanced control systems and integration capabilities. Environmental regulations influence design toward higher efficiency and reduced environmental impact. The market shows steady growth with particular strength in research applications and high-value manufacturing.

Europe
European market emphasizes sustainability and energy efficiency in electrochemical applications. Strict environmental regulations drive innovation in power supply design with focus on reducing energy consumption per unit of output. Germany leads in high-precision applications while Italy maintains strength in industrial-scale systems. The market shows consolidation trends with larger players acquiring specialized manufacturers. Eastern European countries show growing demand as manufacturing capabilities develop, though still significantly smaller than Western European markets.

South America
South American market shows steady growth particularly in mining and mineral processing applications. Chile, Peru, and Brazil represent largest markets with Chile showing particular strength in copper processing applications. Infrastructure development drives demand for industrial equipment while economic fluctuations create variable growth patterns. The region shows potential for future growth as industrial base develops, though currently remains smaller than other global regions.

Middle East & Africa
Middle East shows growing demand particularly in Gulf states where industrialization programs drive demand for electroplating and metal finishing equipment. African market remains limited with South Africa representing the most developed market, particularly in mining applications. The region shows highest growth potential as industrial development continues, though from a relatively small base. International manufacturers increasingly target these emerging markets with tailored solutions.

Report Scope

This report provides a comprehensive analysis of the global Electrolytic DC Source market, covering the forecast period 2025–2032. It offers detailed insights into market dynamics, technological advancements, competitive landscape, and key trends shaping the industry.

Key focus areas of the report include:

  • Market Overview: The report begins with an overview outlining the current market scenario, key growth indicators, and industry transformation drivers. It discusses macroeconomic factors, demand-supply balance, regulatory landscape, and the strategic role of power electronics in various industrial applications.
  • Market Size & Forecast: Historical data and future projections for revenue, unit shipments, and market value across major regions and segments.
  • Segmentation Analysis: Detailed breakdown by product type, technology, application, and end-user industry to identify high-growth segments and investment opportunities.
  • Regional Insights: Insights into market performance across North America, Europe, Asia-Pacific, Latin America, and the Middle East & Africa, including country-level analysis where relevant.
  • Competitive Landscape: Profiles of leading market participants, including their product offerings, R&D focus, manufacturing capacity, pricing strategies, and recent developments such as mergers, acquisitions, and partnerships.
  • Technology Trends & Innovation: Assessment of emerging technologies, integration of automation systems, semiconductor design trends, fabrication techniques, and evolving industry standards.
  • Market Drivers & Restraints: Evaluation of factors driving market growth along with challenges, supply chain constraints, regulatory issues, and market-entry barriers.
  • Stakeholder Insights: Insights for component suppliers, OEMs, system integrators, investors, and policymakers regarding the evolving ecosystem and strategic opportunities.

Primary and secondary research methods are employed, including interviews with industry experts, data from verified sources, and real-time market intelligence to ensure the accuracy and reliability of the insights presented.

FREQUENTLY ASKED QUESTIONS:

What is the current market size of Electrolytic DC Source Market?

-> Electrolytic DC Source Market size was valued at USD 183 million in 2024 to USD 213 million by 2032, exhibiting a CAGR of 2.3% during the forecast period.

Which key companies operate in Electrolytic DC Source Market?

-> Key players include Chiyoda Electronics, AEG, Chroma, Kikusui, and Darrah Electric, among others.

What is the growth rate of Electrolytic DC Source Market?

-> The market is expected to grow at a CAGR of 2.3% from 2024 to 2032.

What are the main applications of Electrolytic DC Source?

-> Main applications include metal electrolysis, metal smelting, electrical heating, and other industrial processes.

Which region has the largest market share?

-> Asia-Pacific currently holds the largest market share, followed by North America and Europe.

Electrolytic DC Source Market, Global Business Strategies 2025-2032

Get Sample Report PDF for Exclusive Insights

Report Sample Includes

  • Table of Contents
  • List of Tables & Figures
  • Charts, Research Methodology, and more...
PDF Icon Download Sample Report PDF

Download Sample Report

Table of Content

1 Introduction to Research & Analysis Reports
1.1 Electrolytic DC Source Market Definition
1.2 Market Segments
1.2.1 Segment by Type
1.2.2 Segment by Application
1.3 Global Electrolytic DC Source Market Overview
1.4 Features & Benefits of This Report
1.5 Methodology & Sources of Information
1.5.1 Research Methodology
1.5.2 Research Process
1.5.3 Base Year
1.5.4 Report Assumptions & Caveats
2 Global Electrolytic DC Source Overall Market Size
2.1 Global Electrolytic DC Source Market Size: 2024 VS 2032
2.2 Global Electrolytic DC Source Market Size, Prospects & Forecasts: 2020-2032
2.3 Global Electrolytic DC Source Sales: 2020-2032
3 Company Landscape
3.1 Top Electrolytic DC Source Players in Global Market
3.2 Top Global Electrolytic DC Source Companies Ranked by Revenue
3.3 Global Electrolytic DC Source Revenue by Companies
3.4 Global Electrolytic DC Source Sales by Companies
3.5 Global Electrolytic DC Source Price by Manufacturer (2020-2025)
3.6 Top 3 and Top 5 Electrolytic DC Source Companies in Global Market, by Revenue in 2024
3.7 Global Manufacturers Electrolytic DC Source Product Type
3.8 Tier 1, Tier 2, and Tier 3 Electrolytic DC Source Players in Global Market
3.8.1 List of Global Tier 1 Electrolytic DC Source Companies
3.8.2 List of Global Tier 2 and Tier 3 Electrolytic DC Source Companies
4 Sights by Product
4.1 Overview
4.1.1 Segment by Type – Global Electrolytic DC Source Market Size Markets, 2024 & 2032
4.1.2 High Frequency Switch Electrolytic DC Source
4.1.3 Silicon-Controlled Rectifier Electrolytic DC Source
4.2 Segment by Type – Global Electrolytic DC Source Revenue & Forecasts
4.2.1 Segment by Type – Global Electrolytic DC Source Revenue, 2020-2025
4.2.2 Segment by Type – Global Electrolytic DC Source Revenue, 2026-2032
4.2.3 Segment by Type – Global Electrolytic DC Source Revenue Market Share, 2020-2032
4.3 Segment by Type – Global Electrolytic DC Source Sales & Forecasts
4.3.1 Segment by Type – Global Electrolytic DC Source Sales, 2020-2025
4.3.2 Segment by Type – Global Electrolytic DC Source Sales, 2026-2032
4.3.3 Segment by Type – Global Electrolytic DC Source Sales Market Share, 2020-2032
4.4 Segment by Type – Global Electrolytic DC Source Price (Manufacturers Selling Prices), 2020-2032
5 Sights by Application
5.1 Overview
5.1.1 Segment by Application – Global Electrolytic DC Source Market Size, 2024 & 2032
5.1.2 Metal Electrolysis
5.1.3 Metal Smelting
5.1.4 Electrical Heating
5.1.5 Other
5.2 Segment by Application – Global Electrolytic DC Source Revenue & Forecasts
5.2.1 Segment by Application – Global Electrolytic DC Source Revenue, 2020-2025
5.2.2 Segment by Application – Global Electrolytic DC Source Revenue, 2026-2032
5.2.3 Segment by Application – Global Electrolytic DC Source Revenue Market Share, 2020-2032
5.3 Segment by Application – Global Electrolytic DC Source Sales & Forecasts
5.3.1 Segment by Application – Global Electrolytic DC Source Sales, 2020-2025
5.3.2 Segment by Application – Global Electrolytic DC Source Sales, 2026-2032
5.3.3 Segment by Application – Global Electrolytic DC Source Sales Market Share, 2020-2032
5.4 Segment by Application – Global Electrolytic DC Source Price (Manufacturers Selling Prices), 2020-2032
6 Sights by Region
6.1 By Region – Global Electrolytic DC Source Market Size, 2024 & 2032
6.2 By Region – Global Electrolytic DC Source Revenue & Forecasts
6.2.1 By Region – Global Electrolytic DC Source Revenue, 2020-2025
6.2.2 By Region – Global Electrolytic DC Source Revenue, 2026-2032
6.2.3 By Region – Global Electrolytic DC Source Revenue Market Share, 2020-2032
6.3 By Region – Global Electrolytic DC Source Sales & Forecasts
6.3.1 By Region – Global Electrolytic DC Source Sales, 2020-2025
6.3.2 By Region – Global Electrolytic DC Source Sales, 2026-2032
6.3.3 By Region – Global Electrolytic DC Source Sales Market Share, 2020-2032
6.4 North America
6.4.1 By Country – North America Electrolytic DC Source Revenue, 2020-2032
6.4.2 By Country – North America Electrolytic DC Source Sales, 2020-2032
6.4.3 United States Electrolytic DC Source Market Size, 2020-2032
6.4.4 Canada Electrolytic DC Source Market Size, 2020-2032
6.4.5 Mexico Electrolytic DC Source Market Size, 2020-2032
6.5 Europe
6.5.1 By Country – Europe Electrolytic DC Source Revenue, 2020-2032
6.5.2 By Country – Europe Electrolytic DC Source Sales, 2020-2032
6.5.3 Germany Electrolytic DC Source Market Size, 2020-2032
6.5.4 France Electrolytic DC Source Market Size, 2020-2032
6.5.5 U.K. Electrolytic DC Source Market Size, 2020-2032
6.5.6 Italy Electrolytic DC Source Market Size, 2020-2032
6.5.7 Russia Electrolytic DC Source Market Size, 2020-2032
6.5.8 Nordic Countries Electrolytic DC Source Market Size, 2020-2032
6.5.9 Benelux Electrolytic DC Source Market Size, 2020-2032
6.6 Asia
6.6.1 By Region – Asia Electrolytic DC Source Revenue, 2020-2032
6.6.2 By Region – Asia Electrolytic DC Source Sales, 2020-2032
6.6.3 China Electrolytic DC Source Market Size, 2020-2032
6.6.4 Japan Electrolytic DC Source Market Size, 2020-2032
6.6.5 South Korea Electrolytic DC Source Market Size, 2020-2032
6.6.6 Southeast Asia Electrolytic DC Source Market Size, 2020-2032
6.6.7 India Electrolytic DC Source Market Size, 2020-2032
6.7 South America
6.7.1 By Country – South America Electrolytic DC Source Revenue, 2020-2032
6.7.2 By Country – South America Electrolytic DC Source Sales, 2020-2032
6.7.3 Brazil Electrolytic DC Source Market Size, 2020-2032
6.7.4 Argentina Electrolytic DC Source Market Size, 2020-2032
6.8 Middle East & Africa
6.8.1 By Country – Middle East & Africa Electrolytic DC Source Revenue, 2020-2032
6.8.2 By Country – Middle East & Africa Electrolytic DC Source Sales, 2020-2032
6.8.3 Turkey Electrolytic DC Source Market Size, 2020-2032
6.8.4 Israel Electrolytic DC Source Market Size, 2020-2032
6.8.5 Saudi Arabia Electrolytic DC Source Market Size, 2020-2032
6.8.6 UAE Electrolytic DC Source Market Size, 2020-2032
7 Manufacturers & Brands Profiles
7.1 Chiyoda Electronics
7.1.1 Chiyoda Electronics Company Summary
7.1.2 Chiyoda Electronics Business Overview
7.1.3 Chiyoda Electronics Electrolytic DC Source Major Product Offerings
7.1.4 Chiyoda Electronics Electrolytic DC Source Sales and Revenue in Global (2020-2025)
7.1.5 Chiyoda Electronics Key News & Latest Developments
7.2 AEG
7.2.1 AEG Company Summary
7.2.2 AEG Business Overview
7.2.3 AEG Electrolytic DC Source Major Product Offerings
7.2.4 AEG Electrolytic DC Source Sales and Revenue in Global (2020-2025)
7.2.5 AEG Key News & Latest Developments
7.3 Chroma
7.3.1 Chroma Company Summary
7.3.2 Chroma Business Overview
7.3.3 Chroma Electrolytic DC Source Major Product Offerings
7.3.4 Chroma Electrolytic DC Source Sales and Revenue in Global (2020-2025)
7.3.5 Chroma Key News & Latest Developments
7.4 Kikusui
7.4.1 Kikusui Company Summary
7.4.2 Kikusui Business Overview
7.4.3 Kikusui Electrolytic DC Source Major Product Offerings
7.4.4 Kikusui Electrolytic DC Source Sales and Revenue in Global (2020-2025)
7.4.5 Kikusui Key News & Latest Developments
7.5 Darrah Electric
7.5.1 Darrah Electric Company Summary
7.5.2 Darrah Electric Business Overview
7.5.3 Darrah Electric Electrolytic DC Source Major Product Offerings
7.5.4 Darrah Electric Electrolytic DC Source Sales and Revenue in Global (2020-2025)
7.5.5 Darrah Electric Key News & Latest Developments
7.6 Taision
7.6.1 Taision Company Summary
7.6.2 Taision Business Overview
7.6.3 Taision Electrolytic DC Source Major Product Offerings
7.6.4 Taision Electrolytic DC Source Sales and Revenue in Global (2020-2025)
7.6.5 Taision Key News & Latest Developments
7.7 GERE
7.7.1 GERE Company Summary
7.7.2 GERE Business Overview
7.7.3 GERE Electrolytic DC Source Major Product Offerings
7.7.4 GERE Electrolytic DC Source Sales and Revenue in Global (2020-2025)
7.7.5 GERE Key News & Latest Developments
7.8 Yueyang
7.8.1 Yueyang Company Summary
7.8.2 Yueyang Business Overview
7.8.3 Yueyang Electrolytic DC Source Major Product Offerings
7.8.4 Yueyang Electrolytic DC Source Sales and Revenue in Global (2020-2025)
7.8.5 Yueyang Key News & Latest Developments
7.9 Ainuo
7.9.1 Ainuo Company Summary
7.9.2 Ainuo Business Overview
7.9.3 Ainuo Electrolytic DC Source Major Product Offerings
7.9.4 Ainuo Electrolytic DC Source Sales and Revenue in Global (2020-2025)
7.9.5 Ainuo Key News & Latest Developments
7.10 Kori
7.10.1 Kori Company Summary
7.10.2 Kori Business Overview
7.10.3 Kori Electrolytic DC Source Major Product Offerings
7.10.4 Kori Electrolytic DC Source Sales and Revenue in Global (2020-2025)
7.10.5 Kori Key News & Latest Developments
7.11 GooLee
7.11.1 GooLee Company Summary
7.11.2 GooLee Business Overview
7.11.3 GooLee Electrolytic DC Source Major Product Offerings
7.11.4 GooLee Electrolytic DC Source Sales and Revenue in Global (2020-2025)
7.11.5 GooLee Key News & Latest Developments
7.12 Zhouyuan
7.12.1 Zhouyuan Company Summary
7.12.2 Zhouyuan Business Overview
7.12.3 Zhouyuan Electrolytic DC Source Major Product Offerings
7.12.4 Zhouyuan Electrolytic DC Source Sales and Revenue in Global (2020-2025)
7.12.5 Zhouyuan Key News & Latest Developments
7.13 Efficient Power
7.13.1 Efficient Power Company Summary
7.13.2 Efficient Power Business Overview
7.13.3 Efficient Power Electrolytic DC Source Major Product Offerings
7.13.4 Efficient Power Electrolytic DC Source Sales and Revenue in Global (2020-2025)
7.13.5 Efficient Power Key News & Latest Developments
7.14 Nenghua
7.14.1 Nenghua Company Summary
7.14.2 Nenghua Business Overview
7.14.3 Nenghua Electrolytic DC Source Major Product Offerings
7.14.4 Nenghua Electrolytic DC Source Sales and Revenue in Global (2020-2025)
7.14.5 Nenghua Key News & Latest Developments
7.15 KaiDeLi
7.15.1 KaiDeLi Company Summary
7.15.2 KaiDeLi Business Overview
7.15.3 KaiDeLi Electrolytic DC Source Major Product Offerings
7.15.4 KaiDeLi Electrolytic DC Source Sales and Revenue in Global (2020-2025)
7.15.5 KaiDeLi Key News & Latest Developments
8 Global Electrolytic DC Source Production Capacity, Analysis
8.1 Global Electrolytic DC Source Production Capacity, 2020-2032
8.2 Electrolytic DC Source Production Capacity of Key Manufacturers in Global Market
8.3 Global Electrolytic DC Source Production by Region
9 Key Market Trends, Opportunity, Drivers and Restraints
9.1 Market Opportunities & Trends
9.2 Market Drivers
9.3 Market Restraints
10 Electrolytic DC Source Supply Chain Analysis
10.1 Electrolytic DC Source Industry Value Chain
10.2 Electrolytic DC Source Upstream Market
10.3 Electrolytic DC Source Downstream and Clients
10.4 Marketing Channels Analysis
10.4.1 Marketing Channels
10.4.2 Electrolytic DC Source Distributors and Sales Agents in Global
11 Conclusion
12 Appendix
12.1 Note
12.2 Examples of Clients
12.3 DisclaimerList of Tables
Table 1. Key Players of Electrolytic DC Source in Global Market
Table 2. Top Electrolytic DC Source Players in Global Market, Ranking by Revenue (2024)
Table 3. Global Electrolytic DC Source Revenue by Companies, (US$, Mn), 2020-2025
Table 4. Global Electrolytic DC Source Revenue Share by Companies, 2020-2025
Table 5. Global Electrolytic DC Source Sales by Companies, (Units), 2020-2025
Table 6. Global Electrolytic DC Source Sales Share by Companies, 2020-2025
Table 7. Key Manufacturers Electrolytic DC Source Price (2020-2025) & (USD/Unit)
Table 8. Global Manufacturers Electrolytic DC Source Product Type
Table 9. List of Global Tier 1 Electrolytic DC Source Companies, Revenue (US$, Mn) in 2024 and Market Share
Table 10. List of Global Tier 2 and Tier 3 Electrolytic DC Source Companies, Revenue (US$, Mn) in 2024 and Market Share
Table 11. Segment by Type – Global Electrolytic DC Source Revenue, (US$, Mn), 2024 & 2032
Table 12. Segment by Type – Global Electrolytic DC Source Revenue (US$, Mn), 2020-2025
Table 13. Segment by Type – Global Electrolytic DC Source Revenue (US$, Mn), 2026-2032
Table 14. Segment by Type – Global Electrolytic DC Source Sales (Units), 2020-2025
Table 15. Segment by Type – Global Electrolytic DC Source Sales (Units), 2026-2032
Table 16. Segment by Application – Global Electrolytic DC Source Revenue, (US$, Mn), 2024 & 2032
Table 17. Segment by Application – Global Electrolytic DC Source Revenue, (US$, Mn), 2020-2025
Table 18. Segment by Application – Global Electrolytic DC Source Revenue, (US$, Mn), 2026-2032
Table 19. Segment by Application – Global Electrolytic DC Source Sales, (Units), 2020-2025
Table 20. Segment by Application – Global Electrolytic DC Source Sales, (Units), 2026-2032
Table 21. By Region – Global Electrolytic DC Source Revenue, (US$, Mn), 2025-2032
Table 22. By Region – Global Electrolytic DC Source Revenue, (US$, Mn), 2020-2025
Table 23. By Region – Global Electrolytic DC Source Revenue, (US$, Mn), 2026-2032
Table 24. By Region – Global Electrolytic DC Source Sales, (Units), 2020-2025
Table 25. By Region – Global Electrolytic DC Source Sales, (Units), 2026-2032
Table 26. By Country – North America Electrolytic DC Source Revenue, (US$, Mn), 2020-2025
Table 27. By Country – North America Electrolytic DC Source Revenue, (US$, Mn), 2026-2032
Table 28. By Country – North America Electrolytic DC Source Sales, (Units), 2020-2025
Table 29. By Country – North America Electrolytic DC Source Sales, (Units), 2026-2032
Table 30. By Country – Europe Electrolytic DC Source Revenue, (US$, Mn), 2020-2025
Table 31. By Country – Europe Electrolytic DC Source Revenue, (US$, Mn), 2026-2032
Table 32. By Country – Europe Electrolytic DC Source Sales, (Units), 2020-2025
Table 33. By Country – Europe Electrolytic DC Source Sales, (Units), 2026-2032
Table 34. By Region – Asia Electrolytic DC Source Revenue, (US$, Mn), 2020-2025
Table 35. By Region – Asia Electrolytic DC Source Revenue, (US$, Mn), 2026-2032
Table 36. By Region – Asia Electrolytic DC Source Sales, (Units), 2020-2025
Table 37. By Region – Asia Electrolytic DC Source Sales, (Units), 2026-2032
Table 38. By Country – South America Electrolytic DC Source Revenue, (US$, Mn), 2020-2025
Table 39. By Country – South America Electrolytic DC Source Revenue, (US$, Mn), 2026-2032
Table 40. By Country – South America Electrolytic DC Source Sales, (Units), 2020-2025
Table 41. By Country – South America Electrolytic DC Source Sales, (Units), 2026-2032
Table 42. By Country – Middle East & Africa Electrolytic DC Source Revenue, (US$, Mn), 2020-2025
Table 43. By Country – Middle East & Africa Electrolytic DC Source Revenue, (US$, Mn), 2026-2032
Table 44. By Country – Middle East & Africa Electrolytic DC Source Sales, (Units), 2020-2025
Table 45. By Country – Middle East & Africa Electrolytic DC Source Sales, (Units), 2026-2032
Table 46. Chiyoda Electronics Company Summary
Table 47. Chiyoda Electronics Electrolytic DC Source Product Offerings
Table 48. Chiyoda Electronics Electrolytic DC Source Sales (Units), Revenue (US$, Mn) and Average Price (USD/Unit) & (2020-2025)
Table 49. Chiyoda Electronics Key News & Latest Developments
Table 50. AEG Company Summary
Table 51. AEG Electrolytic DC Source Product Offerings
Table 52. AEG Electrolytic DC Source Sales (Units), Revenue (US$, Mn) and Average Price (USD/Unit) & (2020-2025)
Table 53. AEG Key News & Latest Developments
Table 54. Chroma Company Summary
Table 55. Chroma Electrolytic DC Source Product Offerings
Table 56. Chroma Electrolytic DC Source Sales (Units), Revenue (US$, Mn) and Average Price (USD/Unit) & (2020-2025)
Table 57. Chroma Key News & Latest Developments
Table 58. Kikusui Company Summary
Table 59. Kikusui Electrolytic DC Source Product Offerings
Table 60. Kikusui Electrolytic DC Source Sales (Units), Revenue (US$, Mn) and Average Price (USD/Unit) & (2020-2025)
Table 61. Kikusui Key News & Latest Developments
Table 62. Darrah Electric Company Summary
Table 63. Darrah Electric Electrolytic DC Source Product Offerings
Table 64. Darrah Electric Electrolytic DC Source Sales (Units), Revenue (US$, Mn) and Average Price (USD/Unit) & (2020-2025)
Table 65. Darrah Electric Key News & Latest Developments
Table 66. Taision Company Summary
Table 67. Taision Electrolytic DC Source Product Offerings
Table 68. Taision Electrolytic DC Source Sales (Units), Revenue (US$, Mn) and Average Price (USD/Unit) & (2020-2025)
Table 69. Taision Key News & Latest Developments
Table 70. GERE Company Summary
Table 71. GERE Electrolytic DC Source Product Offerings
Table 72. GERE Electrolytic DC Source Sales (Units), Revenue (US$, Mn) and Average Price (USD/Unit) & (2020-2025)
Table 73. GERE Key News & Latest Developments
Table 74. Yueyang Company Summary
Table 75. Yueyang Electrolytic DC Source Product Offerings
Table 76. Yueyang Electrolytic DC Source Sales (Units), Revenue (US$, Mn) and Average Price (USD/Unit) & (2020-2025)
Table 77. Yueyang Key News & Latest Developments
Table 78. Ainuo Company Summary
Table 79. Ainuo Electrolytic DC Source Product Offerings
Table 80. Ainuo Electrolytic DC Source Sales (Units), Revenue (US$, Mn) and Average Price (USD/Unit) & (2020-2025)
Table 81. Ainuo Key News & Latest Developments
Table 82. Kori Company Summary
Table 83. Kori Electrolytic DC Source Product Offerings
Table 84. Kori Electrolytic DC Source Sales (Units), Revenue (US$, Mn) and Average Price (USD/Unit) & (2020-2025)
Table 85. Kori Key News & Latest Developments
Table 86. GooLee Company Summary
Table 87. GooLee Electrolytic DC Source Product Offerings
Table 88. GooLee Electrolytic DC Source Sales (Units), Revenue (US$, Mn) and Average Price (USD/Unit) & (2020-2025)
Table 89. GooLee Key News & Latest Developments
Table 90. Zhouyuan Company Summary
Table 91. Zhouyuan Electrolytic DC Source Product Offerings
Table 92. Zhouyuan Electrolytic DC Source Sales (Units), Revenue (US$, Mn) and Average Price (USD/Unit) & (2020-2025)
Table 93. Zhouyuan Key News & Latest Developments
Table 94. Efficient Power Company Summary
Table 95. Efficient Power Electrolytic DC Source Product Offerings
Table 96. Efficient Power Electrolytic DC Source Sales (Units), Revenue (US$, Mn) and Average Price (USD/Unit) & (2020-2025)
Table 97. Efficient Power Key News & Latest Developments
Table 98. Nenghua Company Summary
Table 99. Nenghua Electrolytic DC Source Product Offerings
Table 100. Nenghua Electrolytic DC Source Sales (Units), Revenue (US$, Mn) and Average Price (USD/Unit) & (2020-2025)
Table 101. Nenghua Key News & Latest Developments
Table 102. KaiDeLi Company Summary
Table 103. KaiDeLi Electrolytic DC Source Product Offerings
Table 104. KaiDeLi Electrolytic DC Source Sales (Units), Revenue (US$, Mn) and Average Price (USD/Unit) & (2020-2025)
Table 105. KaiDeLi Key News & Latest Developments
Table 106. Electrolytic DC Source Capacity of Key Manufacturers in Global Market, 2023-2025 (Units)
Table 107. Global Electrolytic DC Source Capacity Market Share of Key Manufacturers, 2023-2025
Table 108. Global Electrolytic DC Source Production by Region, 2020-2025 (Units)
Table 109. Global Electrolytic DC Source Production by Region, 2026-2032 (Units)
Table 110. Electrolytic DC Source Market Opportunities & Trends in Global Market
Table 111. Electrolytic DC Source Market Drivers in Global Market
Table 112. Electrolytic DC Source Market Restraints in Global Market
Table 113. Electrolytic DC Source Raw Materials
Table 114. Electrolytic DC Source Raw Materials Suppliers in Global Market
Table 115. Typical Electrolytic DC Source Downstream
Table 116. Electrolytic DC Source Downstream Clients in Global Market
Table 117. Electrolytic DC Source Distributors and Sales Agents in Global Market

List of Figures
Figure 1. Electrolytic DC Source Product Picture
Figure 2. Electrolytic DC Source Segment by Type in 2024
Figure 3. Electrolytic DC Source Segment by Application in 2024
Figure 4. Global Electrolytic DC Source Market Overview: 2024
Figure 5. Key Caveats
Figure 6. Global Electrolytic DC Source Market Size: 2024 VS 2032 (US$, Mn)
Figure 7. Global Electrolytic DC Source Revenue: 2020-2032 (US$, Mn)
Figure 8. Electrolytic DC Source Sales in Global Market: 2020-2032 (Units)
Figure 9. The Top 3 and 5 Players Market Share by Electrolytic DC Source Revenue in 2024
Figure 10. Segment by Type – Global Electrolytic DC Source Revenue, (US$, Mn), 2024 & 2032
Figure 11. Segment by Type – Global Electrolytic DC Source Revenue Market Share, 2020-2032
Figure 12. Segment by Type – Global Electrolytic DC Source Sales Market Share, 2020-2032
Figure 13. Segment by Type – Global Electrolytic DC Source Price (USD/Unit), 2020-2032
Figure 14. Segment by Application – Global Electrolytic DC Source Revenue, (US$, Mn), 2024 & 2032
Figure 15. Segment by Application – Global Electrolytic DC Source Revenue Market Share, 2020-2032
Figure 16. Segment by Application – Global Electrolytic DC Source Sales Market Share, 2020-2032
Figure 17. Segment by Application -Global Electrolytic DC Source Price (USD/Unit), 2020-2032
Figure 18. By Region – Global Electrolytic DC Source Revenue, (US$, Mn), 2025 & 2032
Figure 19. By Region – Global Electrolytic DC Source Revenue Market Share, 2020 VS 2024 VS 2032
Figure 20. By Region – Global Electrolytic DC Source Revenue Market Share, 2020-2032
Figure 21. By Region – Global Electrolytic DC Source Sales Market Share, 2020-2032
Figure 22. By Country – North America Electrolytic DC Source Revenue Market Share, 2020-2032
Figure 23. By Country – North America Electrolytic DC Source Sales Market Share, 2020-2032
Figure 24. United States Electrolytic DC Source Revenue, (US$, Mn), 2020-2032
Figure 25. Canada Electrolytic DC Source Revenue, (US$, Mn), 2020-2032
Figure 26. Mexico Electrolytic DC Source Revenue, (US$, Mn), 2020-2032
Figure 27. By Country – Europe Electrolytic DC Source Revenue Market Share, 2020-2032
Figure 28. By Country – Europe Electrolytic DC Source Sales Market Share, 2020-2032
Figure 29. Germany Electrolytic DC Source Revenue, (US$, Mn), 2020-2032
Figure 30. France Electrolytic DC Source Revenue, (US$, Mn), 2020-2032
Figure 31. U.K. Electrolytic DC Source Revenue, (US$, Mn), 2020-2032
Figure 32. Italy Electrolytic DC Source Revenue, (US$, Mn), 2020-2032
Figure 33. Russia Electrolytic DC Source Revenue, (US$, Mn), 2020-2032
Figure 34. Nordic Countries Electrolytic DC Source Revenue, (US$, Mn), 2020-2032
Figure 35. Benelux Electrolytic DC Source Revenue, (US$, Mn), 2020-2032
Figure 36. By Region – Asia Electrolytic DC Source Revenue Market Share, 2020-2032
Figure 37. By Region – Asia Electrolytic DC Source Sales Market Share, 2020-2032
Figure 38. China Electrolytic DC Source Revenue, (US$, Mn), 2020-2032
Figure 39. Japan Electrolytic DC Source Revenue, (US$, Mn), 2020-2032
Figure 40. South Korea Electrolytic DC Source Revenue, (US$, Mn), 2020-2032
Figure 41. Southeast Asia Electrolytic DC Source Revenue, (US$, Mn), 2020-2032
Figure 42. India Electrolytic DC Source Revenue, (US$, Mn), 2020-2032
Figure 43. By Country – South America Electrolytic DC Source Revenue Market Share, 2020-2032
Figure 44. By Country – South America Electrolytic DC Source Sales, Market Share, 2020-2032
Figure 45. Brazil Electrolytic DC Source Revenue, (US$, Mn), 2020-2032
Figure 46. Argentina Electrolytic DC Source Revenue, (US$, Mn), 2020-2032
Figure 47. By Country – Middle East & Africa Electrolytic DC Source Revenue, Market Share, 2020-2032
Figure 48. By Country – Middle East & Africa Electrolytic DC Source Sales, Market Share, 2020-2032
Figure 49. Turkey Electrolytic DC Source Revenue, (US$, Mn), 2020-2032
Figure 50. Israel Electrolytic DC Source Revenue, (US$, Mn), 2020-2032
Figure 51. Saudi Arabia Electrolytic DC Source Revenue, (US$, Mn), 2020-2032
Figure 52. UAE Electrolytic DC Source Revenue, (US$, Mn), 2020-2032
Figure 53. Global Electrolytic DC Source Production Capacity (Units), 2020-2032
Figure 54. The Percentage of Production Electrolytic DC Source by Region, 2024 VS 2032
Figure 55. Electrolytic DC Source Industry Value Chain
Figure 56. Marketing Channels