
MARKET INSIGHTS
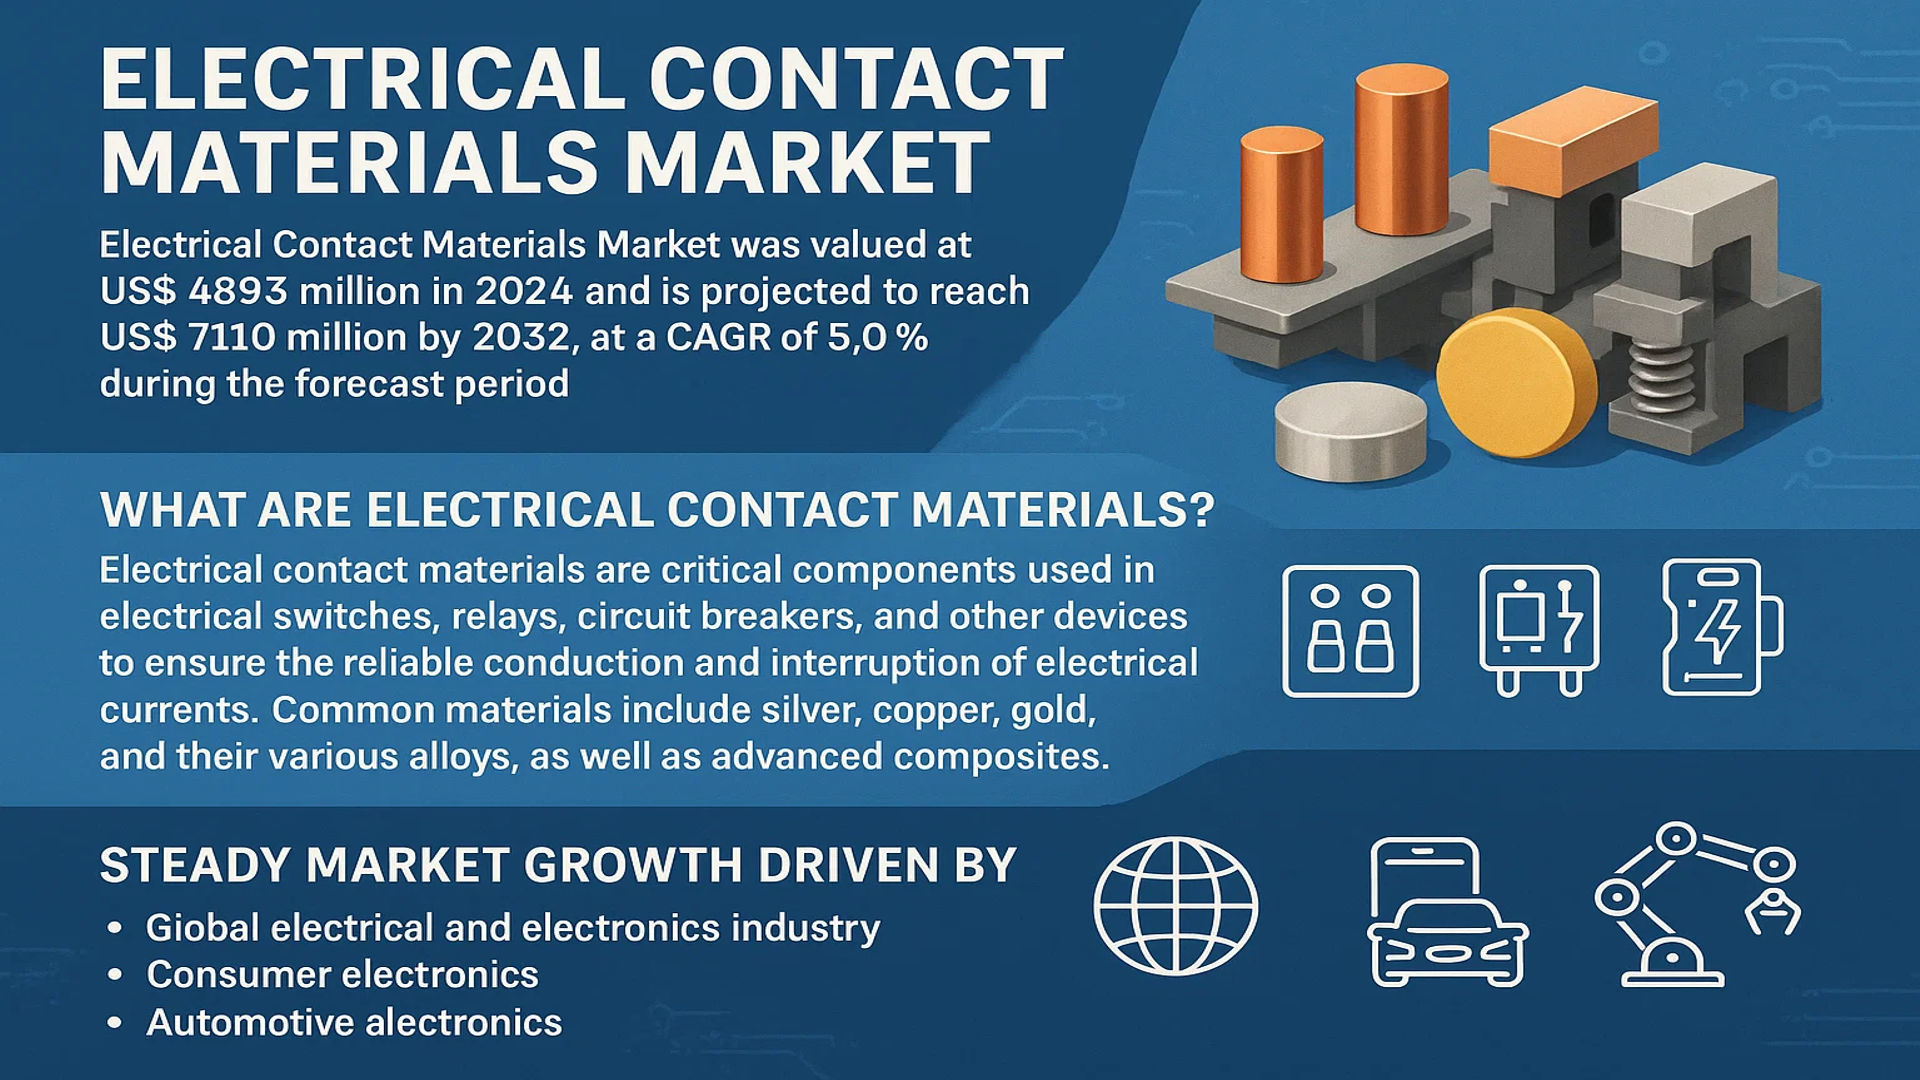
The global Electrical Contact Materials Market was valued at 4893 million in 2024 and is projected to reach US$ 7110 million by 2032, at a CAGR of 5.0% during the forecast period.
Electrical contact materials are critical components used in electrical switches, relays, circuit breakers, and other devices to ensure the reliable conduction and interruption of electrical currents. These materials are engineered to possess high electrical conductivity, excellent thermal properties, and superior resistance to wear and arc erosion. Common materials include silver, copper, gold, and their various alloys, as well as advanced composites.
The market is experiencing steady growth driven by the robust expansion of the global electrical and electronics industry, particularly in consumer electronics, automotive electronics, and industrial automation. Furthermore, the rapid adoption of renewable energy systems and the surge in electric vehicle production are creating significant demand for high-performance contact materials. While the market is promising, it faces challenges such as volatile raw material prices for precious metals and stringent environmental regulations restricting the use of hazardous substances like cadmium and lead.
MARKET DYNAMICS
MARKET DRIVERS
Expansion of Electrical & Electronics Industry to Propel Market Growth
The global electrical and electronics industry continues to experience robust growth, driving substantial demand for electrical contact materials. This expansion spans consumer electronics, automotive electronics, industrial automation systems, and telecommunications infrastructure. The consumer electronics sector alone represents over 40% of the total demand for electrical contact materials, with smartphones, laptops, and home appliances requiring increasingly sophisticated switching components. Industrial automation has witnessed particularly strong growth, with global industrial control and factory automation market revenues exceeding 200 billion dollars annually. This growth directly correlates with increased consumption of relays, switches, and circuit breakers that utilize high-performance contact materials. The proliferation of 5G infrastructure and Internet of Things devices further amplifies this demand, as these technologies require reliable electrical connections in both miniature and high-power applications.
Renewable Energy Sector Expansion to Accelerate Market Development
The global transition toward renewable energy represents a significant driver for electrical contact materials market growth. Solar and wind energy installations require extensive electrical switching and protection systems that utilize high-reliability contact materials. The solar energy sector alone has demonstrated remarkable growth, with global installed capacity increasing by approximately 25% annually over the past five years. Wind energy installations have shown similar expansion patterns, particularly in offshore wind farms that demand robust electrical components capable of withstanding harsh environmental conditions. These renewable energy systems utilize electrical contact materials in inverters, combiner boxes, circuit breakers, and switching devices. The increasing grid integration of renewable energy sources has further driven demand for advanced electrical contact materials in smart grid applications and energy storage systems, creating sustained market growth opportunities.
Electric Vehicle Revolution to Fuel Demand for High-Performance Contact Materials
The rapid global adoption of electric vehicles represents a transformative driver for electrical contact materials market growth. Electric vehicles utilize approximately 300% more electrical contacts compared to conventional internal combustion engine vehicles, primarily in battery management systems, power distribution units, charging systems, and motor controllers. The global electric vehicle market has experienced exponential growth, with annual sales increasing from 2.2 million units in 2019 to over 10 million units in 2023. This expansion directly translates to increased demand for silver-based and copper-based electrical contact materials that offer superior conductivity and reliability under high-current conditions. The development of fast-charging infrastructure further amplifies this demand, as charging stations require heavy-duty electrical contacts capable of handling currents exceeding 500 amps while maintaining performance over thousands of charging cycles.
Furthermore, automotive safety systems including advanced driver assistance systems and autonomous driving technologies increasingly rely on sophisticated electrical switching components, creating additional demand for specialized contact materials.
➤ For instance, major automotive manufacturers are investing approximately 300 billion dollars globally in electric vehicle development and production facilities, ensuring sustained demand for high-performance electrical contact materials throughout the automotive supply chain.
The convergence of these factors creates a powerful growth engine for the electrical contact materials market, with particular strength in silver-based composites and advanced copper alloys designed for automotive applications.
MARKET CHALLENGES
Precious Metal Price Volatility to Challenge Market Stability
The electrical contact materials market faces significant challenges from price volatility in precious metals, particularly silver which constitutes the primary material for high-performance contacts. Silver prices have demonstrated considerable fluctuation, with periodic price swings exceeding 30% within single calendar years. This volatility directly impacts production costs and profit margins for manufacturers, as silver typically represents 60-80% of the total material cost in silver-based electrical contacts. The market has experienced multiple instances where rapid price increases forced manufacturers to either absorb significant cost increases or implement price adjustments that strained customer relationships. This challenge is particularly acute in price-sensitive market segments such as consumer electronics and automotive components, where cost pressure remains intense.
Other Challenges
Environmental Compliance Requirements
Stringent environmental regulations governing hazardous substances present substantial challenges for market participants. Regulations restricting cadmium and lead content in electrical contact materials have necessitated extensive reformulation efforts and increased R&D expenditures. The transition to cadmium-free and lead-free alternatives has required capital investments exceeding 500 million dollars industry-wide over the past five years. Compliance with evolving regulations across different geographic markets adds complexity to global supply chains and product development strategies.
Technical Performance Demands
Increasing technical requirements for electrical contact materials create challenges in maintaining product performance while reducing costs. Modern applications demand materials that can withstand higher temperatures, greater electrical loads, and extended operational lifetimes. Developing materials that meet these requirements while maintaining cost competitiveness requires substantial investment in research and development, with leading manufacturers allocating 5-7% of annual revenues to R&D activities.
MARKET RESTRAINTS
High Technological Barriers to Limit New Market Entrants
The electrical contact materials market presents significant technological barriers that restrain market expansion and limit new participant entry. Developing and manufacturing high-performance electrical contact materials requires sophisticated metallurgical expertise, advanced manufacturing capabilities, and substantial capital investment. The industry’s technological complexity is evidenced by the fact that only approximately 15 companies worldwide possess the capability to produce premium-grade silver-cadmium oxide contacts, while even fewer can manufacture advanced nanocomposite materials. The capital investment required for establishing production facilities exceeds 50 million dollars for basic operations and can reach 200 million dollars for facilities capable of producing advanced materials. This high entry barrier protects established players but limits market expansion and innovation from new participants.
Additionally, the development cycle for new electrical contact materials typically spans 3-5 years from initial research to commercial production, requiring sustained investment without immediate returns. This extended development timeline, combined with the need for extensive testing and certification, creates significant financial barriers for potential new market entrants.
The specialized nature of required manufacturing equipment and the scarcity of technical expertise further compound these restraints, as the global pool of experienced metallurgists and materials scientists specializing in electrical contacts remains limited.
MARKET OPPORTUNITIES
Advanced Material Development to Unlock New Growth Opportunities
The development of advanced composite and nanomaterial technologies presents significant growth opportunities for the electrical contact materials market. Research in silver-metal oxide composites, carbon nanotube-enhanced materials, and graphene-based contacts has demonstrated potential for revolutionary performance improvements. These advanced materials offer enhanced electrical conductivity, improved arc erosion resistance, and extended operational lifetimes compared to conventional materials. The global nanotechnology market in electronics applications is projected to grow at approximately 15% annually, creating substantial opportunities for manufacturers who can successfully commercialize nanomaterial-enhanced electrical contacts. Recent breakthroughs in material science have enabled the development of contacts that demonstrate 40% longer service life while reducing silver content by up to 30%, addressing both performance requirements and cost pressures.
Additionally, the integration of smart manufacturing technologies including Industry 4.0 practices and artificial intelligence in material development and production processes creates opportunities for quality improvement and cost reduction. Advanced manufacturing techniques such as additive manufacturing and precision powder metallurgy enable production of complex contact geometries that were previously impossible to manufacture, opening new application possibilities in miniaturized electronics and high-density power distribution systems.
The growing emphasis on sustainability and circular economy principles further creates opportunities for developing recyclable and environmentally friendly contact materials, with potential for capturing premium market segments willing to pay for sustainable solutions.
ELECTRICAL CONTACT MATERIALS MARKET TRENDS
Advancements in High-Performance Materials to Emerge as a Trend in the Market
The global electrical contact materials market is witnessing a significant shift towards the development and adoption of high-performance materials, driven by the increasing demand for enhanced electrical conductivity, superior arc erosion resistance, and improved mechanical durability. Silver-based composites, particularly those reinforced with metal oxides like cadmium oxide or tin oxide, continue to dominate due to their exceptional performance in high-current applications. However, the market is increasingly moving towards cadmium-free alternatives because of stringent environmental regulations, with silver-zinc oxide and silver-tin oxide composites gaining substantial traction. Recent innovations include the integration of nanomaterials and carbon nanotubes to create composite materials that offer reduced material consumption while maintaining or even enhancing performance characteristics. This trend is particularly crucial as industries push for miniaturization and higher efficiency in electronic components, requiring contact materials that can operate reliably under increasingly demanding conditions.
Other Trends
Rise of Environmentally Sustainable Materials
The electrical contact materials industry is experiencing a fundamental transformation toward environmentally sustainable solutions, driven by global regulatory pressures and growing environmental consciousness among manufacturers and end-users. Regulations such as the Restriction of Hazardous Substances (RoHS) directive have accelerated the phase-out of cadmium and lead-based materials, which historically offered excellent performance but posed significant environmental and health risks. This regulatory environment has spurred substantial research and development into alternative materials that maintain performance while meeting environmental standards. Silver-metal oxide composites, particularly silver-tin oxide and silver-zinc oxide formulations, have emerged as leading replacements, capturing an estimated 40-45% of the global market for new applications. Furthermore, manufacturers are developing novel coating technologies and surface treatments that extend product lifespan, reduce material consumption, and minimize environmental impact throughout the product lifecycle.
Accelerated Adoption in Electric Vehicle and Renewable Energy Sectors
The rapid expansion of electric vehicle infrastructure and renewable energy systems is creating unprecedented demand for specialized electrical contact materials capable of withstanding extreme operating conditions. In the automotive sector, the transition to electric vehicles requires contact materials that can handle higher voltages, increased cycling frequencies, and more demanding environmental conditions compared to traditional combustion engine vehicles. This has led to the development of advanced silver-nickel and silver-graphite composites specifically designed for EV applications, with the automotive segment projected to grow at approximately 7-8% annually. Simultaneously, the renewable energy sector, particularly solar and wind power installations, requires contact materials that offer exceptional reliability and longevity in outdoor environments with varying temperatures and humidity levels. The expansion of smart grid technologies and energy storage systems further amplifies this demand, creating new application areas for specialized contact materials designed for high-reliability applications in critical infrastructure.
COMPETITIVE LANDSCAPE
Key Industry Players
Companies Focus on Material Innovation and Strategic Expansion to Maintain Competitive Edge
The global electrical contact materials market features a fragmented yet dynamic competitive environment, characterized by the presence of numerous established players and specialized manufacturers. The market’s structure is semi-consolidated, with a mix of large multinational corporations, mid-sized specialized firms, and smaller regional players vying for market share. This diversity fosters intense competition, primarily driven by technological innovation, product quality, and strategic global positioning.
Tanaka Holdings Co., Ltd. (Japan) is widely recognized as a dominant force in the market. The company’s leadership is anchored in its extensive expertise in precious metals and its comprehensive portfolio of high-performance silver-based and gold-based contact materials. Its significant investments in research and development for advanced composite materials and its strong distribution network across Asia, North America, and Europe solidify its top position.
Materion Corporation (U.S.) and Mitsubishi Materials Corporation (Japan) also command substantial market shares. Their growth is largely attributed to their vertically integrated operations, which provide control from raw material sourcing to finished product manufacturing. This integration, coupled with their focus on developing cadmium-free and environmentally compliant solutions, aligns perfectly with evolving regulatory demands and customer preferences for sustainable products.
Furthermore, these leading companies are actively pursuing growth through geographical expansion into emerging markets and strategic mergers and acquisitions. Such initiatives are designed to enhance their production capabilities, broaden their customer base, and secure access to new technologies, which is expected to further consolidate their market positions over the coming years.
Meanwhile, other significant players like Chugai Electric Industrial Co., Ltd. (Japan) and Saxonia Technical Materials GmbH (Germany) are strengthening their presence by concentrating on high-value niche applications. They are making considerable investments in R&D to create specialized contact materials for the automotive, renewable energy, and high-frequency electronics sectors, ensuring their continued relevance and growth within the competitive landscape.
List of Key Electrical Contact Materials Companies Profiled
- Tanaka Holdings Co., Ltd. (Japan)
- Materion Corporation (U.S.)
- Mitsubishi Materials Corporation (Japan)
- Chugai Electric Industrial Co., Ltd. (Japan)
- Saxonia Technical Materials GmbH (Germany)
- Fuda Alloy Materials Co., Ltd. (China)
- Wenzhou Hongfeng Electrical Alloy Co., Ltd. (China)
- LT Metal Co., Ltd. (South Korea)
- Longsun Technology Co., Ltd. (China)
- Foshan Tongbao Technology Co., Ltd. (China)
- Guilin Electrical Equipment Scientific Research Institute Co., Ltd. (China)
- Toshiba Materials Co., Ltd. (Japan)
- Nippon Tungsten Co., Ltd. (Japan)
- MW Components (U.S.)
- ZHJ Technologies (U.S.)
Segment Analysis:
By Type
Silver-based Materials Segment Dominates the Market Due to Superior Electrical Conductivity and Reliability
The market is segmented based on type into:
- Silver-based
- Subtypes: Fine silver, silver alloys (e.g., silver-nickel, silver-cadmium oxide), silver metal oxides
- Copper-based
- Subtypes: Pure copper, copper alloys (e.g., copper-tungsten, copper-chromium)
- Gold-based
- Tungsten-based
- Composite materials
- Subtypes: Silver-graphite, copper-graphite, others
- Others
By Application
Automotive Electronics Segment Leads Due to Rapid Electrification and Advanced Driver Assistance Systems
The market is segmented based on application into:
- Automotive electronics
- Consumer electronics
- Industrial equipment
- Renewable energy systems
- Power distribution systems
- Others
By End-User Industry
Electrical & Electronics Manufacturing Represents the Largest End-User Segment
The market is segmented based on end-user industry into:
- Electrical & electronics manufacturing
- Automotive
- Energy & power
- Aerospace & defense
- Telecommunications
- Others
By Material Form
Bulk Materials Segment Maintains Dominance for High-Current Applications
The market is segmented based on material form into:
- Bulk materials
- Thin films
- Coatings
- Laminates
- Others
Regional Analysis: Electrical Contact Materials Market
Asia-Pacific
The Asia-Pacific region is the undisputed leader in the global electrical contact materials market, accounting for over 55% of global consumption volume. This dominance is driven by its position as the world’s manufacturing hub for the electrical and electronics industry. China, Japan, and South Korea are the primary engines of growth. China’s massive industrial output, including consumer electronics, industrial automation equipment, and the world’s largest electric vehicle market, creates immense, sustained demand for silver-based and copper-based contact materials. Japan and South Korea contribute through their leadership in high-tech and automotive electronics, demanding advanced, high-performance materials. The region’s robust manufacturing infrastructure, coupled with significant investments in renewable energy projects, further accelerates market expansion. However, manufacturers face intense cost competition and are increasingly pressured to develop cadmium-free and lead-free alternatives to meet both international export standards and growing domestic environmental consciousness.
North America
The North American market is characterized by a strong focus on technological innovation and the adoption of high-performance, specialized materials. Demand is primarily driven by the region’s advanced automotive sector, particularly the rapid acceleration of electric vehicle production, and the modernization of power grid infrastructure. The United States, with significant investments in renewable energy and smart grid technologies, requires highly reliable contact materials for circuit breakers and switches used in solar and wind farms. The market is less price-sensitive and more focused on material properties such as superior arc erosion resistance and longevity. Key players like Materion and MW Components are based here, focusing on R&D for new composite materials and catering to the high-value segments of aerospace, defense, and medical equipment, where precision and reliability are paramount.
Europe
Europe’s market is heavily influenced by stringent environmental regulations, most notably the EU’s RoHS and REACH directives, which strictly limit the use of hazardous substances like cadmium and lead. This regulatory landscape has made the development and adoption of environmentally friendly contact materials a primary market driver rather than an option. There is a strong push towards silver-metal oxide composites and other cadmium-free alternatives. Furthermore, Europe’s strong automotive industry, with its rapid pivot towards electrification, and its ambitious renewable energy targets are significant demand drivers. Germany, a manufacturing powerhouse, and other Western European nations have a high concentration of manufacturers requiring premium materials for industrial automation, automotive relays, and circuit protection devices, supporting a market geared towards quality and compliance.
South America
The South American market for electrical contact materials is in a developing phase, presenting a mix of challenges and opportunities. Growth is primarily linked to gradual industrial expansion and infrastructure development in countries like Brazil and Argentina. The demand stems from basic electrical equipment manufacturing, construction, and maintenance of power distribution networks. However, the market’s growth is often tempered by economic volatility, which impacts investment in new industrial projects. Price sensitivity is high, leading to a stronger preference for conventional, cost-effective copper-based materials over more advanced, expensive alternatives. While environmental awareness is growing, regulatory enforcement is less stringent compared to North America or Europe, slowing the widespread adoption of eco-friendly contact materials. The market potential is significant but hinges on greater economic stability and increased industrial investment.
Middle East & Africa
This region represents an emerging market with long-term growth potential, though current demand is relatively modest. Development is driven by ongoing infrastructure projects, urbanization, and investments in power generation and distribution, particularly in Gulf Cooperation Council (GCC) nations like Saudi Arabia and the UAE. The demand is primarily for durable materials used in heavy-duty electrical applications, such as switches and circuit breakers for construction and utility sectors. However, market progress is constrained by factors including limited local manufacturing capabilities, which leads to a reliance on imports, and a focus on cost-effectiveness which prioritizes standard materials. The adoption of high-performance or environmentally specific materials is slow due to less developed regulatory frameworks. Nonetheless, as urban and industrial infrastructure continues to expand, the demand for reliable electrical contact materials is expected to rise steadily.
Report Scope
This market research report provides a comprehensive analysis of the global and regional Electrical Contact Materials markets, covering the forecast period 2025–2032. It offers detailed insights into market dynamics, technological advancements, competitive landscape, and key trends shaping the industry.
Key focus areas of the report include:
- Market Size & Forecast: Historical data and future projections for revenue, unit shipments, and market value across major regions and segments.
- Segmentation Analysis: Detailed breakdown by product type, technology, application, and end-user industry to identify high-growth segments and investment opportunities.
- Regional Outlook: Insights into market performance across North America, Europe, Asia-Pacific, Latin America, and the Middle East & Africa, including country-level analysis where relevant.
- Competitive Landscape: Profiles of leading market participants, including their product offerings, R&D focus, manufacturing capacity, pricing strategies, and recent developments such as mergers, acquisitions, and partnerships.
- Technology Trends & Innovation: Assessment of emerging technologies, integration of AI/IoT, semiconductor design trends, fabrication techniques, and evolving industry standards.
- Market Drivers & Restraints: Evaluation of factors driving market growth along with challenges, supply chain constraints, regulatory issues, and market-entry barriers.
- Stakeholder Analysis: Insights for component suppliers, OEMs, system integrators, investors, and policymakers regarding the evolving ecosystem and strategic opportunities.
Primary and secondary research methods are employed, including interviews with industry experts, data from verified sources, and real-time market intelligence to ensure the accuracy and reliability of the insights presented.
FREQUENTLY ASKED QUESTIONS:
What is the current market size of Global Electrical Contact Materials Market?
-> Electrical Contact Materials Market was valued at 4893 million in 2024 and is projected to reach US$ 7110 million by 2032, at a CAGR of 5.0% during the forecast period.
Which key companies operate in Global Electrical Contact Materials Market?
-> Key players include Tanaka, Materion, Mitsubishi Materials, Toshiba Materials, Saxonia, Nippon Tungsten, Chugai Electric, and MW Components, among others.
What are the key growth drivers?
-> Key growth drivers include expansion in electrical & electronics industry, renewable energy development, electric vehicle adoption, and integration of smart devices and IoT technologies.
Which region dominates the market?
-> Asia-Pacific is the largest and fastest-growing region, accounting for over 55% of global market share in 2024, driven by manufacturing hubs in China, Japan, and South Korea.
What are the emerging trends?
-> Emerging trends include development of cadmium-free and lead-free environmentally friendly materials, adoption of silver-based and copper-based composite materials, miniaturization of components, and integration of intelligent manufacturing technologies.

Get Sample Report PDF for Exclusive Insights
Report Sample Includes
- Table of Contents
- List of Tables & Figures
- Charts, Research Methodology, and more...



