
MARKET INSIGHTS
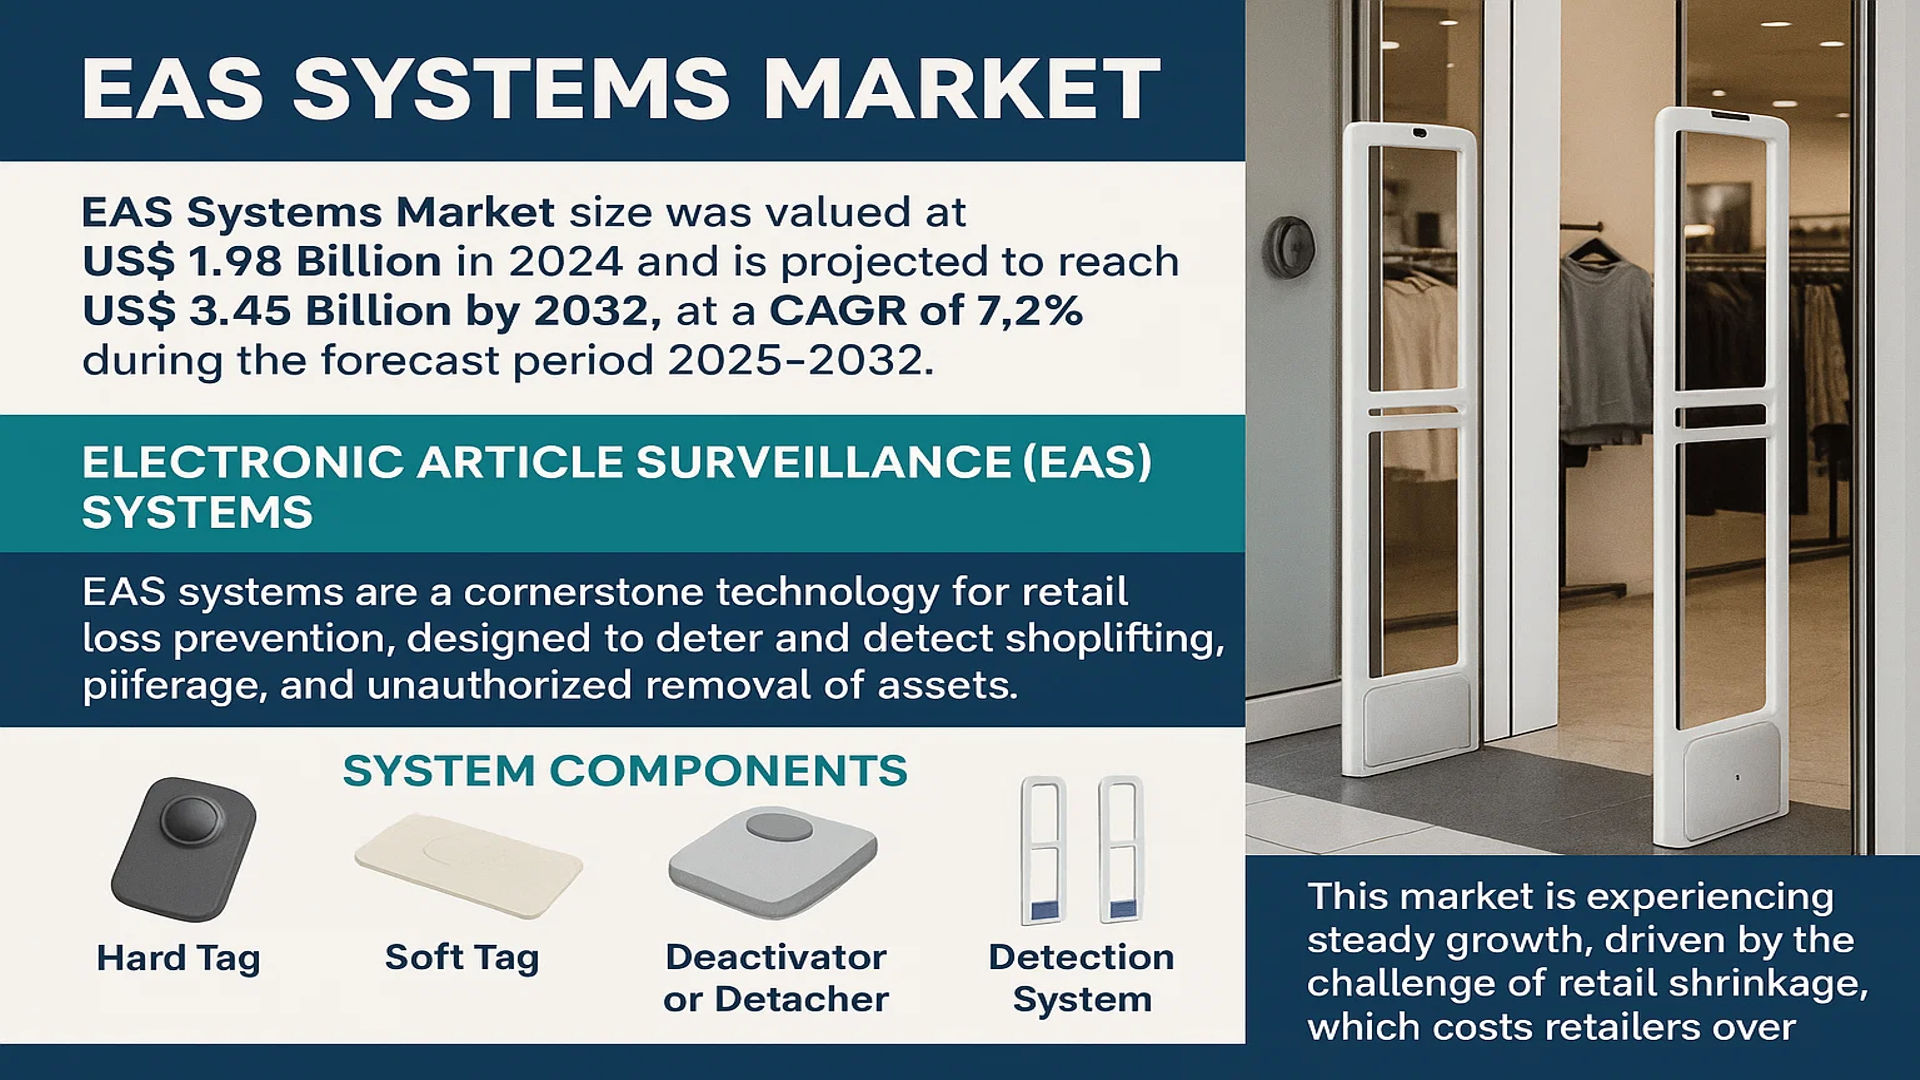
The global EAS Systems Market size was valued at US$ 1.98 billion in 2024 and is projected to reach US$ 3.45 billion by 2032, at a CAGR of 7.2% during the forecast period 2025-2032.
Electronic Article Surveillance (EAS) systems are a cornerstone technology for retail loss prevention, designed to deter and detect shoplifting, pilferage, and unauthorized removal of assets. These systems utilize specialized tags or labels affixed to merchandise, which are deactivated or removed at the point of sale. If an active tag passes through detection antennas positioned at store exits, an alarm is triggered, alerting staff to potential theft. The system components include Hard Tags, Soft Tags, Deactivators or Detachers, and the Detection System itself.
This market is experiencing steady growth, primarily driven by the persistent global challenge of retail shrinkage, which cost retailers over USD 100 billion annually according to industry analyses. The rising adoption of organized retail formats and the increasing need to protect high-value goods are significant contributors. Furthermore, technological advancements, such as the integration of RFID technology into EAS platforms for improved inventory management, are creating new growth avenues. Key players like Tyco Retail Solutions (now part of Johnson Controls), Checkpoint Systems, and Nedap lead the market with comprehensive and innovative security solutions.
MARKET DYNAMICS
MARKET DRIVERS
Escalating Retail Shrinkage Losses to Drive EAS Systems Adoption
Global retail shrinkage continues to represent a significant financial burden for retailers, with annual losses exceeding $100 billion worldwide. The National Retail Federation reports that shoplifting accounts for approximately 37% of these losses, creating substantial pressure on retailers to implement effective loss prevention solutions. Electronic Article Surveillance systems have demonstrated their effectiveness in reducing inventory shrinkage by up to 60-80% in various retail environments. This proven return on investment is driving widespread adoption across multiple retail segments, particularly as profit margins remain under pressure from rising operational costs and competitive pricing strategies. The increasing sophistication of organized retail crime networks, which account for nearly 50% of inventory shrinkage in some markets, further accelerates the demand for advanced EAS technologies that can deter theft and improve asset protection.
Technological Advancements in RFID Integration to Boost Market Growth
The integration of Radio Frequency Identification technology with traditional EAS systems represents a significant market driver, creating comprehensive inventory management solutions that go beyond basic theft prevention. Modern EAS systems now incorporate RFID capabilities that enable real-time inventory tracking, automated replenishment alerts, and enhanced customer analytics. This technological convergence allows retailers to achieve inventory accuracy rates exceeding 98%, compared to traditional manual counting methods that typically achieve only 60-70% accuracy. The ability to simultaneously prevent theft while optimizing inventory management creates compelling business cases for EAS system upgrades and new installations. Major retailers reporting annual inventory counts reduced from weeks to hours demonstrate the operational efficiency gains driving market expansion.
Expansion of Organized Retail Sector to Fuel Market Demand
The global expansion of organized retail infrastructure, particularly in emerging markets, creates substantial growth opportunities for EAS systems. Developing markets are experiencing retail space growth rates exceeding 15% annually, with modern retail formats increasingly dominating urban centers. This retail modernization requires sophisticated loss prevention strategies as stores transition from traditional family-run operations to large-format retail chains. The increasing store sizes, higher product densities, and reduced staff-to-customer ratios in modern retail environments create vulnerability points that EAS systems effectively address. Market data indicates that retail chains implementing comprehensive EAS solutions experience shrinkage rates 3-4 percentage points lower than unprotected stores, making these systems essential components of retail expansion strategies.
MARKET CHALLENGES
High Initial Investment and Maintenance Costs to Challenge Market Penetration
The substantial capital investment required for comprehensive EAS implementation presents significant challenges, particularly for small and medium-sized retailers. A complete EAS solution including detection systems, tags, deactivators, and installation can represent an investment ranging from $20,000 to $100,000 per store depending on size and requirements. This upfront cost, combined with ongoing expenses for tag replacement and system maintenance totaling 15-20% of initial investment annually, creates financial barriers for many potential adopters. The cost sensitivity is particularly acute in price-competitive retail segments where profit margins typically range from 2-5%, making capital allocation decisions increasingly difficult.
Other Challenges
System Reliability and False Alarm Issues
False alarm rates remain a persistent challenge for EAS systems, with industry data indicating that approximately 40-60% of alarms are triggered by non-theft events. These false activations can create customer inconvenience, reduce staff responsiveness to genuine alarms, and potentially damage customer relationships. The technical complexity of distinguishing between legitimate security threats and environmental interference continues to challenge system manufacturers, particularly in retail environments with high metal content or electronic interference.
Tagging Limitations and Product Compatibility
Physical limitations in tagging certain products, particularly metallic items, liquids, and products with complex packaging, create coverage gaps in EAS protection. Approximately 15-20% of retail products face tagging challenges that require specialized solutions or alternative security measures. This limitation forces retailers to implement hybrid security approaches, increasing both complexity and costs while potentially creating vulnerability points in their loss prevention strategies.
MARKET RESTRAINTS
Increasing Sophistication of Theft Methods to Restrain Market Effectiveness
The evolving sophistication of retail theft techniques presents significant restraints on EAS system effectiveness. Professional shoplifting groups have developed methods to bypass conventional EAS systems, including the use of booster bags that shield tags from detection, tag removal tools, and signal jamming devices. Industry reports indicate that organized retail crime groups account for approximately $45 billion in annual losses despite existing security measures. The constant technological arms race between security providers and thieves requires continuous system upgrades and additional investments, creating financial and operational burdens for retailers. This dynamic restrains market growth as some retailers question the long-term effectiveness of EAS investments against increasingly sophisticated theft operations.
Integration Complexity with Existing Retail Infrastructure to Deter Adoption
The complexity of integrating EAS systems with existing retail infrastructure and operations creates significant adoption barriers. Retail environments vary considerably in layout, construction materials, and existing technology systems, requiring customized EAS solutions for each implementation. The integration process often necessitates store modifications, staff training, and operational adjustments that can disrupt normal business activities. Many retailers report implementation periods of 2-4 weeks for comprehensive EAS installations, during which sales can be impacted by 5-10%. This operational disruption, combined with the need for ongoing system optimization, deters some retailers from pursuing EAS implementations despite the potential benefits.
MARKET OPPORTUNITIES
Integration with IoT and Smart Store Technologies to Create Growth Opportunities
The convergence of EAS systems with Internet of Things technologies and smart store infrastructure presents substantial growth opportunities. Modern EAS solutions are evolving beyond theft prevention to become integral components of comprehensive retail intelligence systems. These advanced systems can track customer movement patterns, analyze shopping behavior, and provide real-time inventory data while maintaining security functions. The integration capability allows retailers to achieve multiple objectives through a single infrastructure investment, improving return on investment calculations. Market analysis indicates that retailers utilizing integrated EAS and IoT solutions experience 25-30% higher operational efficiency compared to those using standalone systems.
Emerging Market Expansion and Retail Modernization to Drive Future Growth
The rapid retail modernization in emerging economies creates significant opportunities for EAS system providers. Markets across Asia-Pacific, Latin America, and Middle Eastern regions are experiencing retail growth rates exceeding 10% annually, with modern retail formats expanding into secondary and tertiary cities. This expansion requires sophisticated loss prevention solutions as retailers face new challenges in unfamiliar markets. The increasing foreign direct investment in retail sectors across these regions, coupled with growing consumer spending power, creates favorable conditions for EAS market expansion. Industry projections suggest that emerging markets will account for over 60% of new EAS installations during the forecast period.
Advanced Analytics and Artificial Intelligence Integration to Enhance System Value
The incorporation of artificial intelligence and predictive analytics into EAS systems creates new value propositions for retailers. Advanced systems can now analyze theft patterns, predict high-risk periods, and optimize security resource allocation based on real-time data. These capabilities transform EAS from reactive security tools to proactive business intelligence systems that contribute directly to revenue protection and operational efficiency. Retailers implementing AI-enhanced EAS solutions report 40-50% improvements in theft detection accuracy and 30% reductions in security staffing requirements. This technological advancement opens new market segments and creates upgrade opportunities within existing customer bases.
EAS SYSTEMS MARKET TRENDS
Integration of AI and IoT to Emerge as a Dominant Trend
The global EAS systems market is undergoing a significant transformation driven by the integration of Artificial Intelligence (AI) and the Internet of Things (IoT). This technological convergence is moving systems beyond simple alarm triggers towards intelligent, data-driven loss prevention platforms. Modern EAS solutions now leverage machine learning algorithms to analyze shopper behavior patterns, reducing false alarms by an estimated 40-60% and enhancing detection accuracy for actual theft attempts. Furthermore, IoT connectivity allows for real-time inventory tracking, providing retailers with unprecedented visibility into stock movement from the back room to the sales floor. This data is not only crucial for security but also for optimizing supply chain operations and improving overall retail efficiency, creating a compelling value proposition beyond traditional loss prevention.
Other Trends
Rising Organized Retail Crime (ORC)
The persistent and growing challenge of Organized Retail Crime (ORC) continues to be a primary catalyst for EAS market expansion. ORC groups target high-value, easily resalable goods such as electronics, designer apparel, and health supplements, leading to substantial financial losses for retailers. In response, there is a marked increase in the adoption of advanced, multi-layered security solutions that integrate EAS with video surveillance, electronic shelf labeling (ESL), and data analytics. This trend is particularly pronounced in the Supermarkets & Large Grocery segment, which holds the largest application share, as these stores carry a high volume of vulnerable products. The need to protect profitability is driving investments in more sophisticated and visible deterrents, making EAS a critical component of modern retail security strategies.
Shift Towards Source Tagging and RFID Integration
A fundamental operational shift within the market is the accelerated move towards source tagging and the incorporation of Radio-Frequency Identification (RFID) technology. Source tagging, where security tags are applied by the manufacturer rather than in-store, streamlines retail operations, reduces labor costs, and ensures near-100% tagging compliance. This practice is becoming an industry standard for many large retailers. Concurrently, the lines between traditional EAS and RFID are blurring. While Detection Systems remain the largest product segment, RFID-enabled solutions are gaining rapid traction because they offer dual functionality: theft prevention and sophisticated inventory management. This allows for real-time, item-level stock accuracy, which is revolutionizing loss prevention and moving the market from a purely security-focused model to an integrated, data-centric asset management ecosystem.
COMPETITIVE LANDSCAPE
Key Industry Players
Innovation and Strategic Expansion Define Market Leadership
The global Electronic Article Surveillance (EAS) Systems market exhibits a semi-consolidated competitive structure, characterized by the presence of several established multinational corporations alongside a number of specialized regional and niche players. The market’s valuation at US$ 1.98 billion in 2024 and its projected growth to US$ 3.45 billion by 2032 underscore a highly competitive environment where technological advancement and market penetration are paramount.
Tyco Retail Solutions, now operating under Johnson Controls, continues to be a dominant force, largely due to its comprehensive suite of loss prevention solutions and its extensive global service network. Their strength lies in offering integrated systems that combine EAS with advanced data analytics, providing retailers with not just security but valuable business intelligence. Similarly, Checkpoint Systems maintains a significant market share, bolstered by its innovative radio frequency (RF) and acousto-magnetic (AM) technologies, as well as its strong relationships with major retail chains worldwide.
Meanwhile, European players like Nedap have carved out a strong position by focusing on high-performance, reliable systems for the fashion and specialty retail sectors. Their growth is further supported by strategic partnerships and a continuous focus on R&D to enhance detection accuracy and reduce false alarms. Furthermore, companies such as Gunnebo Gateway are strengthening their foothold through portfolio diversification and targeting emerging markets, where retail modernization is driving demand for sophisticated security solutions.
The competitive dynamics are also influenced by the rising adoption of RFID-based systems, which offer inventory management benefits beyond traditional security. This technological shift is prompting key players to invest heavily in research and development to stay ahead. Companies are not only competing on product features but also on the ability to provide seamless integration with existing retail infrastructure and offer scalable, cost-effective solutions for businesses of all sizes.
List of Key EAS Systems Companies Profiled
- Tyco Retail Solutions (Ireland)
- Checkpoint Systems, Inc. (U.S.)
- Nedap N.V. (Netherlands)
- Universal Surveillance Systems (U.S.)
- Gunnebo Gateway (Sweden)
- SenTech Corporation (U.S.)
- Hangzhou Century Co., Ltd. (China)
- WGSPI (U.S.)
- Sentry Technology Corporation (U.S.)
- All Tag (U.S.)
- Amersec s.r.o. (Czech Republic)
Segment Analysis:
By Type
Detection System Segment Dominates the Market Due to its Critical Role in Loss Prevention
The market is segmented based on type into:
- Hard Tag
- Soft Tag
- Deactivator or Detacher
- Detection System
By Application
Supermarkets & Large Grocery Segment Leads Due to High Volume of Goods and Shrinkage Risks
The market is segmented based on application into:
- Clothing & Fashion Accessories
- Cosmetics/Pharmacy
- Supermarkets & Large Grocery
- Others
By End User
Retail Sector Holds the Largest Share Owing to Widespread Adoption for Asset Protection
The market is segmented based on end user into:
- Retail Stores
- Libraries
- Corporate Offices
- Others
By Technology
RFID Technology Gains Traction for its Enhanced Capabilities in Inventory Management
The market is segmented based on technology into:
- Acousto-Magnetic (AM)
- Electromagnetic (EM)
- Radio Frequency (RF)
- Radio Frequency Identification (RFID)
Regional Analysis: EAS Systems Market
Asia-Pacific
The Asia-Pacific region is the dominant force in the global EAS systems market, accounting for the highest volume consumption and the most rapid growth. This is driven by massive retail expansion, rapid urbanization, and the proliferation of modern shopping formats across key economies like China and India. The sheer scale of new supermarket and hypermarket openings, coupled with a heightened awareness of inventory shrinkage, creates sustained demand. While cost sensitivity leads to a significant market for conventional hard tags and detection systems, there is a clear and accelerating trend towards more sophisticated, integrated solutions, including RFID-enabled EAS, as major retail chains seek to improve inventory accuracy alongside loss prevention. The region is also a major manufacturing hub for EAS components, influencing global supply chains and competitive pricing.
North America
North America represents a mature yet highly advanced EAS market characterized by the adoption of cutting-edge, integrated security technologies. The region has a high penetration rate of EAS systems, driven by a large, established retail sector and one of the highest rates of retail shrinkage globally, which necessitates robust loss prevention strategies. The market is distinguished by a strong shift from standalone EAS to solutions that are fully integrated with broader store operations, including point-of-sale (POS) systems, inventory management, and customer analytics. This integration is fueled by the need for omnichannel retail efficiency and data-driven insights. Major players like Tyco Retail Solutions and Checkpoint Systems are headquartered here, driving innovation in source tagging, RFID, and data analytics platforms that go beyond traditional alarm-based detection.
Europe
Europe’s EAS market is defined by stringent data privacy regulations, such as the General Data Protection Regulation (GDPR), which influence how surveillance and data collection technologies are implemented. The region has a well-developed retail landscape where EAS is considered a standard fixture in most medium to large stores. Market growth is steady, primarily fueled by the retrofitting and upgrading of existing systems to more modern, efficient, and aesthetically discreet solutions. There is a significant emphasis on environmental sustainability, leading to increased demand for reusable and recyclable tag designs. Furthermore, the sophisticated fashion and cosmetics sectors, particularly in Western Europe, drive demand for specialized tags that protect high-value goods without damaging packaging or fabric.
South America
The South American EAS market is in a growth phase, presenting substantial opportunities alongside notable challenges. Economic volatility in key countries like Brazil and Argentina can lead to fluctuating investment cycles from retail chains, impacting the pace of new system deployments. The market is primarily cost-driven, with a strong preference for established, reliable hardware like electromagnetic (EM) and acousto-magnetic (AM) hard tags. While modern integrated solutions are gaining traction among large multinational retailers operating in the region, widespread adoption is hindered by budgetary constraints and a less mature retail infrastructure compared to North America or Europe. Nonetheless, the ongoing expansion of organized retail formats continues to be the primary driver for market growth.
Middle East & Africa
The EAS market in the Middle East & Africa is emerging and is characterized by significant regional disparity. Wealthier Gulf Cooperation Council (GCC) nations, such as the UAE and Saudi Arabia, are experiencing robust growth aligned with ambitious retail development projects and the establishment of luxury shopping destinations. These markets demonstrate a demand for high-end, integrated EAS solutions. In contrast, growth in other parts of the region is slower, constrained by economic factors and a less developed formal retail sector. Across the board, the market is opportunity-rich but requires suppliers to navigate diverse economic conditions, regulatory environments, and cultural approaches to retail security. The long-term outlook remains positive as urbanization and retail modernization continue.
Report Scope
This market research report provides a comprehensive analysis of the global and regional Electronic Article Surveillance (EAS) Systems markets, covering the forecast period 2025–2032. It offers detailed insights into market dynamics, technological advancements, competitive landscape, and key trends shaping the industry.
Key focus areas of the report include:
- Market Size & Forecast: Historical data and future projections for revenue, unit shipments, and market value across major regions and segments.
- Segmentation Analysis: Detailed breakdown by product type, technology, application, and end-user industry to identify high-growth segments and investment opportunities.
- Regional Outlook: Insights into market performance across North America, Europe, Asia-Pacific, Latin America, and the Middle East & Africa, including country-level analysis where relevant.
- Competitive Landscape: Profiles of leading market participants, including their product offerings, R&D focus, manufacturing capacity, pricing strategies, and recent developments such as mergers, acquisitions, and partnerships.
- Technology Trends & Innovation: Assessment of emerging technologies, integration of AI/IoT, RFID advancements, and evolving industry standards.
- Market Drivers & Restraints: Evaluation of factors driving market growth along with challenges, supply chain constraints, regulatory issues, and market-entry barriers.
- Stakeholder Analysis: Insights for component suppliers, OEMs, system integrators, investors, and policymakers regarding the evolving ecosystem and strategic opportunities.
Primary and secondary research methods are employed, including interviews with industry experts, data from verified sources, and real-time market intelligence to ensure the accuracy and reliability of the insights presented.
FREQUENTLY ASKED QUESTIONS:
What is the current market size of Global EAS Systems Market?
-> EAS Systems Market size was valued at US$ 1.98 billion in 2024 and is projected to reach US$ 3.45 billion by 2032, at a CAGR of 7.2% during the forecast period 2025-2032.
Which key companies operate in Global EAS Systems Market?
-> Key players include Tyco Retail Solutions, Checkpoint Systems, Nedap, Universal Surveillance Systems, and Gunnebo Gateway, among others.
What are the key growth drivers?
-> Key growth drivers include rising retail shrinkage, increasing adoption of automated loss prevention solutions, and growing investments in retail security infrastructure.
Which region dominates the market?
-> North America holds the largest market share, while Asia-Pacific is the fastest-growing region.
What are the emerging trends?
-> Emerging trends include integration of RFID technology, AI-powered analytics for theft prevention, and development of source tagging solutions.

Get Sample Report PDF for Exclusive Insights
Report Sample Includes
- Table of Contents
- List of Tables & Figures
- Charts, Research Methodology, and more...
 Download Sample Report PDF




