Global e-CON Connectors Market Trends, Business Strategies 2025-2032

Global e-CON Connectors market size was estimated at USD 106 million in 2023 and is projected to reach USD 160.26 million by 2032, exhibiting a CAGR of 4.70% during the forecast period

PDF Icon Download Sample Report PDF
  • Quick Dispatch

    All Orders

  • Secure Payment

    100% Secure Payment

Compare

$1,500.00$4,250.00

Clear

e-CON Connectors Market Overview

e-CON connectors are a high-performance industrial connector series designed to meet high-demand electronic and industrial applications. These connectors provide high-density connection solutions for compact arrangements in limited spaces, and have good durability to withstand harsh environmental conditions such as vibration and temperature changes. The design of e-CON connectors facilitates quick and easy installation and removal, improving production efficiency and convenience of maintenance. They are widely used in industrial automation, electronic equipment, automotive electronics and other fields, improving the stability and reliability of the system.

This report provides a deep insight into the global e-CON Connectors market covering all its essential aspects. This ranges from a macro overview of the market to micro details of the market size, competitive landscape, development trend, niche market, key market drivers and challenges, SWOT analysis, value chain analysis, etc.

The analysis helps the reader to shape the competition within the industries and strategies for the competitive environment to enhance the potential profit. Furthermore, it provides a simple framework for evaluating and accessing the position of the business organization. The report structure also focuses on the competitive landscape of the Global e-CON Connectors Market, this report introduces in detail the market share, market performance, product situation, operation situation, etc. of the main players, which helps the readers in the industry to identify the main competitors and deeply understand the competition pattern of the market.
In a word, this report is a must-read for industry players, investors, researchers, consultants, business strategists, and all those who have any kind of stake or are planning to foray into the e-CON Connectors market in any manner.

e-CON Connectors Market Analysis:

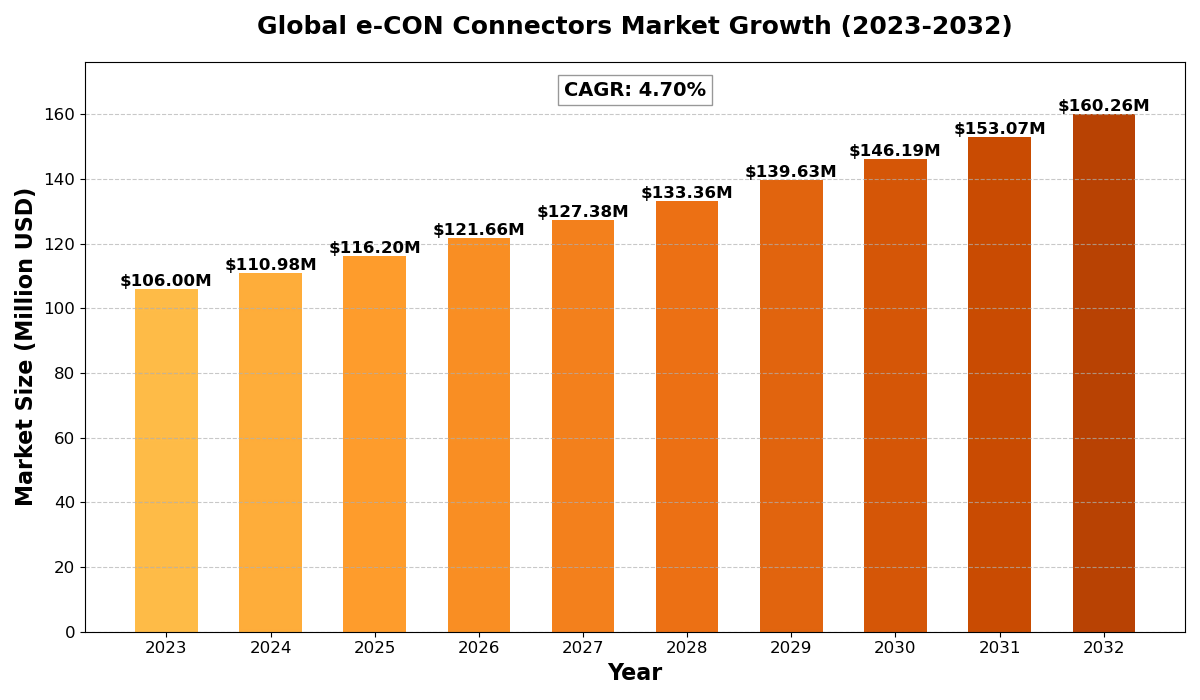
The global e-CON Connectors market size was estimated at USD 106 million in 2023 and is projected to reach USD 160.26 million by 2032, exhibiting a CAGR of 4.70% during the forecast period.

North America e-CON Connectors market size was estimated at USD 29.89 million in 2023, at a CAGR of 4.03% during the forecast period of 2025 through 2032.

e-CON Connectors Key Market Trends  

  1. Growing Demand in Automotive Sector
    The adoption of e-CON connectors in automotive electronics is surging due to advancements in autonomous vehicles and electric cars, enhancing connectivity and safety.
  2. Rising Popularity of IoT Devices
    The increasing number of IoT devices across industries has led to a higher demand for compact and reliable connectors, with e-CON connectors becoming a preferred choice.
  3. Shift Toward High-Speed Data Transmission
    The need for faster data transfer rates in industries like telecommunications and consumer electronics is driving the development of high-speed e-CON connectors.
  4. Miniaturization of Electronic Devices
    Trends in device miniaturization have boosted the demand for small yet durable connectors, positioning e-CON connectors as a key solution.
  5. Emphasis on Sustainability and Eco-Friendly Materials
    Manufacturers are focusing on eco-friendly materials and energy-efficient production methods for e-CON connectors to meet global sustainability goals.

e-CON Connectors Market Regional Analysis :

semi insight

  • North America:Strong demand driven by EVs, 5G infrastructure, and renewable energy, with the U.S. leading the market.
  • Europe:Growth fueled by automotive electrification, renewable energy, and strong regulatory support, with Germany as a key player.
  • Asia-Pacific:Dominates the market due to large-scale manufacturing in China and Japan, with growing demand from EVs, 5G, and semiconductors.
  • South America:Emerging market, driven by renewable energy and EV adoption, with Brazil leading growth.
  • Middle East & Africa:Gradual growth, mainly due to investments in renewable energy and EV infrastructure, with Saudi Arabia and UAE as key contributors.

e-CON Connectors Market Segmentation

The research report includes specific segments by region (country), manufacturers, Type, and Application. Market segmentation creates subsets of a market based on product type, end-user or application, Geographic, and other factors. By understanding the market segments, the decision-maker can leverage this targeting in the product, sales, and marketing strategies. Market segments can power your product development cycles by informing how you create product offerings for different segments.
Key Company

  • Omron
  • 3M
  • KEYENCE
  • TE Connectivity
  • TOYOGIKEN
  • YINGWEI
  • Jinling Electronics

Market Segmentation (by Type)

  • Plug
  • Socket

Market Segmentation (by Application)

  • Industrial
  • Electronics
  • Automotive
  • Others

Market Drivers

  1. Expanding Consumer Electronics Market
    The rapid growth in consumer electronics, such as smartphones and wearables, is driving demand for reliable and compact e-CON connectors.
  2. Increased Adoption in Industrial Automation
    The rise of Industry 4.0 and automation solutions has significantly increased the usage of e-CON connectors in industrial equipment.
  3. Advancements in Medical Devices
    Technological innovations in medical devices requiring high-precision connectivity are fueling the market for e-CON connectors.

Market Restraints

  1. High Manufacturing Costs
    The complex production processes and quality standards for e-CON connectors contribute to high manufacturing costs, affecting market penetration.
  2. Stringent Regulatory Compliance
    Adhering to global safety and quality regulations adds challenges for manufacturers, leading to increased costs and longer development cycles.
  3. Limited Durability in Harsh Environments
    e-CON connectors may face performance issues in extreme conditions, limiting their application in certain industrial sectors.

Market Opportunities

  1. Growing Demand in Emerging Markets
    Expanding industrial sectors in emerging economies present significant growth opportunities for e-CON connector manufacturers.
  2. Integration with Advanced Technologies
    The integration of e-CON connectors with technologies like AI and 5G is expected to open new market avenues.
  3. Development of Customizable Solutions
    Offering customizable and application-specific e-CON connectors can attract niche markets and drive revenue growth.

Market Challenges

  1. Intense Market Competition
    The presence of numerous global and regional players intensifies competition, leading to pricing pressures.
  2. Rapid Technological Advancements
    Keeping pace with fast-evolving technologies poses a challenge for manufacturers to stay competitive.
  3. Supply Chain Disruptions
    Global supply chain disruptions, especially in raw materials, can hinder production and impact market growth.

Key Benefits of This Market Research:

  • Industry drivers, restraints, and opportunities covered in the study
  • Neutral perspective on the market performance
  • Recent industry trends and developments
  • Competitive landscape & strategies of key players
  • Potential & niche segments and regions exhibiting promising growth covered
  • Historical, current, and projected market size, in terms of value
  • In-depth analysis of the e-CON Connectors Market
  • Overview of the regional outlook of the e-CON Connectors Market:

Key Reasons to Buy this Report:

  • Access to date statistics compiled by our researchers. These provide you with historical and forecast data, which is analyzed to tell you why your market is set to change
  • This enables you to anticipate market changes to remain ahead of your competitors
  • You will be able to copy data from the Excel spreadsheet straight into your marketing plans, business presentations, or other strategic documents
  • The concise analysis, clear graph, and table format will enable you to pinpoint the information you require quickly
  • Provision of market value data for each segment and sub-segment
  • Indicates the region and segment that is expected to witness the fastest growth as well as to dominate the market
  • Provides insight into the market through Value Chain
  • Market dynamics scenario, along with growth opportunities of the market in the years to come
  • 6-month post-sales analyst support

Customization of the Report
In case of any queries or customization requirements, please connect with our sales team, who will ensure that your requirements are met.

FAQs

Q: What are the key driving factors and opportunities in the e-CON connectors market?
A: Key drivers include the expanding consumer electronics market, increased industrial automation, and advancements in medical devices. Opportunities lie in emerging markets, integration with AI and 5G, and customizable solutions.


Q: Which region is projected to have the largest market share?
A: Asia-Pacific is expected to dominate the market due to its strong electronics manufacturing base and growing demand in automotive and industrial sectors.


Q: Who are the top players in the global e-CON connectors market?
A: Leading players include TE Connectivity, Molex, Hirose Electric, Amphenol Corporation, and JST Mfg. Co., Ltd.


Q: What are the latest technological advancements in the industry?
A: Innovations include the development of high-speed data connectors, miniaturized designs for compact devices, and eco-friendly materials for sustainable manufacturing.


Q: What is the current size of the global e-CON connectors market?
A: As of 2025, the global e-CON connectors market is valued at approximately USD XX billion and is projected to grow at a CAGR of XX% from 2025 to 2032.


Global e-CON Connectors Market Trends, Business Strategies 2025-2032

Get Sample Report PDF for Exclusive Insights

Report Sample Includes

  • Table of Contents
  • List of Tables & Figures
  • Charts, Research Methodology, and more...
PDF Icon Download Sample Report PDF

Download Sample Report

Table of Content

Table of Contents
1 Research Methodology and Statistical Scope
1.1 Market Definition and Statistical Scope of e-CON Connectors
1.2 Key Market Segments
1.2.1 e-CON Connectors Segment by Type
1.2.2 e-CON Connectors Segment by Application
1.3 Methodology & Sources of Information
1.3.1 Research Methodology
1.3.2 Research Process
1.3.3 Market Breakdown and Data Triangulation
1.3.4 Base Year
1.3.5 Report Assumptions & Caveats
2 e-CON Connectors Market Overview
2.1 Global Market Overview
2.1.1 Global e-CON Connectors Market Size (M USD) Estimates and Forecasts (2019-2032)
2.1.2 Global e-CON Connectors Sales Estimates and Forecasts (2019-2032)
2.2 Market Segment Executive Summary
2.3 Global Market Size by Region
3 e-CON Connectors Market Competitive Landscape
3.1 Global e-CON Connectors Sales by Manufacturers (2019-2025)
3.2 Global e-CON Connectors Revenue Market Share by Manufacturers (2019-2025)
3.3 e-CON Connectors Market Share by Company Type (Tier 1, Tier 2, and Tier 3)
3.4 Global e-CON Connectors Average Price by Manufacturers (2019-2025)
3.5 Manufacturers e-CON Connectors Sales Sites, Area Served, Product Type
3.6 e-CON Connectors Market Competitive Situation and Trends
3.6.1 e-CON Connectors Market Concentration Rate
3.6.2 Global 5 and 10 Largest e-CON Connectors Players Market Share by Revenue
3.6.3 Mergers & Acquisitions, Expansion
4 e-CON Connectors Industry Chain Analysis
4.1 e-CON Connectors Industry Chain Analysis
4.2 Market Overview of Key Raw Materials
4.3 Midstream Market Analysis
4.4 Downstream Customer Analysis
5 The Development and Dynamics of e-CON Connectors Market
5.1 Key Development Trends
5.2 Driving Factors
5.3 Market Challenges
5.4 Market Restraints
5.5 Industry News
5.5.1 New Product Developments
5.5.2 Mergers & Acquisitions
5.5.3 Expansions
5.5.4 Collaboration/Supply Contracts
5.6 Industry Policies
6 e-CON Connectors Market Segmentation by Type
6.1 Evaluation Matrix of Segment Market Development Potential (Type)
6.2 Global e-CON Connectors Sales Market Share by Type (2019-2025)
6.3 Global e-CON Connectors Market Size Market Share by Type (2019-2025)
6.4 Global e-CON Connectors Price by Type (2019-2025)
7 e-CON Connectors Market Segmentation by Application
7.1 Evaluation Matrix of Segment Market Development Potential (Application)
7.2 Global e-CON Connectors Market Sales by Application (2019-2025)
7.3 Global e-CON Connectors Market Size (M USD) by Application (2019-2025)
7.4 Global e-CON Connectors Sales Growth Rate by Application (2019-2025)
8 e-CON Connectors Market Consumption by Region
8.1 Global e-CON Connectors Sales by Region
8.1.1 Global e-CON Connectors Sales by Region
8.1.2 Global e-CON Connectors Sales Market Share by Region
8.2 North America
8.2.1 North America e-CON Connectors Sales by Country
8.2.2 U.S.
8.2.3 Canada
8.2.4 Mexico
8.3 Europe
8.3.1 Europe e-CON Connectors Sales by Country
8.3.2 Germany
8.3.3 France
8.3.4 U.K.
8.3.5 Italy
8.3.6 Russia
8.4 Asia Pacific
8.4.1 Asia Pacific e-CON Connectors Sales by Region
8.4.2 China
8.4.3 Japan
8.4.4 South Korea
8.4.5 India
8.4.6 Southeast Asia
8.5 South America
8.5.1 South America e-CON Connectors Sales by Country
8.5.2 Brazil
8.5.3 Argentina
8.5.4 Columbia
8.6 Middle East and Africa
8.6.1 Middle East and Africa e-CON Connectors Sales by Region
8.6.2 Saudi Arabia
8.6.3 UAE
8.6.4 Egypt
8.6.5 Nigeria
8.6.6 South Africa
9 e-CON Connectors Market Production by Region
9.1 Global Production of e-CON Connectors by Region (2019-2025)
9.2 Global e-CON Connectors Revenue Market Share by Region (2019-2025)
9.3 Global e-CON Connectors Production, Revenue, Price and Gross Margin (2019-2025)
9.4 North America e-CON Connectors Production
9.4.1 North America e-CON Connectors Production Growth Rate (2019-2025)
9.4.2 North America e-CON Connectors Production, Revenue, Price and Gross Margin (2019-2025)
9.5 Europe e-CON Connectors Production
9.5.1 Europe e-CON Connectors Production Growth Rate (2019-2025)
9.5.2 Europe e-CON Connectors Production, Revenue, Price and Gross Margin (2019-2025)
9.6 Japan e-CON Connectors Production (2019-2025)
9.6.1 Japan e-CON Connectors Production Growth Rate (2019-2025)
9.6.2 Japan e-CON Connectors Production, Revenue, Price and Gross Margin (2019-2025)
9.7 China e-CON Connectors Production (2019-2025)
9.7.1 China e-CON Connectors Production Growth Rate (2019-2025)
9.7.2 China e-CON Connectors Production, Revenue, Price and Gross Margin (2019-2025)
10 Key Companies Profile
10.1 Omron
10.1.1 Omron e-CON Connectors Basic Information
10.1.2 Omron e-CON Connectors Product Overview
10.1.3 Omron e-CON Connectors Product Market Performance
10.1.4 Omron Business Overview
10.1.5 Omron e-CON Connectors SWOT Analysis
10.1.6 Omron Recent Developments
10.2 3M
10.2.1 3M e-CON Connectors Basic Information
10.2.2 3M e-CON Connectors Product Overview
10.2.3 3M e-CON Connectors Product Market Performance
10.2.4 3M Business Overview
10.2.5 3M e-CON Connectors SWOT Analysis
10.2.6 3M Recent Developments
10.3 KEYENCE
10.3.1 KEYENCE e-CON Connectors Basic Information
10.3.2 KEYENCE e-CON Connectors Product Overview
10.3.3 KEYENCE e-CON Connectors Product Market Performance
10.3.4 KEYENCE e-CON Connectors SWOT Analysis
10.3.5 KEYENCE Business Overview
10.3.6 KEYENCE Recent Developments
10.4 TE Connectivity
10.4.1 TE Connectivity e-CON Connectors Basic Information
10.4.2 TE Connectivity e-CON Connectors Product Overview
10.4.3 TE Connectivity e-CON Connectors Product Market Performance
10.4.4 TE Connectivity Business Overview
10.4.5 TE Connectivity Recent Developments
10.5 TOYOGIKEN
10.5.1 TOYOGIKEN e-CON Connectors Basic Information
10.5.2 TOYOGIKEN e-CON Connectors Product Overview
10.5.3 TOYOGIKEN e-CON Connectors Product Market Performance
10.5.4 TOYOGIKEN Business Overview
10.5.5 TOYOGIKEN Recent Developments
10.6 YINGWEI
10.6.1 YINGWEI e-CON Connectors Basic Information
10.6.2 YINGWEI e-CON Connectors Product Overview
10.6.3 YINGWEI e-CON Connectors Product Market Performance
10.6.4 YINGWEI Business Overview
10.6.5 YINGWEI Recent Developments
10.7 Jinling Electronics
10.7.1 Jinling Electronics e-CON Connectors Basic Information
10.7.2 Jinling Electronics e-CON Connectors Product Overview
10.7.3 Jinling Electronics e-CON Connectors Product Market Performance
10.7.4 Jinling Electronics Business Overview
10.7.5 Jinling Electronics Recent Developments
11 e-CON Connectors Market Forecast by Region
11.1 Global e-CON Connectors Market Size Forecast
11.2 Global e-CON Connectors Market Forecast by Region
11.2.1 North America Market Size Forecast by Country
11.2.2 Europe e-CON Connectors Market Size Forecast by Country
11.2.3 Asia Pacific e-CON Connectors Market Size Forecast by Region
11.2.4 South America e-CON Connectors Market Size Forecast by Country
11.2.5 Middle East and Africa Forecasted Consumption of e-CON Connectors by Country
12 Forecast Market by Type and by Application (2025-2032)
12.1 Global e-CON Connectors Market Forecast by Type (2025-2032)
12.1.1 Global Forecasted Sales of e-CON Connectors by Type (2025-2032)
12.1.2 Global e-CON Connectors Market Size Forecast by Type (2025-2032)
12.1.3 Global Forecasted Price of e-CON Connectors by Type (2025-2032)
12.2 Global e-CON Connectors Market Forecast by Application (2025-2032)
12.2.1 Global e-CON Connectors Sales (K Units) Forecast by Application
12.2.2 Global e-CON Connectors Market Size (M USD) Forecast by Application (2025-2032)
13 Conclusion and Key FindingsList of Tables
Table 1. Introduction of the Type
Table 2. Introduction of the Application
Table 3. Market Size (M USD) Segment Executive Summary
Table 4. e-CON Connectors Market Size Comparison by Region (M USD)
Table 5. Global e-CON Connectors Sales (K Units) by Manufacturers (2019-2025)
Table 6. Global e-CON Connectors Sales Market Share by Manufacturers (2019-2025)
Table 7. Global e-CON Connectors Revenue (M USD) by Manufacturers (2019-2025)
Table 8. Global e-CON Connectors Revenue Share by Manufacturers (2019-2025)
Table 9. Company Type (Tier 1, Tier 2, and Tier 3) & (based on the Revenue in e-CON Connectors as of 2022)
Table 10. Global Market e-CON Connectors Average Price (USD/Unit) of Key Manufacturers (2019-2025)
Table 11. Manufacturers e-CON Connectors Sales Sites and Area Served
Table 12. Manufacturers e-CON Connectors Product Type
Table 13. Global e-CON Connectors Manufacturers Market Concentration Ratio (CR5 and HHI)
Table 14. Mergers & Acquisitions, Expansion Plans
Table 15. Industry Chain Map of e-CON Connectors
Table 16. Market Overview of Key Raw Materials
Table 17. Midstream Market Analysis
Table 18. Downstream Customer Analysis
Table 19. Key Development Trends
Table 20. Driving Factors
Table 21. e-CON Connectors Market Challenges
Table 22. Global e-CON Connectors Sales by Type (K Units)
Table 23. Global e-CON Connectors Market Size by Type (M USD)
Table 24. Global e-CON Connectors Sales (K Units) by Type (2019-2025)
Table 25. Global e-CON Connectors Sales Market Share by Type (2019-2025)
Table 26. Global e-CON Connectors Market Size (M USD) by Type (2019-2025)
Table 27. Global e-CON Connectors Market Size Share by Type (2019-2025)
Table 28. Global e-CON Connectors Price (USD/Unit) by Type (2019-2025)
Table 29. Global e-CON Connectors Sales (K Units) by Application
Table 30. Global e-CON Connectors Market Size by Application
Table 31. Global e-CON Connectors Sales by Application (2019-2025) & (K Units)
Table 32. Global e-CON Connectors Sales Market Share by Application (2019-2025)
Table 33. Global e-CON Connectors Sales by Application (2019-2025) & (M USD)
Table 34. Global e-CON Connectors Market Share by Application (2019-2025)
Table 35. Global e-CON Connectors Sales Growth Rate by Application (2019-2025)
Table 36. Global e-CON Connectors Sales by Region (2019-2025) & (K Units)
Table 37. Global e-CON Connectors Sales Market Share by Region (2019-2025)
Table 38. North America e-CON Connectors Sales by Country (2019-2025) & (K Units)
Table 39. Europe e-CON Connectors Sales by Country (2019-2025) & (K Units)
Table 40. Asia Pacific e-CON Connectors Sales by Region (2019-2025) & (K Units)
Table 41. South America e-CON Connectors Sales by Country (2019-2025) & (K Units)
Table 42. Middle East and Africa e-CON Connectors Sales by Region (2019-2025) & (K Units)
Table 43. Global e-CON Connectors Production (K Units) by Region (2019-2025)
Table 44. Global e-CON Connectors Revenue (US$ Million) by Region (2019-2025)
Table 45. Global e-CON Connectors Revenue Market Share by Region (2019-2025)
Table 46. Global e-CON Connectors Production (K Units), Revenue (US$ Million), Price (USD/Unit) and Gross Margin (2019-2025)
Table 47. North America e-CON Connectors Production (K Units), Revenue (US$ Million), Price (USD/Unit) and Gross Margin (2019-2025)
Table 48. Europe e-CON Connectors Production (K Units), Revenue (US$ Million), Price (USD/Unit) and Gross Margin (2019-2025)
Table 49. Japan e-CON Connectors Production (K Units), Revenue (US$ Million), Price (USD/Unit) and Gross Margin (2019-2025)
Table 50. China e-CON Connectors Production (K Units), Revenue (US$ Million), Price (USD/Unit) and Gross Margin (2019-2025)
Table 51. Omron e-CON Connectors Basic Information
Table 52. Omron e-CON Connectors Product Overview
Table 53. Omron e-CON Connectors Sales (K Units), Revenue (M USD), Price (USD/Unit) and Gross Margin (2019-2025)
Table 54. Omron Business Overview
Table 55. Omron e-CON Connectors SWOT Analysis
Table 56. Omron Recent Developments
Table 57. 3M e-CON Connectors Basic Information
Table 58. 3M e-CON Connectors Product Overview
Table 59. 3M e-CON Connectors Sales (K Units), Revenue (M USD), Price (USD/Unit) and Gross Margin (2019-2025)
Table 60. 3M Business Overview
Table 61. 3M e-CON Connectors SWOT Analysis
Table 62. 3M Recent Developments
Table 63. KEYENCE e-CON Connectors Basic Information
Table 64. KEYENCE e-CON Connectors Product Overview
Table 65. KEYENCE e-CON Connectors Sales (K Units), Revenue (M USD), Price (USD/Unit) and Gross Margin (2019-2025)
Table 66. KEYENCE e-CON Connectors SWOT Analysis
Table 67. KEYENCE Business Overview
Table 68. KEYENCE Recent Developments
Table 69. TE Connectivity e-CON Connectors Basic Information
Table 70. TE Connectivity e-CON Connectors Product Overview
Table 71. TE Connectivity e-CON Connectors Sales (K Units), Revenue (M USD), Price (USD/Unit) and Gross Margin (2019-2025)
Table 72. TE Connectivity Business Overview
Table 73. TE Connectivity Recent Developments
Table 74. TOYOGIKEN e-CON Connectors Basic Information
Table 75. TOYOGIKEN e-CON Connectors Product Overview
Table 76. TOYOGIKEN e-CON Connectors Sales (K Units), Revenue (M USD), Price (USD/Unit) and Gross Margin (2019-2025)
Table 77. TOYOGIKEN Business Overview
Table 78. TOYOGIKEN Recent Developments
Table 79. YINGWEI e-CON Connectors Basic Information
Table 80. YINGWEI e-CON Connectors Product Overview
Table 81. YINGWEI e-CON Connectors Sales (K Units), Revenue (M USD), Price (USD/Unit) and Gross Margin (2019-2025)
Table 82. YINGWEI Business Overview
Table 83. YINGWEI Recent Developments
Table 84. Jinling Electronics e-CON Connectors Basic Information
Table 85. Jinling Electronics e-CON Connectors Product Overview
Table 86. Jinling Electronics e-CON Connectors Sales (K Units), Revenue (M USD), Price (USD/Unit) and Gross Margin (2019-2025)
Table 87. Jinling Electronics Business Overview
Table 88. Jinling Electronics Recent Developments
Table 89. Global e-CON Connectors Sales Forecast by Region (2025-2032) & (K Units)
Table 90. Global e-CON Connectors Market Size Forecast by Region (2025-2032) & (M USD)
Table 91. North America e-CON Connectors Sales Forecast by Country (2025-2032) & (K Units)
Table 92. North America e-CON Connectors Market Size Forecast by Country (2025-2032) & (M USD)
Table 93. Europe e-CON Connectors Sales Forecast by Country (2025-2032) & (K Units)
Table 94. Europe e-CON Connectors Market Size Forecast by Country (2025-2032) & (M USD)
Table 95. Asia Pacific e-CON Connectors Sales Forecast by Region (2025-2032) & (K Units)
Table 96. Asia Pacific e-CON Connectors Market Size Forecast by Region (2025-2032) & (M USD)
Table 97. South America e-CON Connectors Sales Forecast by Country (2025-2032) & (K Units)
Table 98. South America e-CON Connectors Market Size Forecast by Country (2025-2032) & (M USD)
Table 99. Middle East and Africa e-CON Connectors Consumption Forecast by Country (2025-2032) & (Units)
Table 100. Middle East and Africa e-CON Connectors Market Size Forecast by Country (2025-2032) & (M USD)
Table 101. Global e-CON Connectors Sales Forecast by Type (2025-2032) & (K Units)
Table 102. Global e-CON Connectors Market Size Forecast by Type (2025-2032) & (M USD)
Table 103. Global e-CON Connectors Price Forecast by Type (2025-2032) & (USD/Unit)
Table 104. Global e-CON Connectors Sales (K Units) Forecast by Application (2025-2032)
Table 105. Global e-CON Connectors Market Size Forecast by Application (2025-2032) & (M USD)
List of Figures
Figure 1. Product Picture of e-CON Connectors
Figure 2. Data Triangulation
Figure 3. Key Caveats
Figure 4. Global e-CON Connectors Market Size (M USD), 2019-2032
Figure 5. Global e-CON Connectors Market Size (M USD) (2019-2032)
Figure 6. Global e-CON Connectors Sales (K Units) & (2019-2032)
Figure 7. Evaluation Matrix of Segment Market Development Potential (Type)
Figure 8. Evaluation Matrix of Segment Market Development Potential (Application)
Figure 9. Evaluation Matrix of Regional Market Development Potential
Figure 10. e-CON Connectors Market Size by Country (M USD)
Figure 11. e-CON Connectors Sales Share by Manufacturers in 2023
Figure 12. Global e-CON Connectors Revenue Share by Manufacturers in 2023
Figure 13. e-CON Connectors Market Share by Company Type (Tier 1, Tier 2 and Tier 3): 2023
Figure 14. Global Market e-CON Connectors Average Price (USD/Unit) of Key Manufacturers in 2023
Figure 15. The Global 5 and 10 Largest Players: Market Share by e-CON Connectors Revenue in 2023
Figure 16. Evaluation Matrix of Segment Market Development Potential (Type)
Figure 17. Global e-CON Connectors Market Share by Type
Figure 18. Sales Market Share of e-CON Connectors by Type (2019-2025)
Figure 19. Sales Market Share of e-CON Connectors by Type in 2023
Figure 20. Market Size Share of e-CON Connectors by Type (2019-2025)
Figure 21. Market Size Market Share of e-CON Connectors by Type in 2023
Figure 22. Evaluation Matrix of Segment Market Development Potential (Application)
Figure 23. Global e-CON Connectors Market Share by Application
Figure 24. Global e-CON Connectors Sales Market Share by Application (2019-2025)
Figure 25. Global e-CON Connectors Sales Market Share by Application in 2023
Figure 26. Global e-CON Connectors Market Share by Application (2019-2025)
Figure 27. Global e-CON Connectors Market Share by Application in 2023
Figure 28. Global e-CON Connectors Sales Growth Rate by Application (2019-2025)
Figure 29. Global e-CON Connectors Sales Market Share by Region (2019-2025)
Figure 30. North America e-CON Connectors Sales and Growth Rate (2019-2025) & (K Units)
Figure 31. North America e-CON Connectors Sales Market Share by Country in 2023
Figure 32. U.S. e-CON Connectors Sales and Growth Rate (2019-2025) & (K Units)
Figure 33. Canada e-CON Connectors Sales (K Units) and Growth Rate (2019-2025)
Figure 34. Mexico e-CON Connectors Sales (Units) and Growth Rate (2019-2025)
Figure 35. Europe e-CON Connectors Sales and Growth Rate (2019-2025) & (K Units)
Figure 36. Europe e-CON Connectors Sales Market Share by Country in 2023
Figure 37. Germany e-CON Connectors Sales and Growth Rate (2019-2025) & (K Units)
Figure 38. France e-CON Connectors Sales and Growth Rate (2019-2025) & (K Units)
Figure 39. U.K. e-CON Connectors Sales and Growth Rate (2019-2025) & (K Units)
Figure 40. Italy e-CON Connectors Sales and Growth Rate (2019-2025) & (K Units)
Figure 41. Russia e-CON Connectors Sales and Growth Rate (2019-2025) & (K Units)
Figure 42. Asia Pacific e-CON Connectors Sales and Growth Rate (K Units)
Figure 43. Asia Pacific e-CON Connectors Sales Market Share by Region in 2023
Figure 44. China e-CON Connectors Sales and Growth Rate (2019-2025) & (K Units)
Figure 45. Japan e-CON Connectors Sales and Growth Rate (2019-2025) & (K Units)
Figure 46. South Korea e-CON Connectors Sales and Growth Rate (2019-2025) & (K Units)
Figure 47. India e-CON Connectors Sales and Growth Rate (2019-2025) & (K Units)
Figure 48. Southeast Asia e-CON Connectors Sales and Growth Rate (2019-2025) & (K Units)
Figure 49. South America e-CON Connectors Sales and Growth Rate (K Units)
Figure 50. South America e-CON Connectors Sales Market Share by Country in 2023
Figure 51. Brazil e-CON Connectors Sales and Growth Rate (2019-2025) & (K Units)
Figure 52. Argentina e-CON Connectors Sales and Growth Rate (2019-2025) & (K Units)
Figure 53. Columbia e-CON Connectors Sales and Growth Rate (2019-2025) & (K Units)
Figure 54. Middle East and Africa e-CON Connectors Sales and Growth Rate (K Units)
Figure 55. Middle East and Africa e-CON Connectors Sales Market Share by Region in 2023
Figure 56. Saudi Arabia e-CON Connectors Sales and Growth Rate (2019-2025) & (K Units)
Figure 57. UAE e-CON Connectors Sales and Growth Rate (2019-2025) & (K Units)
Figure 58. Egypt e-CON Connectors Sales and Growth Rate (2019-2025) & (K Units)
Figure 59. Nigeria e-CON Connectors Sales and Growth Rate (2019-2025) & (K Units)
Figure 60. South Africa e-CON Connectors Sales and Growth Rate (2019-2025) & (K Units)
Figure 61. Global e-CON Connectors Production Market Share by Region (2019-2025)
Figure 62. North America e-CON Connectors Production (K Units) Growth Rate (2019-2025)
Figure 63. Europe e-CON Connectors Production (K Units) Growth Rate (2019-2025)
Figure 64. Japan e-CON Connectors Production (K Units) Growth Rate (2019-2025)
Figure 65. China e-CON Connectors Production (K Units) Growth Rate (2019-2025)
Figure 66. Global e-CON Connectors Sales Forecast by Volume (2019-2032) & (K Units)
Figure 67. Global e-CON Connectors Market Size Forecast by Value (2019-2032) & (M USD)
Figure 68. Global e-CON Connectors Sales Market Share Forecast by Type (2025-2032)
Figure 69. Global e-CON Connectors Market Share Forecast by Type (2025-2032)
Figure 70. Global e-CON Connectors Sales Forecast by Application (2025-2032)
Figure 71. Global e-CON Connectors Market Share Forecast by Application (2025-2032)