Dust Sensors Market, Global Business Strategies 2026-2033

Dust Sensors Market size was valued at USD 434 million in 2025. The market is projected to grow from USD 456 million in 2026 to USD 631 million by 2033, exhibiting a CAGR of 5.6% during the forecast period.

PDF Icon Download Sample Report PDF
  • Quick Dispatch

    All Orders

  • Secure Payment

    100% Secure Payment

Price range: $1,500.00 through $4,250.00

Clear

Market Insights

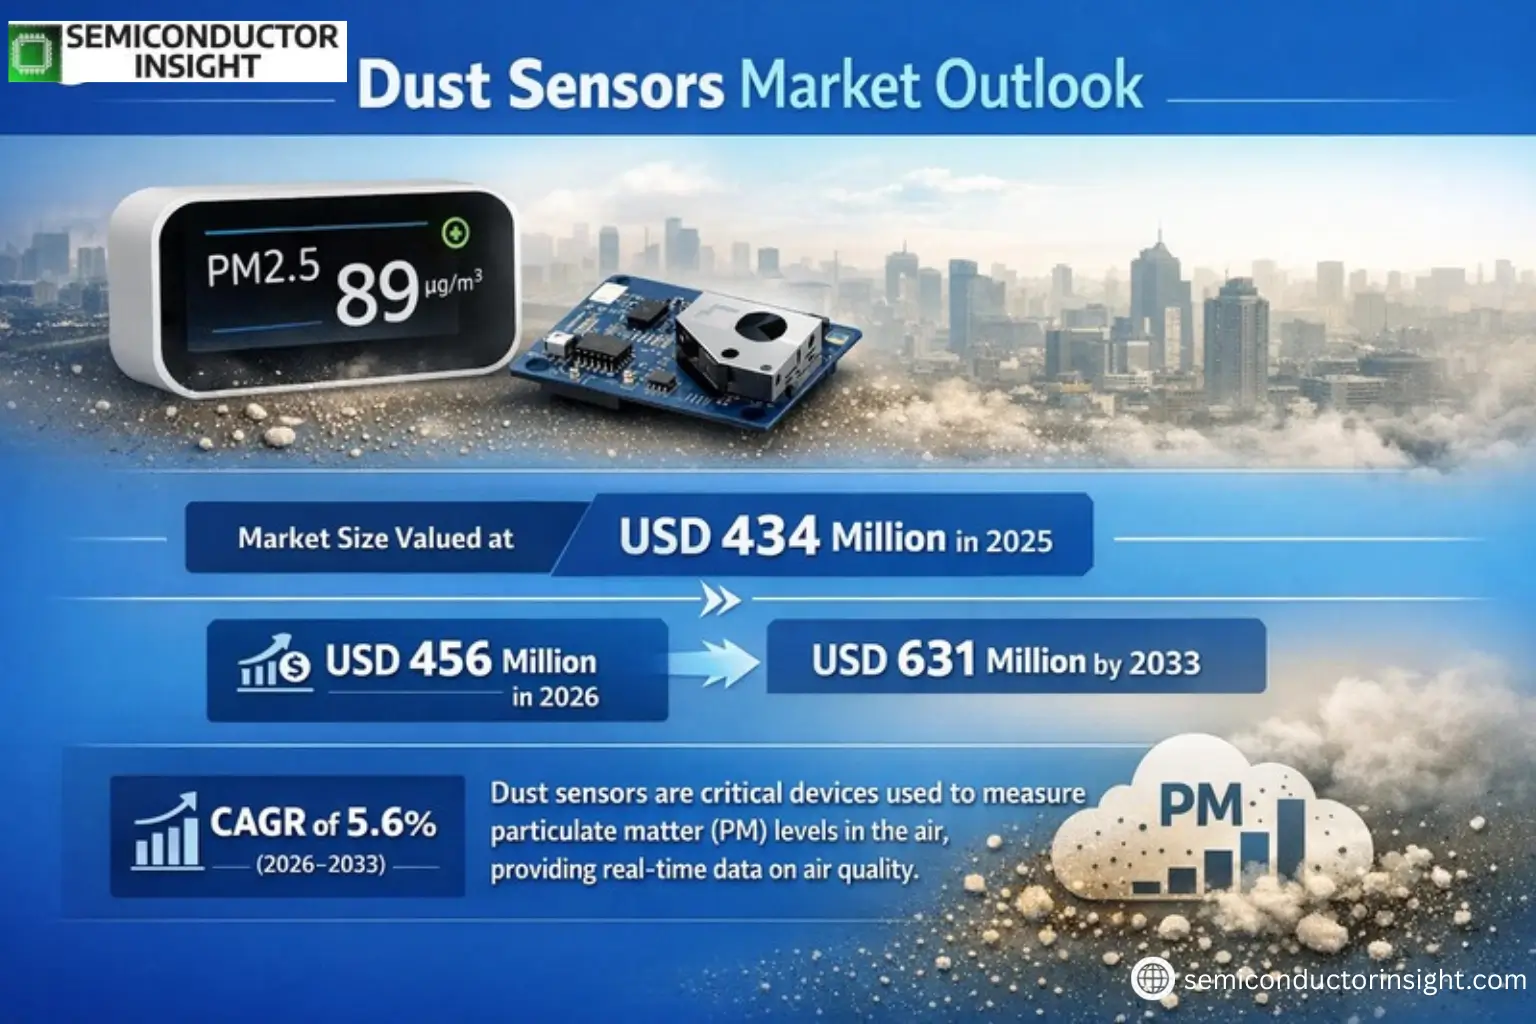
Global Dust Sensors Market size was valued at USD 434 million in 2025. The market is projected to grow from USD 456 million in 2026 to USD 631 million by 2033, exhibiting a CAGR of 5.6% during the forecast period.

Dust sensors are critical devices used to measure particulate matter (PM) levels in the air, providing real-time data on air quality. These sensors operate by detecting Low Pulse Occupancy (LPO) time, which is directly proportional to PM concentration. They are widely utilized across industries such as industrial manufacturing, automotive, healthcare, and environmental monitoring due to increasing regulatory standards and growing awareness of air pollution impacts.

The market growth is driven by rising concerns over air quality degradation, stringent government regulations on emissions, and advancements in sensor technologies. For instance, key players like Sensirion and Panasonic have introduced high-precision laser-based dust sensors for commercial and industrial applications. Europe dominates the market due to strict environmental policies, followed by China and the U.S., where rapid industrialization fuels demand. The commercial segment holds over 60% market share owing to widespread adoption in HVAC systems and smart buildings.

Xyz market size & forecast

MARKET DRIVERS

Growing Industrial Automation & Smart City Initiatives

The increasing adoption of industrial automation and smart city projects worldwide is driving demand for dust sensors. These sensors play a critical role in monitoring air quality and ensuring compliance with environmental regulations. Global Dust Sensors Market is projected to grow at a CAGR of over 8% as industries prioritize workplace safety and urban air quality management.

Stringent Government Regulations on Air Pollution

Governments worldwide are implementing stricter air quality standards, particularly for PM2.5 and PM10 particulate matter. This regulatory push is accelerating the deployment of dust sensors across manufacturing facilities, construction sites, and urban areas. The European Union’s Ambient Air Quality Directive and similar regulations in Asia-Pacific are creating sustained demand.

Consumer awareness about indoor air quality is also contributing to market growth, with residential applications accounting for nearly 15% of dust sensor demand.

MARKET CHALLENGES

High Development Costs and Technical Limitations

The development of highly accurate dust sensors with low false-positive rates requires significant R&D investment. Many existing sensors struggle with distinguishing between different particulate types, affecting measurement precision in complex environments.

Other Challenges

Calibration and Maintenance Requirements
Dust sensors require regular calibration and maintenance to ensure ongoing accuracy, creating operational challenges for end-users. This is particularly problematic in remote or harsh environments where service access is limited.

MARKET RESTRAINTS

Economic Slowdown Impacting Industrial Investments

Global economic uncertainties are causing delays in capital expenditures across industries that typically deploy dust sensors, including manufacturing and construction. Some regions have seen a 10-15% reduction in new sensor deployments as companies prioritize essential investments.

MARKET OPPORTUNITIES

Integration with IoT and Smart Home Ecosystems

The convergence of dust sensors with IoT platforms presents significant growth potential. Smart home manufacturers are increasingly incorporating particulate monitoring into their systems, with the residential segment expected to grow at 12% annually. Cloud-connected dust sensors that provide real-time air quality analytics are gaining traction.
Dust Sensors Market Trends

Rapid Growth in Commercial Applications

Global Dust Sensors Market is experiencing steady growth, valued at USD 434 million in 2025 and projected to reach USD 631 million by 2033 at a 5.6% CAGR. Commercial applications dominate the Dust Sensors Market, accounting for over 60% of total usage. Major industries driving demand include automotive, healthcare, and aerospace sectors where air quality monitoring is critical.

Other Trends

Technological Advancements in Dust Sensors

Innovations in infrared and laser sensor technologies are enhancing the accuracy of particulate matter (PM) measurements. Manufacturers are focusing on developing sensors with lower power consumption and improved response times. The ability to measure Low Pulse Occupancy (LPO) time has become a standard feature in modern dust detection systems.

Regional Market Dynamics

Europe currently leads the Dust Sensors Market, followed by China and the United States. Emerging economies are showing increased adoption due to stricter environmental regulations and growing industrialization. The Asia-Pacific region is expected to witness the fastest growth during the forecast period, driven by rapid urbanization and air quality concerns.

Key Players Competitive Landscape

The Dust Sensors Market features major players including Sensirion, Panasonic, and Shinyei Group, who collectively hold significant market share. Companies are focusing on strategic partnerships and product innovations to maintain competitive advantage. Recent developments include miniaturized sensors for consumer electronics and IoT-enabled monitoring solutions.

Segment-Specific Growth Patterns

Industrial applications continue to be the largest end-use segment for Dust Sensors, particularly in manufacturing facilities and clean rooms. The environmental monitoring sector is experiencing rapid growth due to increased government initiatives for air pollution control globally.

COMPETITIVE LANDSCAPE

Key Industry Players

Strategic Positioning and Market Concentration in Dust Sensor Technology

Dust Sensors Market is dominated by established players like Sensirion, Paragon, and Panasonic, who collectively hold over 40% of the global market share. Sensirion leads with advanced laser-based particulate matter detection technology, particularly strong in European industrial applications. The market structure shows moderate consolidation, with the top 5 players controlling 55-60% of revenue, while numerous specialized manufacturers compete in niche segments like automotive and healthcare applications.

Emerging players like Plantower Technology and Luftmy Intelligence Technology are gaining traction through innovative IoT-enabled solutions, particularly in Asian markets. Niche specialists such as Cubit Sensor and Instrument focus on high-precision environmental monitoring systems, while Prodrive Technologies serves aerospace applications. The competitive landscape is witnessing increased R&D investments, with 15-20% of industry revenue being reinvested in next-generation sensor development.

List of Key Dust Sensors Companies Profiled

  • Sensirion AG
  • Paragon Corporation
  • Zhengzhou Winsen Electronics Technology
  • Panasonic Corporation
  • Shinyei Group
  • Amphenol Advanced Sensors
  • Cubic Sensor and Instrument
  • Plantower Technology
  • Prodrive Technologies
  • Luftmy Intelligence Technology
  • Nova Technology Corporation
  • Sharp Corporation
  • Honeywell International
  • Siemens AG
  • Omron Corporation

Segment Analysis:

Segment Category Sub-Segments Key Insights
By Type
  • Infrared Sensor
  • Laser Sensor
Laser Sensors dominate the market due to:

  • Higher precision in particulate matter detection across various particle sizes
  • Broader application in industrial and environmental monitoring sectors
  • Better performance in extreme environmental conditions
By Application
  • Industrial
  • Household Appliances
  • Environmental Monitoring
  • Others
Industrial Applications lead due to:

  • Strict air quality regulations in manufacturing facilities
  • Growing awareness of workplace safety standards
  • Increasing automation in dust monitoring systems across factories
By End User
  • Manufacturing Sector
  • Commercial Buildings
  • Government & Municipalities
Manufacturing Sector shows strongest adoption due to:

  • Mandatory compliance with occupational health regulations
  • Integration with industrial IoT systems for real-time monitoring
  • Need for precision monitoring in pharmaceutical and food processing industries
By Technology
  • Optical Particle Counting
  • Light Scattering
  • Beta Attenuation
Light Scattering technology is most prevalent because:

  • Offers real-time continuous monitoring capabilities
  • Lower maintenance requirements compared to other technologies
  • Adaptable to various environmental conditions and particle sizes
By Detection Range
  • PM1.0 Detection
  • PM2.5 Detection
  • PM10 Detection
PM2.5 Detection segment leads the market as:

  • Most regulatory standards focus on PM2.5 as key air quality indicator
  • Growing public health concerns about fine particulate pollution
  • Higher adoption in urban air quality monitoring systems

Regional Analysis: Global Dust Sensors Market

Asia-Pacific

The Asia-Pacific region dominates the Dust Sensors Market due to rapid industrialization and strict environmental regulations. Countries like China, Japan, and South Korea are investing heavily in air quality monitoring systems to combat urban pollution. The manufacturing boom and smart city initiatives across the region are driving significant demand for dust monitoring technologies. Governments are implementing stringent workplace safety norms, particularly in mining and construction sectors, further accelerating market growth. Technological advancements combined with affordable sensor solutions position Asia-Pacific as the innovation hub for dust detection systems. The presence of major sensor manufacturers provides local supply chain advantages.

Industrial Applications Growth
Manufacturing facilities across Asia-Pacific are integrating dust sensors into ventilation systems and production lines to comply with occupational health standards. The electronics manufacturing sector shows particularly strong adoption rates.
Smart City Integration
Metropolitan areas are deploying networked dust sensors as part of broader environmental monitoring initiatives. Singapore and Seoul have implemented city-wide particulate monitoring systems using advanced sensor technologies.
Regulatory Framework
Stringent air quality standards in China and India are forcing industries to invest in continuous monitoring solutions. Recent amendments to environmental protection laws have expanded the scope of mandatory dust monitoring.
Technological Advancements
Local manufacturers are developing low-cost, high-accuracy sensors with IoT capabilities. Partnerships between sensor companies and cloud platforms enable real-time air quality data analysis across the region.

North America
The North American Dust Sensors Market benefits from well-established environmental monitoring infrastructure and advanced manufacturing standards. U.S. regulations like the Clean Air Act mandate particulate monitoring in industrial facilities, driving steady market demand. Canadian mining operations and U.S. construction sites represent significant end-users. The region shows strong adoption of laser-based dust sensors for their precision. Research institutions collaborate with sensor manufacturers to develop next-generation monitoring solutions, particularly for wildfire smoke detection applications.

Europe
European countries maintain rigorous workplace air quality standards, creating consistent demand for dust monitoring equipment. Germany leads in industrial sensor adoption, while Nordic countries focus on environmental monitoring networks. The EU’s ambient air quality directives push municipalities to expand monitoring coverage. Automotive and pharmaceutical manufacturing sectors represent key verticals for high-precision dust sensors. European companies emphasize energy-efficient and sustainable sensor designs with minimal environmental impact.

Middle East & Africa
Gulf countries are investing in dust monitoring infrastructure to address desert environmental challenges. Oil & gas operations and construction projects drive demand for ruggedized sensors capable of harsh environment operation. African markets show gradual growth with mining safety initiatives and urban air quality programs. The region presents opportunities for cost-optimized solutions suitable for developing economies.

South America
Brazil and Chile lead dust sensor adoption in South America, particularly for mining and agricultural applications. Increasing environmental awareness and industrial safety regulations contribute to market expansion. Challenges include price sensitivity and infrastructure limitations in remote areas. Governments are implementing monitoring requirements for cement plants and other particulate-emitting industries.

Report Scope

This market research report provides a comprehensive analysis of the Dust Sensors Market, covering the forecast period 2026–2033. It offers detailed insights into market dynamics, technological advancements, competitive landscape, and key trends shaping the industry.

Key focus areas of the report include:

  • Market Overview: The report begins with an overview outlining its current market scenario, key growth indicators, and industry transformation drivers. It discusses macroeconomic factors, demand–supply balance, regulatory landscape, and the strategic role of dust sensors in air quality monitoring across industries such as industrial, automotive, healthcare, and environmental monitoring.
  • Market Size & Forecast: Historical data and future projections for revenue, unit shipments, and market value across major regions and segments.
  • Segmentation Analysis: Detailed breakdown by product type, technology, application, and end-user industry to identify high-growth segments and investment opportunities.
  • Regional Insights: Insights into market performance across North America, Europe, Asia, South America, and the Middle East & Africa, including country-level analysis where relevant.
  • Competitive Landscape: Profiles of leading market participants, including their product offerings, R&D focus, manufacturing capacity, pricing strategies, and recent developments such as mergers, acquisitions, and partnerships.
  • Technology Trends & Innovation: Assessment of emerging technologies, integration of AI/IoT, sensor design trends, and evolving industry standards.
  • Market Drivers & Restraints: Evaluation of factors driving market growth along with challenges, supply chain constraints, regulatory issues, and market-entry barriers.
  • Stakeholder Insights: Insights for component suppliers, OEMs, system integrators, investors, and policymakers regarding the evolving ecosystem and strategic opportunities.

Primary and secondary research methods are employed, including interviews with industry experts, data from verified sources, and real-time market intelligence to ensure the accuracy and reliability of the insights presented.

FREQUENTLY ASKED QUESTIONS:

What is the current market size of Dust Sensors Market?

-> Dust Sensors Market size was valued at USD 434 million in 2025. The market is projected to grow from USD 456 million in 2026 to USD 631 million by 2033, exhibiting a CAGR of 5.6% during the forecast period.

What is the growth rate (CAGR) of Dust Sensors Market?

-> The market is expected to grow at a CAGR of 5.6% during 2025-2033.

Which key companies operate in Dust Sensors Market?

-> Key players include Sensirion, Paragon, Winsen, Panasonic, Shinyei Group, Amphenol Advanced Sensors, Cubic Sensor and Instrument, and Plantower Technology, among others.

Which region dominates the Dust Sensors Market?

-> Europe is the largest market, followed by China and the USA.

What are the major applications of Dust Sensors?

-> Major applications include Industrial, Automotive, Healthcare, Aerospace, and Environmental Monitoring.

Dust Sensors Market, Global Business Strategies 2026-2033

Get Sample Report PDF for Exclusive Insights

Report Sample Includes

  • Table of Contents
  • List of Tables & Figures
  • Charts, Research Methodology, and more...
PDF Icon Download Sample Report PDF

Download Sample Report

Table of Content

1 Introduction to Research & Analysis Reports
1.1 Dust Sensors Market Definition
1.2 Market Segments
1.2.1 Segment by Type
1.2.2 Segment by Application
1.3 Global Dust Sensors Market Overview
1.4 Features & Benefits of This Report
1.5 Methodology & Sources of Information
1.5.1 Research Methodology
1.5.2 Research Process
1.5.3 Base Year
1.5.4 Report Assumptions & Caveats
2 Global Dust Sensors Overall Market Size
2.1 Global Dust Sensors Market Size: 2024 VS 2032
2.2 Global Dust Sensors Market Size, Prospects & Forecasts: 2020-2032
2.3 Global Dust Sensors Sales: 2020-2032
3 Company Landscape
3.1 Top Dust Sensors Players in Global Market
3.2 Top Global Dust Sensors Companies Ranked by Revenue
3.3 Global Dust Sensors Revenue by Companies
3.4 Global Dust Sensors Sales by Companies
3.5 Global Dust Sensors Price by Manufacturer (2020-2025)
3.6 Top 3 and Top 5 Dust Sensors Companies in Global Market, by Revenue in 2024
3.7 Global Manufacturers Dust Sensors Product Type
3.8 Tier 1, Tier 2, and Tier 3 Dust Sensors Players in Global Market
3.8.1 List of Global Tier 1 Dust Sensors Companies
3.8.2 List of Global Tier 2 and Tier 3 Dust Sensors Companies
4 Sights by Product
4.1 Overview
4.1.1 Segment by Type – Global Dust Sensors Market Size Markets, 2024 & 2032
4.1.2 Infrared Sensor
4.1.3 Laser Sensor
4.2 Segment by Type – Global Dust Sensors Revenue & Forecasts
4.2.1 Segment by Type – Global Dust Sensors Revenue, 2020-2025
4.2.2 Segment by Type – Global Dust Sensors Revenue, 2026-2032
4.2.3 Segment by Type – Global Dust Sensors Revenue Market Share, 2020-2032
4.3 Segment by Type – Global Dust Sensors Sales & Forecasts
4.3.1 Segment by Type – Global Dust Sensors Sales, 2020-2025
4.3.2 Segment by Type – Global Dust Sensors Sales, 2026-2032
4.3.3 Segment by Type – Global Dust Sensors Sales Market Share, 2020-2032
4.4 Segment by Type – Global Dust Sensors Price (Manufacturers Selling Prices), 2020-2032
5 Sights by Application
5.1 Overview
5.1.1 Segment by Application – Global Dust Sensors Market Size, 2024 & 2032
5.1.2 Industrial
5.1.3 Household Appliances
5.1.4 Environmental Monitoring
5.1.5 Others
5.2 Segment by Application – Global Dust Sensors Revenue & Forecasts
5.2.1 Segment by Application – Global Dust Sensors Revenue, 2020-2025
5.2.2 Segment by Application – Global Dust Sensors Revenue, 2026-2032
5.2.3 Segment by Application – Global Dust Sensors Revenue Market Share, 2020-2032
5.3 Segment by Application – Global Dust Sensors Sales & Forecasts
5.3.1 Segment by Application – Global Dust Sensors Sales, 2020-2025
5.3.2 Segment by Application – Global Dust Sensors Sales, 2026-2032
5.3.3 Segment by Application – Global Dust Sensors Sales Market Share, 2020-2032
5.4 Segment by Application – Global Dust Sensors Price (Manufacturers Selling Prices), 2020-2032
6 Sights by Region
6.1 By Region – Global Dust Sensors Market Size, 2024 & 2032
6.2 By Region – Global Dust Sensors Revenue & Forecasts
6.2.1 By Region – Global Dust Sensors Revenue, 2020-2025
6.2.2 By Region – Global Dust Sensors Revenue, 2026-2032
6.2.3 By Region – Global Dust Sensors Revenue Market Share, 2020-2032
6.3 By Region – Global Dust Sensors Sales & Forecasts
6.3.1 By Region – Global Dust Sensors Sales, 2020-2025
6.3.2 By Region – Global Dust Sensors Sales, 2026-2032
6.3.3 By Region – Global Dust Sensors Sales Market Share, 2020-2032
6.4 North America
6.4.1 By Country – North America Dust Sensors Revenue, 2020-2032
6.4.2 By Country – North America Dust Sensors Sales, 2020-2032
6.4.3 United States Dust Sensors Market Size, 2020-2032
6.4.4 Canada Dust Sensors Market Size, 2020-2032
6.4.5 Mexico Dust Sensors Market Size, 2020-2032
6.5 Europe
6.5.1 By Country – Europe Dust Sensors Revenue, 2020-2032
6.5.2 By Country – Europe Dust Sensors Sales, 2020-2032
6.5.3 Germany Dust Sensors Market Size, 2020-2032
6.5.4 France Dust Sensors Market Size, 2020-2032
6.5.5 U.K. Dust Sensors Market Size, 2020-2032
6.5.6 Italy Dust Sensors Market Size, 2020-2032
6.5.7 Russia Dust Sensors Market Size, 2020-2032
6.5.8 Nordic Countries Dust Sensors Market Size, 2020-2032
6.5.9 Benelux Dust Sensors Market Size, 2020-2032
6.6 Asia
6.6.1 By Region – Asia Dust Sensors Revenue, 2020-2032
6.6.2 By Region – Asia Dust Sensors Sales, 2020-2032
6.6.3 China Dust Sensors Market Size, 2020-2032
6.6.4 Japan Dust Sensors Market Size, 2020-2032
6.6.5 South Korea Dust Sensors Market Size, 2020-2032
6.6.6 Southeast Asia Dust Sensors Market Size, 2020-2032
6.6.7 India Dust Sensors Market Size, 2020-2032
6.7 South America
6.7.1 By Country – South America Dust Sensors Revenue, 2020-2032
6.7.2 By Country – South America Dust Sensors Sales, 2020-2032
6.7.3 Brazil Dust Sensors Market Size, 2020-2032
6.7.4 Argentina Dust Sensors Market Size, 2020-2032
6.8 Middle East & Africa
6.8.1 By Country – Middle East & Africa Dust Sensors Revenue, 2020-2032
6.8.2 By Country – Middle East & Africa Dust Sensors Sales, 2020-2032
6.8.3 Turkey Dust Sensors Market Size, 2020-2032
6.8.4 Israel Dust Sensors Market Size, 2020-2032
6.8.5 Saudi Arabia Dust Sensors Market Size, 2020-2032
6.8.6 UAE Dust Sensors Market Size, 2020-2032
7 Manufacturers & Brands Profiles
7.1 Sensirion
7.1.1 Sensirion Company Summary
7.1.2 Sensirion Business Overview
7.1.3 Sensirion Dust Sensors Major Product Offerings
7.1.4 Sensirion Dust Sensors Sales and Revenue in Global (2020-2025)
7.1.5 Sensirion Key News & Latest Developments
7.2 Paragon
7.2.1 Paragon Company Summary
7.2.2 Paragon Business Overview
7.2.3 Paragon Dust Sensors Major Product Offerings
7.2.4 Paragon Dust Sensors Sales and Revenue in Global (2020-2025)
7.2.5 Paragon Key News & Latest Developments
7.3 Winsen
7.3.1 Winsen Company Summary
7.3.2 Winsen Business Overview
7.3.3 Winsen Dust Sensors Major Product Offerings
7.3.4 Winsen Dust Sensors Sales and Revenue in Global (2020-2025)
7.3.5 Winsen Key News & Latest Developments
7.4 Panasonic
7.4.1 Panasonic Company Summary
7.4.2 Panasonic Business Overview
7.4.3 Panasonic Dust Sensors Major Product Offerings
7.4.4 Panasonic Dust Sensors Sales and Revenue in Global (2020-2025)
7.4.5 Panasonic Key News & Latest Developments
7.5 Shinyei Group
7.5.1 Shinyei Group Company Summary
7.5.2 Shinyei Group Business Overview
7.5.3 Shinyei Group Dust Sensors Major Product Offerings
7.5.4 Shinyei Group Dust Sensors Sales and Revenue in Global (2020-2025)
7.5.5 Shinyei Group Key News & Latest Developments
7.6 Amphenol Advanced Sensors
7.6.1 Amphenol Advanced Sensors Company Summary
7.6.2 Amphenol Advanced Sensors Business Overview
7.6.3 Amphenol Advanced Sensors Dust Sensors Major Product Offerings
7.6.4 Amphenol Advanced Sensors Dust Sensors Sales and Revenue in Global (2020-2025)
7.6.5 Amphenol Advanced Sensors Key News & Latest Developments
7.7 Cubic Sensor and Instrument
7.7.1 Cubic Sensor and Instrument Company Summary
7.7.2 Cubic Sensor and Instrument Business Overview
7.7.3 Cubic Sensor and Instrument Dust Sensors Major Product Offerings
7.7.4 Cubic Sensor and Instrument Dust Sensors Sales and Revenue in Global (2020-2025)
7.7.5 Cubic Sensor and Instrument Key News & Latest Developments
7.8 Plantower Technology
7.8.1 Plantower Technology Company Summary
7.8.2 Plantower Technology Business Overview
7.8.3 Plantower Technology Dust Sensors Major Product Offerings
7.8.4 Plantower Technology Dust Sensors Sales and Revenue in Global (2020-2025)
7.8.5 Plantower Technology Key News & Latest Developments
7.9 Prodrive Technologies
7.9.1 Prodrive Technologies Company Summary
7.9.2 Prodrive Technologies Business Overview
7.9.3 Prodrive Technologies Dust Sensors Major Product Offerings
7.9.4 Prodrive Technologies Dust Sensors Sales and Revenue in Global (2020-2025)
7.9.5 Prodrive Technologies Key News & Latest Developments
7.10 Luftmy Intelligence Technology
7.10.1 Luftmy Intelligence Technology Company Summary
7.10.2 Luftmy Intelligence Technology Business Overview
7.10.3 Luftmy Intelligence Technology Dust Sensors Major Product Offerings
7.10.4 Luftmy Intelligence Technology Dust Sensors Sales and Revenue in Global (2020-2025)
7.10.5 Luftmy Intelligence Technology Key News & Latest Developments
7.11 Nova Technology
7.11.1 Nova Technology Company Summary
7.11.2 Nova Technology Business Overview
7.11.3 Nova Technology Dust Sensors Major Product Offerings
7.11.4 Nova Technology Dust Sensors Sales and Revenue in Global (2020-2025)
7.11.5 Nova Technology Key News & Latest Developments
8 Global Dust Sensors Production Capacity, Analysis
8.1 Global Dust Sensors Production Capacity, 2020-2032
8.2 Dust Sensors Production Capacity of Key Manufacturers in Global Market
8.3 Global Dust Sensors Production by Region
9 Key Market Trends, Opportunity, Drivers and Restraints
9.1 Market Opportunities & Trends
9.2 Market Drivers
9.3 Market Restraints
10 Dust Sensors Supply Chain Analysis
10.1 Dust Sensors Industry Value Chain
10.2 Dust Sensors Upstream Market
10.3 Dust Sensors Downstream and Clients
10.4 Marketing Channels Analysis
10.4.1 Marketing Channels
10.4.2 Dust Sensors Distributors and Sales Agents in Global
11 Conclusion
12 Appendix
12.1 Note
12.2 Examples of Clients
12.3 DisclaimerList of Tables
Table 1. Key Players of Dust Sensors in Global Market
Table 2. Top Dust Sensors Players in Global Market, Ranking by Revenue (2024)
Table 3. Global Dust Sensors Revenue by Companies, (US$, Mn), 2020-2025
Table 4. Global Dust Sensors Revenue Share by Companies, 2020-2025
Table 5. Global Dust Sensors Sales by Companies, (K Units), 2020-2025
Table 6. Global Dust Sensors Sales Share by Companies, 2020-2025
Table 7. Key Manufacturers Dust Sensors Price (2020-2025) & (USD/Unit)
Table 8. Global Manufacturers Dust Sensors Product Type
Table 9. List of Global Tier 1 Dust Sensors Companies, Revenue (US$, Mn) in 2024 and Market Share
Table 10. List of Global Tier 2 and Tier 3 Dust Sensors Companies, Revenue (US$, Mn) in 2024 and Market Share
Table 11. Segment by Type – Global Dust Sensors Revenue, (US$, Mn), 2024 & 2032
Table 12. Segment by Type – Global Dust Sensors Revenue (US$, Mn), 2020-2025
Table 13. Segment by Type – Global Dust Sensors Revenue (US$, Mn), 2026-2032
Table 14. Segment by Type – Global Dust Sensors Sales (K Units), 2020-2025
Table 15. Segment by Type – Global Dust Sensors Sales (K Units), 2026-2032
Table 16. Segment by Application – Global Dust Sensors Revenue, (US$, Mn), 2024 & 2032
Table 17. Segment by Application – Global Dust Sensors Revenue, (US$, Mn), 2020-2025
Table 18. Segment by Application – Global Dust Sensors Revenue, (US$, Mn), 2026-2032
Table 19. Segment by Application – Global Dust Sensors Sales, (K Units), 2020-2025
Table 20. Segment by Application – Global Dust Sensors Sales, (K Units), 2026-2032
Table 21. By Region – Global Dust Sensors Revenue, (US$, Mn), 2025-2032
Table 22. By Region – Global Dust Sensors Revenue, (US$, Mn), 2020-2025
Table 23. By Region – Global Dust Sensors Revenue, (US$, Mn), 2026-2032
Table 24. By Region – Global Dust Sensors Sales, (K Units), 2020-2025
Table 25. By Region – Global Dust Sensors Sales, (K Units), 2026-2032
Table 26. By Country – North America Dust Sensors Revenue, (US$, Mn), 2020-2025
Table 27. By Country – North America Dust Sensors Revenue, (US$, Mn), 2026-2032
Table 28. By Country – North America Dust Sensors Sales, (K Units), 2020-2025
Table 29. By Country – North America Dust Sensors Sales, (K Units), 2026-2032
Table 30. By Country – Europe Dust Sensors Revenue, (US$, Mn), 2020-2025
Table 31. By Country – Europe Dust Sensors Revenue, (US$, Mn), 2026-2032
Table 32. By Country – Europe Dust Sensors Sales, (K Units), 2020-2025
Table 33. By Country – Europe Dust Sensors Sales, (K Units), 2026-2032
Table 34. By Region – Asia Dust Sensors Revenue, (US$, Mn), 2020-2025
Table 35. By Region – Asia Dust Sensors Revenue, (US$, Mn), 2026-2032
Table 36. By Region – Asia Dust Sensors Sales, (K Units), 2020-2025
Table 37. By Region – Asia Dust Sensors Sales, (K Units), 2026-2032
Table 38. By Country – South America Dust Sensors Revenue, (US$, Mn), 2020-2025
Table 39. By Country – South America Dust Sensors Revenue, (US$, Mn), 2026-2032
Table 40. By Country – South America Dust Sensors Sales, (K Units), 2020-2025
Table 41. By Country – South America Dust Sensors Sales, (K Units), 2026-2032
Table 42. By Country – Middle East & Africa Dust Sensors Revenue, (US$, Mn), 2020-2025
Table 43. By Country – Middle East & Africa Dust Sensors Revenue, (US$, Mn), 2026-2032
Table 44. By Country – Middle East & Africa Dust Sensors Sales, (K Units), 2020-2025
Table 45. By Country – Middle East & Africa Dust Sensors Sales, (K Units), 2026-2032
Table 46. Sensirion Company Summary
Table 47. Sensirion Dust Sensors Product Offerings
Table 48. Sensirion Dust Sensors Sales (K Units), Revenue (US$, Mn) and Average Price (USD/Unit) & (2020-2025)
Table 49. Sensirion Key News & Latest Developments
Table 50. Paragon Company Summary
Table 51. Paragon Dust Sensors Product Offerings
Table 52. Paragon Dust Sensors Sales (K Units), Revenue (US$, Mn) and Average Price (USD/Unit) & (2020-2025)
Table 53. Paragon Key News & Latest Developments
Table 54. Winsen Company Summary
Table 55. Winsen Dust Sensors Product Offerings
Table 56. Winsen Dust Sensors Sales (K Units), Revenue (US$, Mn) and Average Price (USD/Unit) & (2020-2025)
Table 57. Winsen Key News & Latest Developments
Table 58. Panasonic Company Summary
Table 59. Panasonic Dust Sensors Product Offerings
Table 60. Panasonic Dust Sensors Sales (K Units), Revenue (US$, Mn) and Average Price (USD/Unit) & (2020-2025)
Table 61. Panasonic Key News & Latest Developments
Table 62. Shinyei Group Company Summary
Table 63. Shinyei Group Dust Sensors Product Offerings
Table 64. Shinyei Group Dust Sensors Sales (K Units), Revenue (US$, Mn) and Average Price (USD/Unit) & (2020-2025)
Table 65. Shinyei Group Key News & Latest Developments
Table 66. Amphenol Advanced Sensors Company Summary
Table 67. Amphenol Advanced Sensors Dust Sensors Product Offerings
Table 68. Amphenol Advanced Sensors Dust Sensors Sales (K Units), Revenue (US$, Mn) and Average Price (USD/Unit) & (2020-2025)
Table 69. Amphenol Advanced Sensors Key News & Latest Developments
Table 70. Cubic Sensor and Instrument Company Summary
Table 71. Cubic Sensor and Instrument Dust Sensors Product Offerings
Table 72. Cubic Sensor and Instrument Dust Sensors Sales (K Units), Revenue (US$, Mn) and Average Price (USD/Unit) & (2020-2025)
Table 73. Cubic Sensor and Instrument Key News & Latest Developments
Table 74. Plantower Technology Company Summary
Table 75. Plantower Technology Dust Sensors Product Offerings
Table 76. Plantower Technology Dust Sensors Sales (K Units), Revenue (US$, Mn) and Average Price (USD/Unit) & (2020-2025)
Table 77. Plantower Technology Key News & Latest Developments
Table 78. Prodrive Technologies Company Summary
Table 79. Prodrive Technologies Dust Sensors Product Offerings
Table 80. Prodrive Technologies Dust Sensors Sales (K Units), Revenue (US$, Mn) and Average Price (USD/Unit) & (2020-2025)
Table 81. Prodrive Technologies Key News & Latest Developments
Table 82. Luftmy Intelligence Technology Company Summary
Table 83. Luftmy Intelligence Technology Dust Sensors Product Offerings
Table 84. Luftmy Intelligence Technology Dust Sensors Sales (K Units), Revenue (US$, Mn) and Average Price (USD/Unit) & (2020-2025)
Table 85. Luftmy Intelligence Technology Key News & Latest Developments
Table 86. Nova Technology Company Summary
Table 87. Nova Technology Dust Sensors Product Offerings
Table 88. Nova Technology Dust Sensors Sales (K Units), Revenue (US$, Mn) and Average Price (USD/Unit) & (2020-2025)
Table 89. Nova Technology Key News & Latest Developments
Table 90. Dust Sensors Capacity of Key Manufacturers in Global Market, 2023-2025 (K Units)
Table 91. Global Dust Sensors Capacity Market Share of Key Manufacturers, 2023-2025
Table 92. Global Dust Sensors Production by Region, 2020-2025 (K Units)
Table 93. Global Dust Sensors Production by Region, 2026-2032 (K Units)
Table 94. Dust Sensors Market Opportunities & Trends in Global Market
Table 95. Dust Sensors Market Drivers in Global Market
Table 96. Dust Sensors Market Restraints in Global Market
Table 97. Dust Sensors Raw Materials
Table 98. Dust Sensors Raw Materials Suppliers in Global Market
Table 99. Typical Dust Sensors Downstream
Table 100. Dust Sensors Downstream Clients in Global Market
Table 101. Dust Sensors Distributors and Sales Agents in Global Market

List of Figures
Figure 1. Dust Sensors Product Picture
Figure 2. Dust Sensors Segment by Type in 2024
Figure 3. Dust Sensors Segment by Application in 2024
Figure 4. Global Dust Sensors Market Overview: 2024
Figure 5. Key Caveats
Figure 6. Global Dust Sensors Market Size: 2024 VS 2032 (US$, Mn)
Figure 7. Global Dust Sensors Revenue: 2020-2032 (US$, Mn)
Figure 8. Dust Sensors Sales in Global Market: 2020-2032 (K Units)
Figure 9. The Top 3 and 5 Players Market Share by Dust Sensors Revenue in 2024
Figure 10. Segment by Type – Global Dust Sensors Revenue, (US$, Mn), 2024 & 2032
Figure 11. Segment by Type – Global Dust Sensors Revenue Market Share, 2020-2032
Figure 12. Segment by Type – Global Dust Sensors Sales Market Share, 2020-2032
Figure 13. Segment by Type – Global Dust Sensors Price (USD/Unit), 2020-2032
Figure 14. Segment by Application – Global Dust Sensors Revenue, (US$, Mn), 2024 & 2032
Figure 15. Segment by Application – Global Dust Sensors Revenue Market Share, 2020-2032
Figure 16. Segment by Application – Global Dust Sensors Sales Market Share, 2020-2032
Figure 17. Segment by Application -Global Dust Sensors Price (USD/Unit), 2020-2032
Figure 18. By Region – Global Dust Sensors Revenue, (US$, Mn), 2025 & 2032
Figure 19. By Region – Global Dust Sensors Revenue Market Share, 2020 VS 2024 VS 2032
Figure 20. By Region – Global Dust Sensors Revenue Market Share, 2020-2032
Figure 21. By Region – Global Dust Sensors Sales Market Share, 2020-2032
Figure 22. By Country – North America Dust Sensors Revenue Market Share, 2020-2032
Figure 23. By Country – North America Dust Sensors Sales Market Share, 2020-2032
Figure 24. United States Dust Sensors Revenue, (US$, Mn), 2020-2032
Figure 25. Canada Dust Sensors Revenue, (US$, Mn), 2020-2032
Figure 26. Mexico Dust Sensors Revenue, (US$, Mn), 2020-2032
Figure 27. By Country – Europe Dust Sensors Revenue Market Share, 2020-2032
Figure 28. By Country – Europe Dust Sensors Sales Market Share, 2020-2032
Figure 29. Germany Dust Sensors Revenue, (US$, Mn), 2020-2032
Figure 30. France Dust Sensors Revenue, (US$, Mn), 2020-2032
Figure 31. U.K. Dust Sensors Revenue, (US$, Mn), 2020-2032
Figure 32. Italy Dust Sensors Revenue, (US$, Mn), 2020-2032
Figure 33. Russia Dust Sensors Revenue, (US$, Mn), 2020-2032
Figure 34. Nordic Countries Dust Sensors Revenue, (US$, Mn), 2020-2032
Figure 35. Benelux Dust Sensors Revenue, (US$, Mn), 2020-2032
Figure 36. By Region – Asia Dust Sensors Revenue Market Share, 2020-2032
Figure 37. By Region – Asia Dust Sensors Sales Market Share, 2020-2032
Figure 38. China Dust Sensors Revenue, (US$, Mn), 2020-2032
Figure 39. Japan Dust Sensors Revenue, (US$, Mn), 2020-2032
Figure 40. South Korea Dust Sensors Revenue, (US$, Mn), 2020-2032
Figure 41. Southeast Asia Dust Sensors Revenue, (US$, Mn), 2020-2032
Figure 42. India Dust Sensors Revenue, (US$, Mn), 2020-2032
Figure 43. By Country – South America Dust Sensors Revenue Market Share, 2020-2032
Figure 44. By Country – South America Dust Sensors Sales, Market Share, 2020-2032
Figure 45. Brazil Dust Sensors Revenue, (US$, Mn), 2020-2032
Figure 46. Argentina Dust Sensors Revenue, (US$, Mn), 2020-2032
Figure 47. By Country – Middle East & Africa Dust Sensors Revenue, Market Share, 2020-2032
Figure 48. By Country – Middle East & Africa Dust Sensors Sales, Market Share, 2020-2032
Figure 49. Turkey Dust Sensors Revenue, (US$, Mn), 2020-2032
Figure 50. Israel Dust Sensors Revenue, (US$, Mn), 2020-2032
Figure 51. Saudi Arabia Dust Sensors Revenue, (US$, Mn), 2020-2032
Figure 52. UAE Dust Sensors Revenue, (US$, Mn), 2020-2032
Figure 53. Global Dust Sensors Production Capacity (K Units), 2020-2032
Figure 54. The Percentage of Production Dust Sensors by Region, 2024 VS 2032
Figure 55. Dust Sensors Industry Value Chain
Figure 56. Marketing Channels