Dosimeter Market, Global Business Strategies 2025-2032

Dosimeter Market size was valued at USD 317 million in 2024 to USD 624 million by 2032, exhibiting a CAGR of 10.4% during the forecast period

PDF Icon Download Sample Report PDF
  • Quick Dispatch

    All Orders

  • Secure Payment

    100% Secure Payment

Price range: $1,500.00 through $4,250.00

Clear

MARKET INSIGHTS

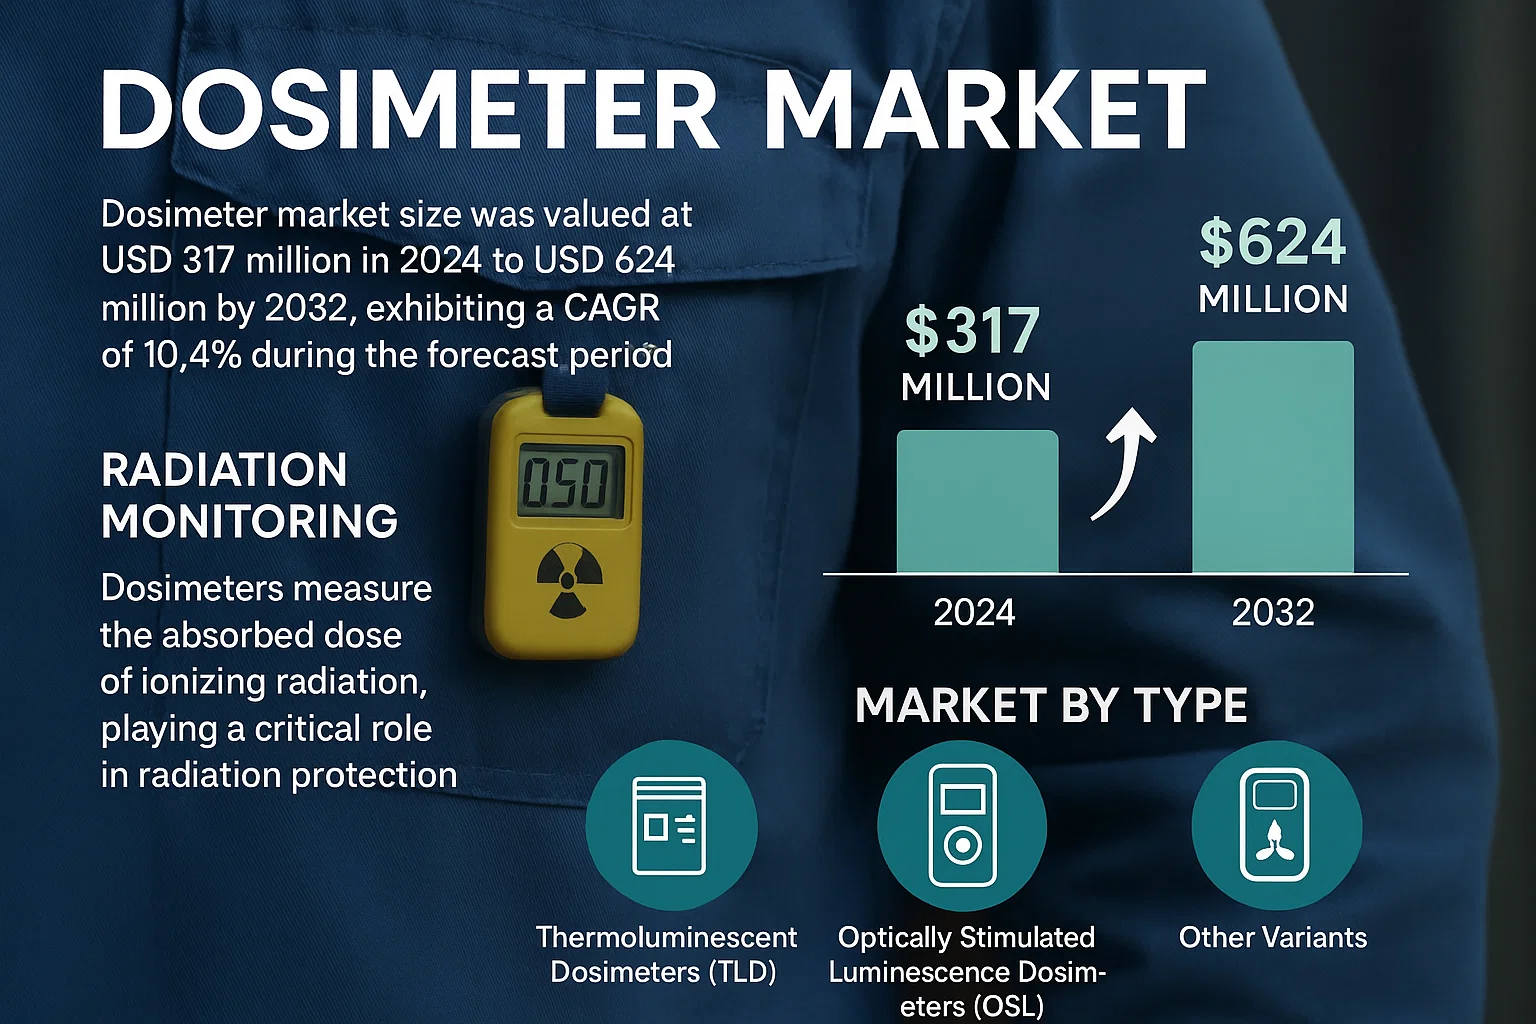
Global Dosimeter Market size was valued at USD 317 million in 2024 to USD 624 million by 2032, exhibiting a CAGR of 10.4% during the forecast period.

Dosimeters are specialized devices designed to measure the absorbed dose of ionizing radiation. These instruments play a critical role in radiation protection by quantifying exposure levels in environments where radioactive materials are handled, such as nuclear power plants, healthcare facilities, and industrial settings. The market primarily includes thermoluminescent dosimeters (TLD), optically stimulated luminescence dosimeters (OSL), and other variants, each offering distinct advantages for radiation monitoring.

Market growth is driven by increasing regulatory requirements for radiation safety, expansion of nuclear medicine, and growing awareness of occupational health hazards. The United States currently leads in market share with 28.98% of global production, followed by Europe. Key players like Landauer, Mirion Technologies, and Thermo Fisher Scientific dominate the competitive landscape, collectively holding 34% of the market value. Recent technological advancements in dosimeter sensitivity and data analysis capabilities are further accelerating adoption across industries.

Dosimeter Market

MARKET DRIVERS


Growing Awareness and Regulatory Compliance

The increasing awareness about the harmful effects of radiation exposure has led to stricter regulations across various industries. Organizations are mandated to monitor radiation exposure for workers, driving the demand for personal dosimeters. This is particularly evident in healthcare, nuclear energy, and industrial sectors where radiation is prevalent.

Expansion in Healthcare and Nuclear Medicine

The growth in nuclear medicine, including PET and CT scans, requires stringent radiation safety measures. This increases the demand for dosimeters in healthcare settings. Additionally, the global push towards nuclear energy as a clean energy source contributes to market growth as nuclear plants require extensive radiation monitoring.

The global push towards nuclear energy as a clean energy source also contributes to market growth, as nuclear plants require extensive radiation monitoring.

Furthermore, the increasing use of radiation in industrial applications such as radiography and material analysis further drives the market. Industries are increasingly adopting radiation sources for various applications, necessitating robust monitoring.

MARKET CHALLENGES


High Cost of Advanced Dosimeters

The development and production of advanced dosimeters with real-time monitoring and connectivity features are expensive. This can be a barrier for small organizations and in developing countries where budgets are limited. The high cost also affects the adoption of dosimeters in sectors where radiation monitoring is not mandatory but recommended.

Other Challenges

Lack of Standardization in Measurement Techniques
Different manufacturers use different technologies and calibration methods, making it difficult to compare readings across devices. This can hinder market growth as users may hesitate to invest in systems that aren’t universally compatible. The lack of standardization also complicates regulatory compliance and international cooperation.

MARKET RESTRAINTS


Economic Constraints and Budgetary Limitations

During economic downturns, companies and governments may cut budgets for safety equipment, including dosimeters. This can temporarily restrain market growth as organizations prioritize essential expenses. Additionally, the high cost of advanced dosimeters can be prohibitive for some markets, especially in developing regions where healthcare and industrial infrastructure is still developing.

MARKET OPPORTUNITIES


Growth in Emerging Economies

Countries like India, China, and Brazil are rapidly expanding their healthcare and nuclear infrastructure. This creates a substantial opportunity for dosimeter manufacturers to expand their presence. The increasing number of nuclear power plants and diagnostic centers in these regions requires robust radiation monitoring, driving market growth.

Technological Innovations in Dosimetry

The development of smart dosimeters with IoT connectivity and real-time data access presents significant opportunities. These devices can integrate with broader safety systems and provide actionable insights, making them attractive for modern industrial and healthcare applications. The integration of AI and machine learning for predictive analysis also offers growth opportunities.

Dosimeter Market Trends
Growing Adoption in Healthcare and Nuclear Sectors

The global dosimeter market is experiencing robust growth, driven by increasing radiation safety regulations across healthcare and nuclear industries. Medical facilities are adopting advanced dosimetry solutions to protect staff during diagnostic and therapeutic procedures, while nuclear power plants continue to invest in radiation monitoring technologies for worker safety. Market analysis indicates North America and Europe currently lead in market share due to stringent regulatory frameworks.

Other Trends

Technological Advancements in Dosimetry

Recent technological innovations are transforming the dosimeter market with the introduction of real-time monitoring solutions and integration with IoT platforms. Manufacturers are developing more compact and user-friendly devices with enhanced accuracy. The emergence of optically stimulated luminescence (OSL) dosimeters is gaining traction over traditional thermoluminescent dosimeters due to their reusability and cost-effectiveness. Market leaders are investing in R&D to incorporate artificial intelligence for dose prediction and alert systems.

Regional Market Expansion

Asia-Pacific is emerging as the fastest-growing market for dosimeters, particularly in countries like China, India, and South Korea. This growth is driven by rapid industrialization, increasing nuclear energy projects, and improving healthcare infrastructure. European and North American manufacturers are establishing partnerships and distribution networks in these emerging markets to capitalize on the growing demand for radiation safety equipment.

Market Consolidation and Partnerships

The dosimeter industry is experiencing consolidation as larger companies acquire specialized manufacturers to expand their product portfolios and geographic reach. Recent partnerships between dosimeter manufacturers and software companies are enabling the development of integrated radiation safety management systems. These collaborations are particularly focused on cloud-based solutions and data analytics platforms that enhance the value proposition of traditional dosimetry services.

COMPETITIVE LANDSCAPE

Key Industry Players

Dosimeter Market Competitive Analysis

The global dosimeters market is highly competitive with key players focusing on technological advancements and expanding their product portfolios to cater to diverse industry needs. Companies like Landauer, Mirion Technologies, and Thermo Fisher Scientific dominate the market, particularly in North America and Europe. These companies offer a wide range of dosimeters including TLD, OSL, and electronic dosimeters, catering to healthcare, nuclear power, and industrial applications.

Asian manufacturers such as Aloka, Fuji Electric, and Panasonic are also significant players, especially in the Asia-Pacific region. These companies are increasingly focusing on developing cost-effective solutions while maintaining high safety standards. The competitive landscape is characterized by strategic partnerships, mergers and acquisitions, and continuous R&D investments to enhance product features and global market presence.

List of Key Dosimeter Manufacturers

  • Landauer Inc.
  • Mirion Technologies
  • ATOMTEX
  • Aloka Co. Ltd.
  • Fuji Electric Co. Ltd.
  • Thermo Fisher Scientific Inc.
  • IBA Dosimetry
  • Unfors RaySafe
  • Panasonic Corporation
  • Ludlum Measurements Inc.
  • Radiation Detection Company
  • Canberra Industries Inc.
  • Polimaster
  • Arrow-Tech Inc.

Segment Analysis:

Segment Category Sub-Segments Key Insights
By Type
  • Personal Dosimeters
  • Area Monitoring Dosimeters
Personal Dosimeters lead this segment due to their widespread adoption across industries where individual employee exposure monitoring is mandated by safety regulations, offering continuous monitoring without disrupting workflow.
By Application
  • Healthcare & Medical
  • Nuclear Power Plants
  • Industrial Manufacturing
  • Research & Academia
Healthcare & Medical drives this segment due to increasing use of radiation therapies and diagnostic procedures, requiring strict dosimetry for both patient safety and occupational health of medical staff.
By End User
  • Hospitals & Medical Facilities
  • Energy & Utility Companies
  • Manufacturing & Industrial Plants
Hospitals & Medical Facilities lead due to stringent radiation safety protocols, regular staff training, and regulatory compliance requirements that demand continuous dosimetry monitoring.
By Technology
  • Active Electronic Dosimeters
  • Passive Dosimeters
  • Hybrid Systems
Active Electronic Dosimeters lead due to real-time monitoring capabilities, immediate readouts, and data integration features that support modern safety management systems and workflow integration.
By Service Model
  • Dosimeter Rental Services
  • Dosimeter Sales
  • Maintenance & Calibration Services
Dosimeter Rental Services lead due to cost-effectiveness for short-term projects, flexibility for contractors, and reduced capital expenditure while maintaining compliance with safety regulations.

Regional Analysis: Dosimeter Market

North America

North America dominates the dosimeter market with the largest market share, driven by stringent occupational safety regulations enforced by OSHA and advanced adoption of radiation monitoring technologies. The region benefits from robust healthcare infrastructure with strict radiation protection protocols in medical facilities. High R&D investments in personal dosimetry technologies and strong presence of key market players in the U.S. and Canada further accelerate market growth. The region’s well-established nuclear energy sector and widespread use of radiation in industrial applications create sustained demand for personal and area monitoring solutions.

Regulatory Compliance Driving Market
The stringent regulatory framework in North America, particularly OSHA’s enforcement of radiation exposure limits, compels industries to adopt advanced dosimetry solutions. Regular monitoring mandates and strict reporting requirements create consistent demand. The region’s mature regulatory ecosystem ensures comprehensive market penetration.
Healthcare Sector Adoption
North American healthcare facilities demonstrate high adoption rates of personal dosimeters among radiologists, nuclear medicine staff, and radiation oncology teams. Growing cancer treatment facilities and diagnostic imaging centers drive demand. The region’s advanced healthcare infrastructure supports sophisticated radiation monitoring across medical and dental applications.
Industrial Applications Expansion
Beyond healthcare, North American industries including manufacturing, aerospace, and nuclear energy demonstrate strong adoption of dosimetry solutions. The region’s diverse industrial base creates varied application scenarios, from manufacturing quality control to nuclear plant safety. Strong R&D initiatives continuously improve detection capabilities and data integration.
Technology Integration
North American markets show rapid adoption of smart dosimetry solutions with IoT connectivity and real-time monitoring capabilities. The region leads in development of integrated systems combining traditional dosimetry with modern data analytics. Cloud-based monitoring and automated reporting systems find strong adoption in North American markets, supported by advanced technology infrastructure.

Europe
Europe represents the second largest market for dosimeters, characterized by comprehensive radiation protection regulations under Euratom directives. The region demonstrates strong adoption in both industrial and healthcare sectors, with particular strength in Germany, UK, and France where manufacturing sectors implement rigorous worker protection programs. European markets show preference for integrated dosimetry solutions with environmental monitoring capabilities.

Asia-Pacific
The Asia-Pacific region demonstrates the fastest growth rate in dosimeter adoption, driven by rapidly industrializing economies and increasing nuclear energy investments. Countries like China, India, and South Korea are implementing stronger radiation protection regulations. Japan’s advanced technological adoption and Australia’s mining sector contribute to sophisticated market demand. The region shows increasing awareness of occupational safety and gradual implementation of international standards.

Latin America
Latin American markets show steady growth in dosimeter adoption, particularly in Brazil and Mexico where industrial growth drives demand. The region shows increasing regulatory focus on worker protection, though market penetration remains lower than in developed regions. Mining industries and growing healthcare sectors present significant opportunities, though economic fluctuations can impact investment in advanced monitoring technologies.

Middle East & Africa
These regions demonstrate emerging demand for dosimetry solutions, particularly around nuclear energy development and growing industrial sectors. South Africa shows the most developed market with strong mining and healthcare applications. The Middle East shows increasing adoption in oil and gas sector radiation monitoring. Market growth remains closely tied to economic development and infrastructure development across the region.

Report Scope

This report provides a comprehensive analysis of the Global Dosimeter Market, covering the forecast period 2024-2032. It offers detailed insights into market dynamics, technological advancements, competitive landscape, and key trends shaping the industry.

Key focus areas of the report include:

  • Market Overview: The report begins with an overview outlining the current market scenario, key growth indicators, and industry transformation drivers. It discusses macroeconomic factors, demand-supply balance, regulatory landscape, and the strategic role of dosimeters in radiation protection across various industries.
  • Market Size & Forecast: Historical data and future projections for market value, unit shipments, and revenue across major regions and segments.
  • Segmentation Analysis: Detailed breakdown by product type, technology, application, and end-user industry to identify high-growth segments and investment opportunities.
  • Regional Insights: Insights into market performance across North America, Europe, Asia-Pacific, Latin America, and Middle East & Africa, including country-level analysis where relevant.
  • Competitive Landscape: Profiles of leading market participants, including their product offerings, R&D focus, manufacturing capacity, pricing strategies, and recent developments.
  • Technology Trends & Innovation: Assessment of emerging technologies, integration of advanced materials, fabrication techniques, and evolving industry standards.
  • Market Drivers & Restraints: Evaluation of factors driving market growth along with challenges, supply chain constraints, regulatory issues, and market-entry barriers.
  • Stakeholder Insights: Insights for component suppliers, OEMs, system integrators, investors, and policymakers regarding the evolving ecosystem and strategic opportunities.

Primary and secondary research methods are employed, including interviews with industry experts, data from verified sources, and real-time market intelligence to ensure the accuracy and reliability of the insights presented.

FREQUENTLY ASKED QUESTIONS:

What is the current market size of the Dosimeter Market?

-> Dosimeter market was valued at USD 317 million in 2024 and is projected to reach USD 624 million by 2032.

What is the growth rate of the Dosimeter Market?

-> The market is expected to grow at a CAGR of 10.4% during the forecast period 2024-2032.

Which are the key companies in the Dosimeter Market?

-> Key players include Landauer, Mirion Technologies, ATOMTEX, Aloka, Thermo Fisher Scientific, Fuji Electric, IBA Dosimetry, Unfors RaySafe, Tracerco, Panasonic, and Ludlum Measurements, among others.

What are the major applications of Dosimeters?

-> Major applications include hospitals, nuclear power plants, manufacturing facilities, research institutions, and industrial settings where radiation protection is required.

Which region has the largest market share?

-> The United States currently holds the largest market share, followed by Europe and Asia-Pacific regions.

Dosimeter Market, Global Business Strategies 2025-2032

Get Sample Report PDF for Exclusive Insights

Report Sample Includes

  • Table of Contents
  • List of Tables & Figures
  • Charts, Research Methodology, and more...
PDF Icon Download Sample Report PDF
SKU: 7b8f80d369a3
Category:

Download Sample Report

Table of Content

1 Introduction to Research & Analysis Reports
1.1 Dosimeter Market Definition
1.2 Market Segments
1.2.1 Segment by Type
1.2.2 Segment by Application
1.3 Global Dosimeter Market Overview
1.4 Features & Benefits of This Report
1.5 Methodology & Sources of Information
1.5.1 Research Methodology
1.5.2 Research Process
1.5.3 Base Year
1.5.4 Report Assumptions & Caveats
2 Global Dosimeter Overall Market Size
2.1 Global Dosimeter Market Size: 2024 VS 2032
2.2 Global Dosimeter Market Size, Prospects & Forecasts: 2020-2032
2.3 Global Dosimeter Sales: 2020-2032
3 Company Landscape
3.1 Top Dosimeter Players in Global Market
3.2 Top Global Dosimeter Companies Ranked by Revenue
3.3 Global Dosimeter Revenue by Companies
3.4 Global Dosimeter Sales by Companies
3.5 Global Dosimeter Price by Manufacturer (2020-2025)
3.6 Top 3 and Top 5 Dosimeter Companies in Global Market, by Revenue in 2024
3.7 Global Manufacturers Dosimeter Product Type
3.8 Tier 1, Tier 2, and Tier 3 Dosimeter Players in Global Market
3.8.1 List of Global Tier 1 Dosimeter Companies
3.8.2 List of Global Tier 2 and Tier 3 Dosimeter Companies
4 Sights by Product
4.1 Overview
4.1.1 Segment by Type – Global Dosimeter Market Size Markets, 2024 & 2032
4.1.2 TLD Dosimeters
4.1.3 OSL Dosimeters
4.1.4 Others
4.2 Segment by Type – Global Dosimeter Revenue & Forecasts
4.2.1 Segment by Type – Global Dosimeter Revenue, 2020-2025
4.2.2 Segment by Type – Global Dosimeter Revenue, 2026-2032
4.2.3 Segment by Type – Global Dosimeter Revenue Market Share, 2020-2032
4.3 Segment by Type – Global Dosimeter Sales & Forecasts
4.3.1 Segment by Type – Global Dosimeter Sales, 2020-2025
4.3.2 Segment by Type – Global Dosimeter Sales, 2026-2032
4.3.3 Segment by Type – Global Dosimeter Sales Market Share, 2020-2032
4.4 Segment by Type – Global Dosimeter Price (Manufacturers Selling Prices), 2020-2032
5 Sights by Application
5.1 Overview
5.1.1 Segment by Application – Global Dosimeter Market Size, 2024 & 2032
5.1.2 Hospital
5.1.3 Nuclear Power Plant
5.1.4 Manufacturing
5.1.5 Others
5.2 Segment by Application – Global Dosimeter Revenue & Forecasts
5.2.1 Segment by Application – Global Dosimeter Revenue, 2020-2025
5.2.2 Segment by Application – Global Dosimeter Revenue, 2026-2032
5.2.3 Segment by Application – Global Dosimeter Revenue Market Share, 2020-2032
5.3 Segment by Application – Global Dosimeter Sales & Forecasts
5.3.1 Segment by Application – Global Dosimeter Sales, 2020-2025
5.3.2 Segment by Application – Global Dosimeter Sales, 2026-2032
5.3.3 Segment by Application – Global Dosimeter Sales Market Share, 2020-2032
5.4 Segment by Application – Global Dosimeter Price (Manufacturers Selling Prices), 2020-2032
6 Sights by Region
6.1 By Region – Global Dosimeter Market Size, 2024 & 2032
6.2 By Region – Global Dosimeter Revenue & Forecasts
6.2.1 By Region – Global Dosimeter Revenue, 2020-2025
6.2.2 By Region – Global Dosimeter Revenue, 2026-2032
6.2.3 By Region – Global Dosimeter Revenue Market Share, 2020-2032
6.3 By Region – Global Dosimeter Sales & Forecasts
6.3.1 By Region – Global Dosimeter Sales, 2020-2025
6.3.2 By Region – Global Dosimeter Sales, 2026-2032
6.3.3 By Region – Global Dosimeter Sales Market Share, 2020-2032
6.4 North America
6.4.1 By Country – North America Dosimeter Revenue, 2020-2032
6.4.2 By Country – North America Dosimeter Sales, 2020-2032
6.4.3 United States Dosimeter Market Size, 2020-2032
6.4.4 Canada Dosimeter Market Size, 2020-2032
6.4.5 Mexico Dosimeter Market Size, 2020-2032
6.5 Europe
6.5.1 By Country – Europe Dosimeter Revenue, 2020-2032
6.5.2 By Country – Europe Dosimeter Sales, 2020-2032
6.5.3 Germany Dosimeter Market Size, 2020-2032
6.5.4 France Dosimeter Market Size, 2020-2032
6.5.5 U.K. Dosimeter Market Size, 2020-2032
6.5.6 Italy Dosimeter Market Size, 2020-2032
6.5.7 Russia Dosimeter Market Size, 2020-2032
6.5.8 Nordic Countries Dosimeter Market Size, 2020-2032
6.5.9 Benelux Dosimeter Market Size, 2020-2032
6.6 Asia
6.6.1 By Region – Asia Dosimeter Revenue, 2020-2032
6.6.2 By Region – Asia Dosimeter Sales, 2020-2032
6.6.3 China Dosimeter Market Size, 2020-2032
6.6.4 Japan Dosimeter Market Size, 2020-2032
6.6.5 South Korea Dosimeter Market Size, 2020-2032
6.6.6 Southeast Asia Dosimeter Market Size, 2020-2032
6.6.7 India Dosimeter Market Size, 2020-2032
6.7 South America
6.7.1 By Country – South America Dosimeter Revenue, 2020-2032
6.7.2 By Country – South America Dosimeter Sales, 2020-2032
6.7.3 Brazil Dosimeter Market Size, 2020-2032
6.7.4 Argentina Dosimeter Market Size, 2020-2032
6.8 Middle East & Africa
6.8.1 By Country – Middle East & Africa Dosimeter Revenue, 2020-2032
6.8.2 By Country – Middle East & Africa Dosimeter Sales, 2020-2032
6.8.3 Turkey Dosimeter Market Size, 2020-2032
6.8.4 Israel Dosimeter Market Size, 2020-2032
6.8.5 Saudi Arabia Dosimeter Market Size, 2020-2032
6.8.6 UAE Dosimeter Market Size, 2020-2032
7 Manufacturers & Brands Profiles
7.1 Landauer
7.1.1 Landauer Company Summary
7.1.2 Landauer Business Overview
7.1.3 Landauer Dosimeter Major Product Offerings
7.1.4 Landauer Dosimeter Sales and Revenue in Global (2020-2025)
7.1.5 Landauer Key News & Latest Developments
7.2 Mirion Technologies
7.2.1 Mirion Technologies Company Summary
7.2.2 Mirion Technologies Business Overview
7.2.3 Mirion Technologies Dosimeter Major Product Offerings
7.2.4 Mirion Technologies Dosimeter Sales and Revenue in Global (2020-2025)
7.2.5 Mirion Technologies Key News & Latest Developments
7.3 ATOMTEX
7.3.1 ATOMTEX Company Summary
7.3.2 ATOMTEX Business Overview
7.3.3 ATOMTEX Dosimeter Major Product Offerings
7.3.4 ATOMTEX Dosimeter Sales and Revenue in Global (2020-2025)
7.3.5 ATOMTEX Key News & Latest Developments
7.4 Aloka
7.4.1 Aloka Company Summary
7.4.2 Aloka Business Overview
7.4.3 Aloka Dosimeter Major Product Offerings
7.4.4 Aloka Dosimeter Sales and Revenue in Global (2020-2025)
7.4.5 Aloka Key News & Latest Developments
7.5 Fuji Electric
7.5.1 Fuji Electric Company Summary
7.5.2 Fuji Electric Business Overview
7.5.3 Fuji Electric Dosimeter Major Product Offerings
7.5.4 Fuji Electric Dosimeter Sales and Revenue in Global (2020-2025)
7.5.5 Fuji Electric Key News & Latest Developments
7.6 Thermo Fisher Scientific
7.6.1 Thermo Fisher Scientific Company Summary
7.6.2 Thermo Fisher Scientific Business Overview
7.6.3 Thermo Fisher Scientific Dosimeter Major Product Offerings
7.6.4 Thermo Fisher Scientific Dosimeter Sales and Revenue in Global (2020-2025)
7.6.5 Thermo Fisher Scientific Key News & Latest Developments
7.7 IBA Dosimetry
7.7.1 IBA Dosimetry Company Summary
7.7.2 IBA Dosimetry Business Overview
7.7.3 IBA Dosimetry Dosimeter Major Product Offerings
7.7.4 IBA Dosimetry Dosimeter Sales and Revenue in Global (2020-2025)
7.7.5 IBA Dosimetry Key News & Latest Developments
7.8 Unfors RaySafe
7.8.1 Unfors RaySafe Company Summary
7.8.2 Unfors RaySafe Business Overview
7.8.3 Unfors RaySafe Dosimeter Major Product Offerings
7.8.4 Unfors RaySafe Dosimeter Sales and Revenue in Global (2020-2025)
7.8.5 Unfors RaySafe Key News & Latest Developments
7.9 Tracerco
7.9.1 Tracerco Company Summary
7.9.2 Tracerco Business Overview
7.9.3 Tracerco Dosimeter Major Product Offerings
7.9.4 Tracerco Dosimeter Sales and Revenue in Global (2020-2025)
7.9.5 Tracerco Key News & Latest Developments
7.10 Panasonic
7.10.1 Panasonic Company Summary
7.10.2 Panasonic Business Overview
7.10.3 Panasonic Dosimeter Major Product Offerings
7.10.4 Panasonic Dosimeter Sales and Revenue in Global (2020-2025)
7.10.5 Panasonic Key News & Latest Developments
7.11 Ludlum Measurements
7.11.1 Ludlum Measurements Company Summary
7.11.2 Ludlum Measurements Business Overview
7.11.3 Ludlum Measurements Dosimeter Major Product Offerings
7.11.4 Ludlum Measurements Dosimeter Sales and Revenue in Global (2020-2025)
7.11.5 Ludlum Measurements Key News & Latest Developments
7.12 Radiation Detection Company
7.12.1 Radiation Detection Company Company Summary
7.12.2 Radiation Detection Company Business Overview
7.12.3 Radiation Detection Company Dosimeter Major Product Offerings
7.12.4 Radiation Detection Company Dosimeter Sales and Revenue in Global (2020-2025)
7.12.5 Radiation Detection Company Key News & Latest Developments
7.13 Canberra
7.13.1 Canberra Company Summary
7.13.2 Canberra Business Overview
7.13.3 Canberra Dosimeter Major Product Offerings
7.13.4 Canberra Dosimeter Sales and Revenue in Global (2020-2025)
7.13.5 Canberra Key News & Latest Developments
7.14 Polimaster
7.14.1 Polimaster Company Summary
7.14.2 Polimaster Business Overview
7.14.3 Polimaster Dosimeter Major Product Offerings
7.14.4 Polimaster Dosimeter Sales and Revenue in Global (2020-2025)
7.14.5 Polimaster Key News & Latest Developments
7.15 Arrow-Tech
7.15.1 Arrow-Tech Company Summary
7.15.2 Arrow-Tech Business Overview
7.15.3 Arrow-Tech Dosimeter Major Product Offerings
7.15.4 Arrow-Tech Dosimeter Sales and Revenue in Global (2020-2025)
7.15.5 Arrow-Tech Key News & Latest Developments
7.16 Radiation Monitoring Devices
7.16.1 Radiation Monitoring Devices Company Summary
7.16.2 Radiation Monitoring Devices Business Overview
7.16.3 Radiation Monitoring Devices Dosimeter Major Product Offerings
7.16.4 Radiation Monitoring Devices Dosimeter Sales and Revenue in Global (2020-2025)
7.16.5 Radiation Monitoring Devices Key News & Latest Developments
7.17 Biodex Medical Systems
7.17.1 Biodex Medical Systems Company Summary
7.17.2 Biodex Medical Systems Business Overview
7.17.3 Biodex Medical Systems Dosimeter Major Product Offerings
7.17.4 Biodex Medical Systems Dosimeter Sales and Revenue in Global (2020-2025)
7.17.5 Biodex Medical Systems Key News & Latest Developments
7.18 Laurus
7.18.1 Laurus Company Summary
7.18.2 Laurus Business Overview
7.18.3 Laurus Dosimeter Major Product Offerings
7.18.4 Laurus Dosimeter Sales and Revenue in Global (2020-2025)
7.18.5 Laurus Key News & Latest Developments
8 Global Dosimeter Production Capacity, Analysis
8.1 Global Dosimeter Production Capacity, 2020-2032
8.2 Dosimeter Production Capacity of Key Manufacturers in Global Market
8.3 Global Dosimeter Production by Region
9 Key Market Trends, Opportunity, Drivers and Restraints
9.1 Market Opportunities & Trends
9.2 Market Drivers
9.3 Market Restraints
10 Dosimeter Supply Chain Analysis
10.1 Dosimeter Industry Value Chain
10.2 Dosimeter Upstream Market
10.3 Dosimeter Downstream and Clients
10.4 Marketing Channels Analysis
10.4.1 Marketing Channels
10.4.2 Dosimeter Distributors and Sales Agents in Global
11 Conclusion
12 Appendix
12.1 Note
12.2 Examples of Clients
12.3 DisclaimerList of Tables
Table 1. Key Players of Dosimeter in Global Market
Table 2. Top Dosimeter Players in Global Market, Ranking by Revenue (2024)
Table 3. Global Dosimeter Revenue by Companies, (US$, Mn), 2020-2025
Table 4. Global Dosimeter Revenue Share by Companies, 2020-2025
Table 5. Global Dosimeter Sales by Companies, (K Units), 2020-2025
Table 6. Global Dosimeter Sales Share by Companies, 2020-2025
Table 7. Key Manufacturers Dosimeter Price (2020-2025) & (USD/Unit)
Table 8. Global Manufacturers Dosimeter Product Type
Table 9. List of Global Tier 1 Dosimeter Companies, Revenue (US$, Mn) in 2024 and Market Share
Table 10. List of Global Tier 2 and Tier 3 Dosimeter Companies, Revenue (US$, Mn) in 2024 and Market Share
Table 11. Segment by Type – Global Dosimeter Revenue, (US$, Mn), 2024 & 2032
Table 12. Segment by Type – Global Dosimeter Revenue (US$, Mn), 2020-2025
Table 13. Segment by Type – Global Dosimeter Revenue (US$, Mn), 2026-2032
Table 14. Segment by Type – Global Dosimeter Sales (K Units), 2020-2025
Table 15. Segment by Type – Global Dosimeter Sales (K Units), 2026-2032
Table 16. Segment by Application – Global Dosimeter Revenue, (US$, Mn), 2024 & 2032
Table 17. Segment by Application – Global Dosimeter Revenue, (US$, Mn), 2020-2025
Table 18. Segment by Application – Global Dosimeter Revenue, (US$, Mn), 2026-2032
Table 19. Segment by Application – Global Dosimeter Sales, (K Units), 2020-2025
Table 20. Segment by Application – Global Dosimeter Sales, (K Units), 2026-2032
Table 21. By Region – Global Dosimeter Revenue, (US$, Mn), 2025-2032
Table 22. By Region – Global Dosimeter Revenue, (US$, Mn), 2020-2025
Table 23. By Region – Global Dosimeter Revenue, (US$, Mn), 2026-2032
Table 24. By Region – Global Dosimeter Sales, (K Units), 2020-2025
Table 25. By Region – Global Dosimeter Sales, (K Units), 2026-2032
Table 26. By Country – North America Dosimeter Revenue, (US$, Mn), 2020-2025
Table 27. By Country – North America Dosimeter Revenue, (US$, Mn), 2026-2032
Table 28. By Country – North America Dosimeter Sales, (K Units), 2020-2025
Table 29. By Country – North America Dosimeter Sales, (K Units), 2026-2032
Table 30. By Country – Europe Dosimeter Revenue, (US$, Mn), 2020-2025
Table 31. By Country – Europe Dosimeter Revenue, (US$, Mn), 2026-2032
Table 32. By Country – Europe Dosimeter Sales, (K Units), 2020-2025
Table 33. By Country – Europe Dosimeter Sales, (K Units), 2026-2032
Table 34. By Region – Asia Dosimeter Revenue, (US$, Mn), 2020-2025
Table 35. By Region – Asia Dosimeter Revenue, (US$, Mn), 2026-2032
Table 36. By Region – Asia Dosimeter Sales, (K Units), 2020-2025
Table 37. By Region – Asia Dosimeter Sales, (K Units), 2026-2032
Table 38. By Country – South America Dosimeter Revenue, (US$, Mn), 2020-2025
Table 39. By Country – South America Dosimeter Revenue, (US$, Mn), 2026-2032
Table 40. By Country – South America Dosimeter Sales, (K Units), 2020-2025
Table 41. By Country – South America Dosimeter Sales, (K Units), 2026-2032
Table 42. By Country – Middle East & Africa Dosimeter Revenue, (US$, Mn), 2020-2025
Table 43. By Country – Middle East & Africa Dosimeter Revenue, (US$, Mn), 2026-2032
Table 44. By Country – Middle East & Africa Dosimeter Sales, (K Units), 2020-2025
Table 45. By Country – Middle East & Africa Dosimeter Sales, (K Units), 2026-2032
Table 46. Landauer Company Summary
Table 47. Landauer Dosimeter Product Offerings
Table 48. Landauer Dosimeter Sales (K Units), Revenue (US$, Mn) and Average Price (USD/Unit) & (2020-2025)
Table 49. Landauer Key News & Latest Developments
Table 50. Mirion Technologies Company Summary
Table 51. Mirion Technologies Dosimeter Product Offerings
Table 52. Mirion Technologies Dosimeter Sales (K Units), Revenue (US$, Mn) and Average Price (USD/Unit) & (2020-2025)
Table 53. Mirion Technologies Key News & Latest Developments
Table 54. ATOMTEX Company Summary
Table 55. ATOMTEX Dosimeter Product Offerings
Table 56. ATOMTEX Dosimeter Sales (K Units), Revenue (US$, Mn) and Average Price (USD/Unit) & (2020-2025)
Table 57. ATOMTEX Key News & Latest Developments
Table 58. Aloka Company Summary
Table 59. Aloka Dosimeter Product Offerings
Table 60. Aloka Dosimeter Sales (K Units), Revenue (US$, Mn) and Average Price (USD/Unit) & (2020-2025)
Table 61. Aloka Key News & Latest Developments
Table 62. Fuji Electric Company Summary
Table 63. Fuji Electric Dosimeter Product Offerings
Table 64. Fuji Electric Dosimeter Sales (K Units), Revenue (US$, Mn) and Average Price (USD/Unit) & (2020-2025)
Table 65. Fuji Electric Key News & Latest Developments
Table 66. Thermo Fisher Scientific Company Summary
Table 67. Thermo Fisher Scientific Dosimeter Product Offerings
Table 68. Thermo Fisher Scientific Dosimeter Sales (K Units), Revenue (US$, Mn) and Average Price (USD/Unit) & (2020-2025)
Table 69. Thermo Fisher Scientific Key News & Latest Developments
Table 70. IBA Dosimetry Company Summary
Table 71. IBA Dosimetry Dosimeter Product Offerings
Table 72. IBA Dosimetry Dosimeter Sales (K Units), Revenue (US$, Mn) and Average Price (USD/Unit) & (2020-2025)
Table 73. IBA Dosimetry Key News & Latest Developments
Table 74. Unfors RaySafe Company Summary
Table 75. Unfors RaySafe Dosimeter Product Offerings
Table 76. Unfors RaySafe Dosimeter Sales (K Units), Revenue (US$, Mn) and Average Price (USD/Unit) & (2020-2025)
Table 77. Unfors RaySafe Key News & Latest Developments
Table 78. Tracerco Company Summary
Table 79. Tracerco Dosimeter Product Offerings
Table 80. Tracerco Dosimeter Sales (K Units), Revenue (US$, Mn) and Average Price (USD/Unit) & (2020-2025)
Table 81. Tracerco Key News & Latest Developments
Table 82. Panasonic Company Summary
Table 83. Panasonic Dosimeter Product Offerings
Table 84. Panasonic Dosimeter Sales (K Units), Revenue (US$, Mn) and Average Price (USD/Unit) & (2020-2025)
Table 85. Panasonic Key News & Latest Developments
Table 86. Ludlum Measurements Company Summary
Table 87. Ludlum Measurements Dosimeter Product Offerings
Table 88. Ludlum Measurements Dosimeter Sales (K Units), Revenue (US$, Mn) and Average Price (USD/Unit) & (2020-2025)
Table 89. Ludlum Measurements Key News & Latest Developments
Table 90. Radiation Detection Company Company Summary
Table 91. Radiation Detection Company Dosimeter Product Offerings
Table 92. Radiation Detection Company Dosimeter Sales (K Units), Revenue (US$, Mn) and Average Price (USD/Unit) & (2020-2025)
Table 93. Radiation Detection Company Key News & Latest Developments
Table 94. Canberra Company Summary
Table 95. Canberra Dosimeter Product Offerings
Table 96. Canberra Dosimeter Sales (K Units), Revenue (US$, Mn) and Average Price (USD/Unit) & (2020-2025)
Table 97. Canberra Key News & Latest Developments
Table 98. Polimaster Company Summary
Table 99. Polimaster Dosimeter Product Offerings
Table 100. Polimaster Dosimeter Sales (K Units), Revenue (US$, Mn) and Average Price (USD/Unit) & (2020-2025)
Table 101. Polimaster Key News & Latest Developments
Table 102. Arrow-Tech Company Summary
Table 103. Arrow-Tech Dosimeter Product Offerings
Table 104. Arrow-Tech Dosimeter Sales (K Units), Revenue (US$, Mn) and Average Price (USD/Unit) & (2020-2025)
Table 105. Arrow-Tech Key News & Latest Developments
Table 106. Radiation Monitoring Devices Company Summary
Table 107. Radiation Monitoring Devices Dosimeter Product Offerings
Table 108. Radiation Monitoring Devices Dosimeter Sales (K Units), Revenue (US$, Mn) and Average Price (USD/Unit) & (2020-2025)
Table 109. Radiation Monitoring Devices Key News & Latest Developments
Table 110. Biodex Medical Systems Company Summary
Table 111. Biodex Medical Systems Dosimeter Product Offerings
Table 112. Biodex Medical Systems Dosimeter Sales (K Units), Revenue (US$, Mn) and Average Price (USD/Unit) & (2020-2025)
Table 113. Biodex Medical Systems Key News & Latest Developments
Table 114. Laurus Company Summary
Table 115. Laurus Dosimeter Product Offerings
Table 116. Laurus Dosimeter Sales (K Units), Revenue (US$, Mn) and Average Price (USD/Unit) & (2020-2025)
Table 117. Laurus Key News & Latest Developments
Table 118. Dosimeter Capacity of Key Manufacturers in Global Market, 2023-2025 (K Units)
Table 119. Global Dosimeter Capacity Market Share of Key Manufacturers, 2023-2025
Table 120. Global Dosimeter Production by Region, 2020-2025 (K Units)
Table 121. Global Dosimeter Production by Region, 2026-2032 (K Units)
Table 122. Dosimeter Market Opportunities & Trends in Global Market
Table 123. Dosimeter Market Drivers in Global Market
Table 124. Dosimeter Market Restraints in Global Market
Table 125. Dosimeter Raw Materials
Table 126. Dosimeter Raw Materials Suppliers in Global Market
Table 127. Typical Dosimeter Downstream
Table 128. Dosimeter Downstream Clients in Global Market
Table 129. Dosimeter Distributors and Sales Agents in Global Market

List of Figures
Figure 1. Dosimeter Product Picture
Figure 2. Dosimeter Segment by Type in 2024
Figure 3. Dosimeter Segment by Application in 2024
Figure 4. Global Dosimeter Market Overview: 2024
Figure 5. Key Caveats
Figure 6. Global Dosimeter Market Size: 2024 VS 2032 (US$, Mn)
Figure 7. Global Dosimeter Revenue: 2020-2032 (US$, Mn)
Figure 8. Dosimeter Sales in Global Market: 2020-2032 (K Units)
Figure 9. The Top 3 and 5 Players Market Share by Dosimeter Revenue in 2024
Figure 10. Segment by Type – Global Dosimeter Revenue, (US$, Mn), 2024 & 2032
Figure 11. Segment by Type – Global Dosimeter Revenue Market Share, 2020-2032
Figure 12. Segment by Type – Global Dosimeter Sales Market Share, 2020-2032
Figure 13. Segment by Type – Global Dosimeter Price (USD/Unit), 2020-2032
Figure 14. Segment by Application – Global Dosimeter Revenue, (US$, Mn), 2024 & 2032
Figure 15. Segment by Application – Global Dosimeter Revenue Market Share, 2020-2032
Figure 16. Segment by Application – Global Dosimeter Sales Market Share, 2020-2032
Figure 17. Segment by Application -Global Dosimeter Price (USD/Unit), 2020-2032
Figure 18. By Region – Global Dosimeter Revenue, (US$, Mn), 2025 & 2032
Figure 19. By Region – Global Dosimeter Revenue Market Share, 2020 VS 2024 VS 2032
Figure 20. By Region – Global Dosimeter Revenue Market Share, 2020-2032
Figure 21. By Region – Global Dosimeter Sales Market Share, 2020-2032
Figure 22. By Country – North America Dosimeter Revenue Market Share, 2020-2032
Figure 23. By Country – North America Dosimeter Sales Market Share, 2020-2032
Figure 24. United States Dosimeter Revenue, (US$, Mn), 2020-2032
Figure 25. Canada Dosimeter Revenue, (US$, Mn), 2020-2032
Figure 26. Mexico Dosimeter Revenue, (US$, Mn), 2020-2032
Figure 27. By Country – Europe Dosimeter Revenue Market Share, 2020-2032
Figure 28. By Country – Europe Dosimeter Sales Market Share, 2020-2032
Figure 29. Germany Dosimeter Revenue, (US$, Mn), 2020-2032
Figure 30. France Dosimeter Revenue, (US$, Mn), 2020-2032
Figure 31. U.K. Dosimeter Revenue, (US$, Mn), 2020-2032
Figure 32. Italy Dosimeter Revenue, (US$, Mn), 2020-2032
Figure 33. Russia Dosimeter Revenue, (US$, Mn), 2020-2032
Figure 34. Nordic Countries Dosimeter Revenue, (US$, Mn), 2020-2032
Figure 35. Benelux Dosimeter Revenue, (US$, Mn), 2020-2032
Figure 36. By Region – Asia Dosimeter Revenue Market Share, 2020-2032
Figure 37. By Region – Asia Dosimeter Sales Market Share, 2020-2032
Figure 38. China Dosimeter Revenue, (US$, Mn), 2020-2032
Figure 39. Japan Dosimeter Revenue, (US$, Mn), 2020-2032
Figure 40. South Korea Dosimeter Revenue, (US$, Mn), 2020-2032
Figure 41. Southeast Asia Dosimeter Revenue, (US$, Mn), 2020-2032
Figure 42. India Dosimeter Revenue, (US$, Mn), 2020-2032
Figure 43. By Country – South America Dosimeter Revenue Market Share, 2020-2032
Figure 44. By Country – South America Dosimeter Sales, Market Share, 2020-2032
Figure 45. Brazil Dosimeter Revenue, (US$, Mn), 2020-2032
Figure 46. Argentina Dosimeter Revenue, (US$, Mn), 2020-2032
Figure 47. By Country – Middle East & Africa Dosimeter Revenue, Market Share, 2020-2032
Figure 48. By Country – Middle East & Africa Dosimeter Sales, Market Share, 2020-2032
Figure 49. Turkey Dosimeter Revenue, (US$, Mn), 2020-2032
Figure 50. Israel Dosimeter Revenue, (US$, Mn), 2020-2032
Figure 51. Saudi Arabia Dosimeter Revenue, (US$, Mn), 2020-2032
Figure 52. UAE Dosimeter Revenue, (US$, Mn), 2020-2032
Figure 53. Global Dosimeter Production Capacity (K Units), 2020-2032
Figure 54. The Percentage of Production Dosimeter by Region, 2024 VS 2032
Figure 55. Dosimeter Industry Value Chain
Figure 56. Marketing Channels