DC Balanced Bridge Market, Trends, Business Strategies 2026-2034

DC Balanced Bridge Market size was valued at USD 320 million in 2025. The market is projected to grow from USD 345 million in 2026 to USD 480 million by 2034, exhibiting a CAGR of 4.2% during the forecast period.

PDF Icon Download Sample Report PDF
  • Quick Dispatch

    All Orders

  • Secure Payment

    100% Secure Payment

Price range: $1,500.00 through $4,250.00

Clear

Market Insights

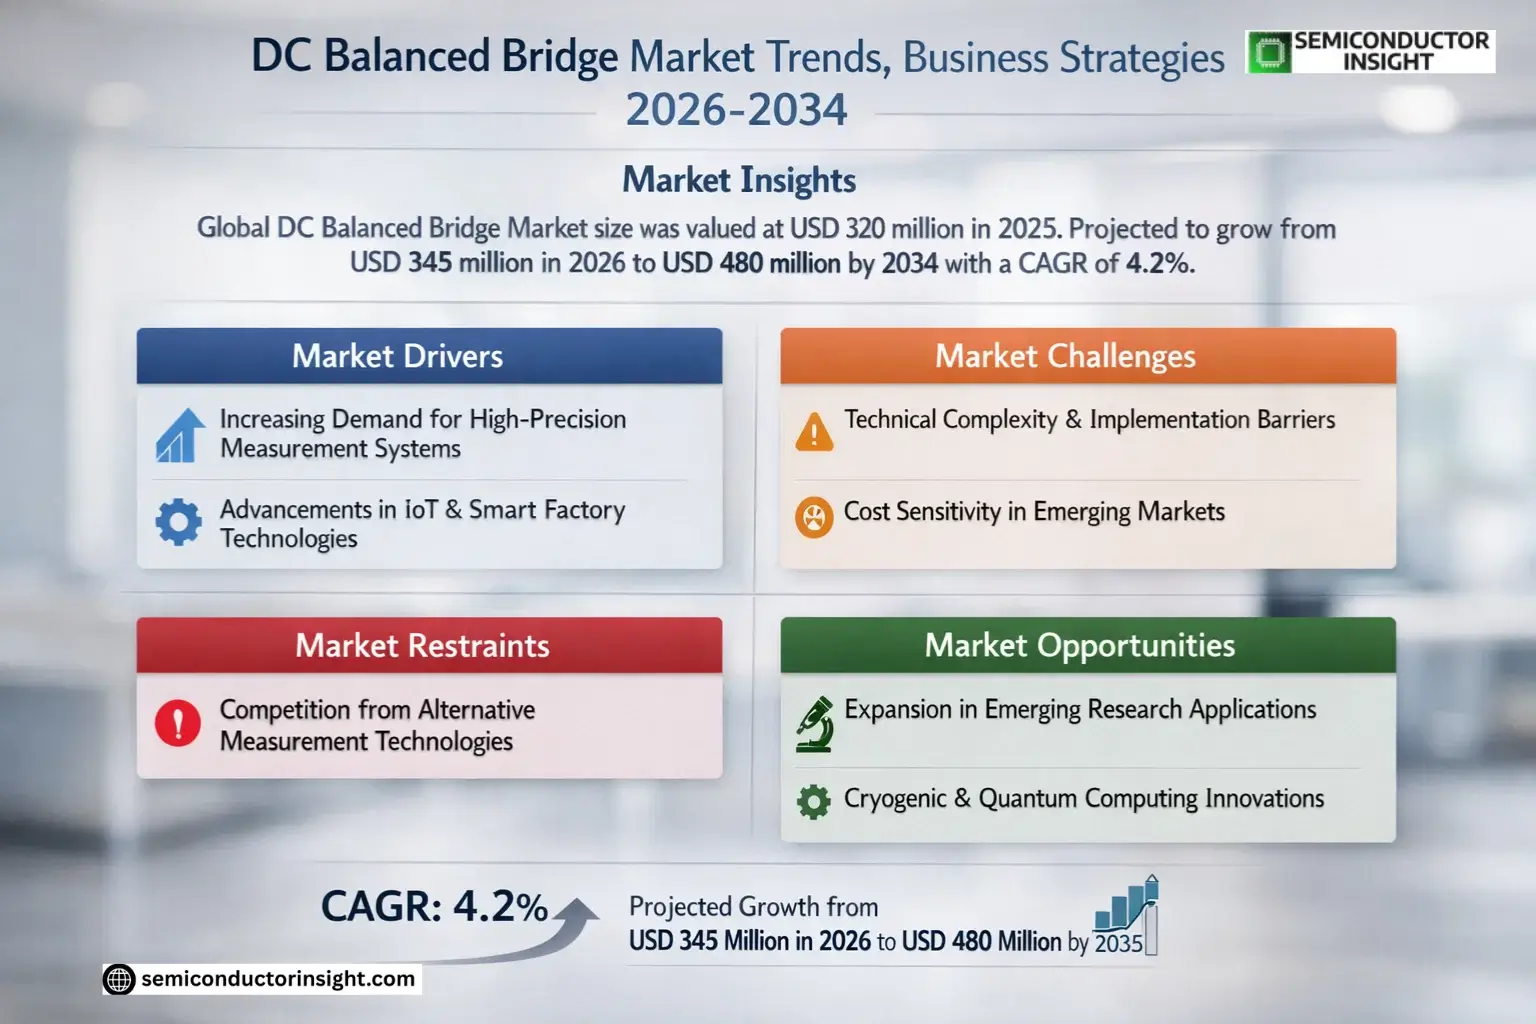
Global DC Balanced Bridge Market size was valued at USD 320 million in 2025. The market is projected to grow from USD 345 million in 2026 to USD 480 million by 2034, exhibiting a CAGR of 4.2% during the forecast period.

A DC balanced bridge is a precision measuring instrument based on the Wheatstone bridge principle, primarily used for accurate resistance or voltage measurements. It operates by balancing two circuit branches through adjustable resistors, achieving zero output voltage when potentials match. This configuration ensures high accuracy in industrial automation, circuit testing, and research applications.

Market growth is driven by increasing demand for precision measurement tools in electronics manufacturing and energy sectors. Key players like Keysight Technologies and Fluke Corporation are expanding their product portfolios with advanced digital bridges featuring automated calibration. The single-arm bridge segment dominates due to its cost-effectiveness in basic measurement tasks, while Asia-Pacific leads regional adoption with 38% market share in 2025.

DC Balanced Bridge Market Size & Forecast

MARKET DRIVERS

Increasing Demand for High-Precision Measurement Systems

DC Balanced Bridge Market is experiencing growth due to rising demand for high-precision measurement systems in industries such as semiconductor manufacturing, aerospace, and telecommunications. These precision instruments play a critical role in ensuring accurate resistance measurements, with tolerances as tight as 0.01% becoming increasingly common in industrial applications.

Advancements in IoT and Smart Factory Technologies

Integration of DC balanced bridges with IoT platforms is creating new opportunities, particularly in smart manufacturing environments. Modern DC balanced bridge designs now incorporate digital interfaces compatible with Industry 4.0 standards, allowing for real-time monitoring and adaptive calibration.

Growing emphasis on quality control across multiple industries is further driving adoption. The ability of DC balanced bridges to provide traceable measurements makes them indispensable for compliance with international quality standards.

MARKET CHALLENGES

Technical Complexity and Implementation Barriers

While DC balanced bridges offer superior measurement accuracy, their complex operational requirements pose challenges for broader adoption. Many end-users require specialized training to properly utilize these instruments, particularly when working with sensitive high-impedance circuits or ultra-precision applications.

Other Challenges

Cost Sensitivity in Emerging Markets
The premium pricing of industrial-grade DC balanced bridge systems remains a barrier in price-sensitive developing markets, where companies often opt for less accurate but more affordable alternatives.

MARKET RESTRAINTS

Competition from Alternative Measurement Technologies

DC Balanced Bridge Market faces pressure from emerging digital measurement solutions that offer simpler operation. However, for ultra-high-precision applications in fields like metrology labs and quantum research, DC balanced bridges remain irreplaceable due to their fundamental measurement principles and proven reliability.

MARKET OPPORTUNITIES

Expansion in Emerging Research Applications

Growing research in nanotechnology and quantum computing is creating new demand for DC balanced bridges with enhanced sensitivity. Manufacturers are developing cryogenic-optimized versions capable of operating at temperatures below 4K, opening opportunities in cutting-edge physics research facilities.

DC Balanced Bridge Market Trends
Precision Measurement Advancements Drive Market Growth

DC Balanced Bridge Market is experiencing steady growth due to increasing demand for high-precision resistance and voltage measurement tools across industries. These instruments leverage the bridge balance condition principle to achieve accurate measurements when output voltage reaches zero. The technology’s reliability makes it indispensable for quality control processes in electronics manufacturing and industrial automation.

Other Trends

Single-arm vs. Double-arm Bridge Segment Dynamics

Single-arm bridge models currently hold significant market share due to their cost-effectiveness in basic measurement applications. However, double-arm bridge configurations are gaining traction for complex testing scenarios requiring higher accuracy thresholds. Manufacturers are investing in R&D to enhance the precision capabilities of both variants.

Regional Market Developments

North America and Asia-Pacific regions are demonstrating particularly strong demand for DC Balanced Bridge equipment. The U.S. maintains leadership in advanced measurement technologies, while China’s rapid industrial expansion fuels local market growth. European manufacturers continue to focus on high-precision applications for specialized industrial and research purposes.

Key Applications Driving Adoption

Circuit testing represents the dominant application segment, followed closely by industrial automation systems. Educational institutions are increasingly incorporating DC Balanced Bridge technology into engineering curricula, creating steady demand from the teaching research sector. This educational adoption is expected to support long-term market sustainability.

Competitive Landscape Evolution

The market remains consolidated among established players like Keysight Technologies, Fluke Corporation, and Yokogawa Electric. Recent years have seen emerging competitors from Asia gaining market share through competitive pricing strategies. Industry leaders are responding with strategic partnerships and product innovation to maintain technological leadership positions.

COMPETITIVE LANDSCAPE

Key Industry Players

Global DC Balanced Bridge Market Competitive Analysis (2025-2034)

DC Balanced Bridge Market is dominated by precision measurement equipment specialists, with Keysight Technologies and Fluke Corporation leading through their comprehensive product portfolios and global distribution networks. These top players collectively hold approximately XX% market share as of 2025, leveraging their strong R&D capabilities and established brand reputation in test and measurement equipment.

Niche players like Tonghui and Shenzhen Yuance Technology are gaining traction in specific regional markets, particularly in Asia, by offering cost-competitive alternatives. Japanese and Chinese manufacturers continue to strengthen their positions through technological advancements and strategic partnerships with industrial automation providers.

List of Key DC Balanced Bridge Companies Profiled

  • Keysight Technologies
  • Fluke Corporation
  • National Instruments
  • Yokogawa Electric
  • B&K Precision
  • Megger
  • Tonghui
  • Agilent Technologies
  • Baoding Huazheng Electric Manufacturing
  • Shenzhen Yuance Technology
  • Shanghai Shuangxu Electronics
  • National Instruments
  • Shenzhen Concept Instruments
  • Yokogawa Electric
  • Shenzhen Tongce Electronic Instruments

Segment Analysis:

Segment Category Sub-Segments Key Insights
By Type
  • Single-arm Bridge
  • Double-arm Bridge
Single-arm Bridge dominates due to its widespread adoption in educational and research institutions.

  • Preferred for basic resistance measurements with simpler calibration requirements
  • Cost-effective solution for low-precision industrial applications
  • Higher compatibility with legacy testing systems in manufacturing environments
By Application
  • Circuit Test
  • Industrial Automation
  • Teaching Research
  • Others
Industrial Automation shows strongest adoption trends with growing smart manufacturing needs.

  • Critical for quality control in PCB production lines and component testing
  • Integration with automated test equipment drives demand for precision models
  • Emerging applications in semiconductor wafer testing facilities
By End User
  • Electronics Manufacturers
  • Research Institutions
  • Calibration Laboratories
Electronics Manufacturers represent the largest customer base due to continuous testing requirements.

  • Demand driven by miniaturization trends in consumer electronics
  • Requirement for high-accuracy models in medical device production
  • Increasing adoption in automotive component manufacturing
By Precision Level
  • Standard Precision
  • High Precision
  • Ultra Precision
High Precision segment shows strongest growth potential across industries.

  • Increasing requirements in aerospace and defense applications
  • Critical for nanotechnology research and development
  • Premium pricing models support higher profit margins
By Technology
  • Analog
  • Digital
  • Hybrid
Digital technology adoption accelerating with Industry 4.0 trends.

  • Enables direct interface with digital control systems
  • Supports automated data logging and analysis capabilities
  • Lower maintenance requirements compared to analog counterparts

Regional Analysis: Global DC Balanced Bridge Market

North America

North America dominates the DC Balanced Bridge Market with advanced semiconductor infrastructure and robust R&D investments. The region benefits from strong presence of key manufacturers and early adoption of power electronics technologies. The US leads with extensive deployment of these components in renewable energy systems and industrial automation. Growing focus on energy efficiency in data centers and electric vehicles further drives demand. Strategic collaborations between research institutions and corporations accelerate technological advancements in this sector. Canada shows emerging potential with increasing smart grid implementations and clean energy initiatives.

Technology Integration
The region leads in integrating DC Balanced Bridge circuits with IoT platforms and AI-based monitoring systems. This enables predictive maintenance and optimized performance in power distribution networks.
Regulatory Support
Favorable government policies promoting energy-efficient technologies and strict power quality standards drive market growth. Tax incentives for green energy projects boost adoption across industrial sectors.
Supply Chain Maturity
Well-established semiconductor supply chain facilitates rapid innovation and mass production. Strong relationships between component manufacturers and system integrators ensure reliable market supply.
Application Diversity
From aerospace power systems to medical equipment, DC Balanced Bridge solutions find applications across multiple high-value industries, creating stable demand growth.

Europe
Europe represents the second-largest DC Balanced Bridge Market with strict energy efficiency directives driving adoption. Germany leads with its strong automotive sector incorporating these components in EV charging infrastructure. The region benefits from collaborative research programs between universities and industry players. Renewable energy projects across Scandinavia utilize advanced power electronics for grid stability. UK manufacturers focus on compact, high-efficiency designs for space-constrained applications.

Asia-Pacific
Asia-Pacific shows the fastest growth in DC Balanced Bridge adoption, led by China’s massive renewable energy investments. The region benefits from cost-competitive manufacturing and expanding electronics production base. Japan maintains technological leadership in precision power components. India’s smart city projects and industrial automation drive increasing demand. South Korea’s focus on semiconductor innovation yields advanced solutions for high-frequency applications.

South America
South America presents emerging opportunities with modernization of power infrastructure. Brazil leads market growth with increasing renewable energy capacity requiring grid stabilization solutions. Mining operations adopt these components for reliable power conversion. The region shows potential for mid-tier performance products balancing cost and quality for developing markets.

Middle East & Africa
The Middle East demonstrates growing interest in DC Balanced Bridge solutions for oil and gas applications and desalination plants. Solar energy projects across Africa create demand for robust power conversion systems. The market remains price-sensitive with preference for durable, maintenance-free designs suitable for harsh operating conditions.

Report Scope

This market research report provides a comprehensive analysis of the DC Balanced Bridge Market , covering the forecast period 2025–2034. It offers detailed insights into market dynamics, technological advancements, competitive landscape, and key trends shaping the industry.

Key focus areas of the report include:

  • Market Overview: The report begins with an overview outlining its current market scenario, key growth indicators, and industry transformation drivers. It discusses macroeconomic factors, demand–supply balance, regulatory landscape, and the strategic role of precision measurement instruments in various industries.
  • Market Size & Forecast: Historical data and future projections for revenue, unit shipments, and market value across major regions and segments.
  • Segmentation Analysis: Detailed breakdown by product type, application, and end-user industry to identify high-growth segments and investment opportunities.
  • Regional Insights: Insights into market performance across North America, Europe, Asia, South America, and Middle East & Africa, including country-level analysis where relevant.
  • Competitive Landscape: Profiles of leading market participants, including their product offerings, R&D focus, manufacturing capacity, pricing strategies, and recent developments such as mergers, acquisitions, and partnerships.
  • Technology Trends & Innovation: Assessment of emerging bridge measurement technologies and evolving industry standards.
  • Market Drivers & Restraints: Evaluation of factors driving market growth along with challenges, supply chain constraints, regulatory issues, and market-entry barriers.
  • Stakeholder Insights: Insights for component suppliers, OEMs, system integrators, investors, and policymakers regarding the evolving ecosystem and strategic opportunities.

Primary and secondary research methods are employed, including interviews with industry experts, data from verified sources, and real-time market intelligence to ensure the accuracy and reliability of the insights presented.

FREQUENTLY ASKED QUESTIONS:

What is the current market size of DC Balanced Bridge Market?

-> DC Balanced Bridge Market size was valued at USD 320 million in 2025. The market is projected to grow from USD 345 million in 2026 to USD 480 million by 2034, exhibiting a CAGR of 4.2% during the forecast period.

Which key companies operate in DC Balanced Bridge Market?

-> Key players include Keysight Technologies, Fluke Corporation, National Instruments, Yokogawa Electric, B&K Precision, Megger, Tonghui, Agilent Technologies, Baoding Huazheng Electric Manufacturing, and Shenzhen Yuance Technology, among others.

What are the key growth drivers?

-> Key growth drivers include increasing demand for precision measurement in circuit testing, industrial automation requirements, and advancements in electrical measurement technologies.

Which region dominates the market?

-> Asia is the fastest-growing region, particularly China, while North America remains a technologically advanced market.

What are the main product segments?

-> The market is segmented into Single-arm Bridge and Double-arm Bridge types, with Single-arm Bridge expected to reach USD million by 2034.

DC Balanced Bridge Market, Trends, Business Strategies 2026-2034

Get Sample Report PDF for Exclusive Insights

Report Sample Includes

  • Table of Contents
  • List of Tables & Figures
  • Charts, Research Methodology, and more...
PDF Icon Download Sample Report PDF
SKU: 31b3604c8eb2
Category:
License Type

Corporate License, Excel License, PDF and Excel Databook License

Download Sample Report

Table of Content

1 Introduction to Research & Analysis Reports
1.1 DC Balanced Bridge Market Definition
1.2 Market Segments
1.2.1 Segment by Type
1.2.2 Segment by Application
1.3 Global DC Balanced Bridge Market Overview
1.4 Features & Benefits of This Report
1.5 Methodology & Sources of Information
1.5.1 Research Methodology
1.5.2 Research Process
1.5.3 Base Year
1.5.4 Report Assumptions & Caveats
2 Global DC Balanced Bridge Overall Market Size
2.1 Global DC Balanced Bridge Market Size: 2025 VS 2034
2.2 Global DC Balanced Bridge Market Size, Prospects & Forecasts: 2021-2034
2.3 Global DC Balanced Bridge Sales: 2021-2034
3 Company Landscape
3.1 Top DC Balanced Bridge Players in Global Market
3.2 Top Global DC Balanced Bridge Companies Ranked by Revenue
3.3 Global DC Balanced Bridge Revenue by Companies
3.4 Global DC Balanced Bridge Sales by Companies
3.5 Global DC Balanced Bridge Price by Manufacturer (2021-2026)
3.6 Top 3 and Top 5 DC Balanced Bridge Companies in Global Market, by Revenue in 2025
3.7 Global Manufacturers DC Balanced Bridge Product Type
3.8 Tier 1, Tier 2, and Tier 3 DC Balanced Bridge Players in Global Market
3.8.1 List of Global Tier 1 DC Balanced Bridge Companies
3.8.2 List of Global Tier 2 and Tier 3 DC Balanced Bridge Companies
4 Sights by Type
4.1 Overview
4.1.1 Segment by Type – Global DC Balanced Bridge Market Size Markets, 2025 & 2034
4.1.2 Single-arm Bridge
4.1.3 Double-arm Bridge
4.2 Segment by Type – Global DC Balanced Bridge Revenue & Forecasts
4.2.1 Segment by Type – Global DC Balanced Bridge Revenue, 2021-2026
4.2.2 Segment by Type – Global DC Balanced Bridge Revenue, 2027-2034
4.2.3 Segment by Type – Global DC Balanced Bridge Revenue Market Share, 2021-2034
4.3 Segment by Type – Global DC Balanced Bridge Sales & Forecasts
4.3.1 Segment by Type – Global DC Balanced Bridge Sales, 2021-2026
4.3.2 Segment by Type – Global DC Balanced Bridge Sales, 2027-2034
4.3.3 Segment by Type – Global DC Balanced Bridge Sales Market Share, 2021-2034
4.4 Segment by Type – Global DC Balanced Bridge Price (Manufacturers Selling Prices), 2021-2034
5 Sights by Application
5.1 Overview
5.1.1 Segment by Application – Global DC Balanced Bridge Market Size, 2025 & 2034
5.1.2 Circuit Test
5.1.3 Industrial Automation
5.1.4 Teaching Research
5.1.5 Other
5.2 Segment by Application – Global DC Balanced Bridge Revenue & Forecasts
5.2.1 Segment by Application – Global DC Balanced Bridge Revenue, 2021-2026
5.2.2 Segment by Application – Global DC Balanced Bridge Revenue, 2027-2034
5.2.3 Segment by Application – Global DC Balanced Bridge Revenue Market Share, 2021-2034
5.3 Segment by Application – Global DC Balanced Bridge Sales & Forecasts
5.3.1 Segment by Application – Global DC Balanced Bridge Sales, 2021-2026
5.3.2 Segment by Application – Global DC Balanced Bridge Sales, 2027-2034
5.3.3 Segment by Application – Global DC Balanced Bridge Sales Market Share, 2021-2034
5.4 Segment by Application – Global DC Balanced Bridge Price (Manufacturers Selling Prices), 2021-2034
6 Sights Region
6.1 By Region – Global DC Balanced Bridge Market Size, 2025 & 2034
6.2 By Region – Global DC Balanced Bridge Revenue & Forecasts
6.2.1 By Region – Global DC Balanced Bridge Revenue, 2021-2026
6.2.2 By Region – Global DC Balanced Bridge Revenue, 2027-2034
6.2.3 By Region – Global DC Balanced Bridge Revenue Market Share, 2021-2034
6.3 By Region – Global DC Balanced Bridge Sales & Forecasts
6.3.1 By Region – Global DC Balanced Bridge Sales, 2021-2026
6.3.2 By Region – Global DC Balanced Bridge Sales, 2027-2034
6.3.3 By Region – Global DC Balanced Bridge Sales Market Share, 2021-2034
6.4 North America
6.4.1 By Country – North America DC Balanced Bridge Revenue, 2021-2034
6.4.2 By Country – North America DC Balanced Bridge Sales, 2021-2034
6.4.3 United States DC Balanced Bridge Market Size, 2021-2034
6.4.4 Canada DC Balanced Bridge Market Size, 2021-2034
6.4.5 Mexico DC Balanced Bridge Market Size, 2021-2034
6.5 Europe
6.5.1 By Country – Europe DC Balanced Bridge Revenue, 2021-2034
6.5.2 By Country – Europe DC Balanced Bridge Sales, 2021-2034
6.5.3 Germany DC Balanced Bridge Market Size, 2021-2034
6.5.4 France DC Balanced Bridge Market Size, 2021-2034
6.5.5 U.K. DC Balanced Bridge Market Size, 2021-2034
6.5.6 Italy DC Balanced Bridge Market Size, 2021-2034
6.5.7 Russia DC Balanced Bridge Market Size, 2021-2034
6.5.8 Nordic Countries DC Balanced Bridge Market Size, 2021-2034
6.5.9 Benelux DC Balanced Bridge Market Size, 2021-2034
6.6 Asia
6.6.1 By Region – Asia DC Balanced Bridge Revenue, 2021-2034
6.6.2 By Region – Asia DC Balanced Bridge Sales, 2021-2034
6.6.3 China DC Balanced Bridge Market Size, 2021-2034
6.6.4 Japan DC Balanced Bridge Market Size, 2021-2034
6.6.5 South Korea DC Balanced Bridge Market Size, 2021-2034
6.6.6 Southeast Asia DC Balanced Bridge Market Size, 2021-2034
6.6.7 India DC Balanced Bridge Market Size, 2021-2034
6.7 South America
6.7.1 By Country – South America DC Balanced Bridge Revenue, 2021-2034
6.7.2 By Country – South America DC Balanced Bridge Sales, 2021-2034
6.7.3 Brazil DC Balanced Bridge Market Size, 2021-2034
6.7.4 Argentina DC Balanced Bridge Market Size, 2021-2034
6.8 Middle East & Africa
6.8.1 By Country – Middle East & Africa DC Balanced Bridge Revenue, 2021-2034
6.8.2 By Country – Middle East & Africa DC Balanced Bridge Sales, 2021-2034
6.8.3 Turkey DC Balanced Bridge Market Size, 2021-2034
6.8.4 Israel DC Balanced Bridge Market Size, 2021-2034
6.8.5 Saudi Arabia DC Balanced Bridge Market Size, 2021-2034
6.8.6 UAE DC Balanced Bridge Market Size, 2021-2034
7 Manufacturers & Brands Profiles
7.1 Keysight Technologies
7.1.1 Keysight Technologies Company Summary
7.1.2 Keysight Technologies Business Overview
7.1.3 Keysight Technologies DC Balanced Bridge Major Product Offerings
7.1.4 Keysight Technologies DC Balanced Bridge Sales and Revenue in Global (2021-2026)
7.1.5 Keysight Technologies Key News & Latest Developments
7.2 Fluke Corporation
7.2.1 Fluke Corporation Company Summary
7.2.2 Fluke Corporation Business Overview
7.2.3 Fluke Corporation DC Balanced Bridge Major Product Offerings
7.2.4 Fluke Corporation DC Balanced Bridge Sales and Revenue in Global (2021-2026)
7.2.5 Fluke Corporation Key News & Latest Developments
7.3 National Instruments
7.3.1 National Instruments Company Summary
7.3.2 National Instruments Business Overview
7.3.3 National Instruments DC Balanced Bridge Major Product Offerings
7.3.4 National Instruments DC Balanced Bridge Sales and Revenue in Global (2021-2026)
7.3.5 National Instruments Key News & Latest Developments
7.4 Yokogawa Electric
7.4.1 Yokogawa Electric Company Summary
7.4.2 Yokogawa Electric Business Overview
7.4.3 Yokogawa Electric DC Balanced Bridge Major Product Offerings
7.4.4 Yokogawa Electric DC Balanced Bridge Sales and Revenue in Global (2021-2026)
7.4.5 Yokogawa Electric Key News & Latest Developments
7.5 B&K Precision
7.5.1 B&K Precision Company Summary
7.5.2 B&K Precision Business Overview
7.5.3 B&K Precision DC Balanced Bridge Major Product Offerings
7.5.4 B&K Precision DC Balanced Bridge Sales and Revenue in Global (2021-2026)
7.5.5 B&K Precision Key News & Latest Developments
7.6 Megger
7.6.1 Megger Company Summary
7.6.2 Megger Business Overview
7.6.3 Megger DC Balanced Bridge Major Product Offerings
7.6.4 Megger DC Balanced Bridge Sales and Revenue in Global (2021-2026)
7.6.5 Megger Key News & Latest Developments
7.7 Tonghui
7.7.1 Tonghui Company Summary
7.7.2 Tonghui Business Overview
7.7.3 Tonghui DC Balanced Bridge Major Product Offerings
7.7.4 Tonghui DC Balanced Bridge Sales and Revenue in Global (2021-2026)
7.7.5 Tonghui Key News & Latest Developments
7.8 Agilent Technologies
7.8.1 Agilent Technologies Company Summary
7.8.2 Agilent Technologies Business Overview
7.8.3 Agilent Technologies DC Balanced Bridge Major Product Offerings
7.8.4 Agilent Technologies DC Balanced Bridge Sales and Revenue in Global (2021-2026)
7.8.5 Agilent Technologies Key News & Latest Developments
7.9 Baoding Huazheng Electric Manufacturing
7.9.1 Baoding Huazheng Electric Manufacturing Company Summary
7.9.2 Baoding Huazheng Electric Manufacturing Business Overview
7.9.3 Baoding Huazheng Electric Manufacturing DC Balanced Bridge Major Product Offerings
7.9.4 Baoding Huazheng Electric Manufacturing DC Balanced Bridge Sales and Revenue in Global (2021-2026)
7.9.5 Baoding Huazheng Electric Manufacturing Key News & Latest Developments
7.10 Shenzhen Yuance Technology
7.10.1 Shenzhen Yuance Technology Company Summary
7.10.2 Shenzhen Yuance Technology Business Overview
7.10.3 Shenzhen Yuance Technology DC Balanced Bridge Major Product Offerings
7.10.4 Shenzhen Yuance Technology DC Balanced Bridge Sales and Revenue in Global (2021-2026)
7.10.5 Shenzhen Yuance Technology Key News & Latest Developments
7.11 Shanghai Shuangxu Electronics
7.11.1 Shanghai Shuangxu Electronics Company Summary
7.11.2 Shanghai Shuangxu Electronics Business Overview
7.11.3 Shanghai Shuangxu Electronics DC Balanced Bridge Major Product Offerings
7.11.4 Shanghai Shuangxu Electronics DC Balanced Bridge Sales and Revenue in Global (2021-2026)
7.11.5 Shanghai Shuangxu Electronics Key News & Latest Developments
7.12 Shenzhen Concept Instruments
7.12.1 Shenzhen Concept Instruments Company Summary
7.12.2 Shenzhen Concept Instruments Business Overview
7.12.3 Shenzhen Concept Instruments DC Balanced Bridge Major Product Offerings
7.12.4 Shenzhen Concept Instruments DC Balanced Bridge Sales and Revenue in Global (2021-2026)
7.12.5 Shenzhen Concept Instruments Key News & Latest Developments
7.13 Shenzhen Tongce Electronic Instruments
7.13.1 Shenzhen Tongce Electronic Instruments Company Summary
7.13.2 Shenzhen Tongce Electronic Instruments Business Overview
7.13.3 Shenzhen Tongce Electronic Instruments DC Balanced Bridge Major Product Offerings
7.13.4 Shenzhen Tongce Electronic Instruments DC Balanced Bridge Sales and Revenue in Global (2021-2026)
7.13.5 Shenzhen Tongce Electronic Instruments Key News & Latest Developments
8 Global DC Balanced Bridge Production Capacity, Analysis
8.1 Global DC Balanced Bridge Production Capacity, 2021-2034
8.2 DC Balanced Bridge Production Capacity of Key Manufacturers in Global Market
8.3 Global DC Balanced Bridge Production by Region
9 Key Market Trends, Opportunity, Drivers and Restraints
9.1 Market Opportunities & Trends
9.2 Market Drivers
9.3 Market Restraints
10 DC Balanced Bridge Supply Chain Analysis
10.1 DC Balanced Bridge Industry Value Chain
10.2 DC Balanced Bridge Upstream Market
10.3 DC Balanced Bridge Downstream and Clients
10.4 Marketing Channels Analysis
10.4.1 Marketing Channels
10.4.2 DC Balanced Bridge Distributors and Sales Agents in Global
11 Conclusion
12 Appendix
12.1 Note
12.2 Examples of Clients
12.3 DisclaimerList of Tables
Table 1. Key Players of DC Balanced Bridge in Global Market
Table 2. Top DC Balanced Bridge Players in Global Market, Ranking by Revenue (2025)
Table 3. Global DC Balanced Bridge Revenue by Companies, (US$, Mn), 2021-2026
Table 4. Global DC Balanced Bridge Revenue Share by Companies, 2021-2026
Table 5. Global DC Balanced Bridge Sales by Companies, (K Units), 2021-2026
Table 6. Global DC Balanced Bridge Sales Share by Companies, 2021-2026
Table 7. Key Manufacturers DC Balanced Bridge Price (2021-2026) & (US$/Unit)
Table 8. Global Manufacturers DC Balanced Bridge Product Type
Table 9. List of Global Tier 1 DC Balanced Bridge Companies, Revenue (US$, Mn) in 2025 and Market Share
Table 10. List of Global Tier 2 and Tier 3 DC Balanced Bridge Companies, Revenue (US$, Mn) in 2025 and Market Share
Table 11. Segment by Type – Global DC Balanced Bridge Revenue, (US$, Mn), 2025 & 2034
Table 12. Segment by Type – Global DC Balanced Bridge Revenue (US$, Mn), 2021-2026
Table 13. Segment by Type – Global DC Balanced Bridge Revenue (US$, Mn), 2027-2034
Table 14. Segment by Type – Global DC Balanced Bridge Sales (K Units), 2021-2026
Table 15. Segment by Type – Global DC Balanced Bridge Sales (K Units), 2027-2034
Table 16. Segment by Application – Global DC Balanced Bridge Revenue, (US$, Mn), 2025 & 2034
Table 17. Segment by Application – Global DC Balanced Bridge Revenue, (US$, Mn), 2021-2026
Table 18. Segment by Application – Global DC Balanced Bridge Revenue, (US$, Mn), 2027-2034
Table 19. Segment by Application – Global DC Balanced Bridge Sales, (K Units), 2021-2026
Table 20. Segment by Application – Global DC Balanced Bridge Sales, (K Units), 2027-2034
Table 21. By Region – Global DC Balanced Bridge Revenue, (US$, Mn), 2025 & 2034
Table 22. By Region – Global DC Balanced Bridge Revenue, (US$, Mn), 2021-2026
Table 23. By Region – Global DC Balanced Bridge Revenue, (US$, Mn), 2027-2034
Table 24. By Region – Global DC Balanced Bridge Sales, (K Units), 2021-2026
Table 25. By Region – Global DC Balanced Bridge Sales, (K Units), 2027-2034
Table 26. By Country – North America DC Balanced Bridge Revenue, (US$, Mn), 2021-2026
Table 27. By Country – North America DC Balanced Bridge Revenue, (US$, Mn), 2027-2034
Table 28. By Country – North America DC Balanced Bridge Sales, (K Units), 2021-2026
Table 29. By Country – North America DC Balanced Bridge Sales, (K Units), 2027-2034
Table 30. By Country – Europe DC Balanced Bridge Revenue, (US$, Mn), 2021-2026
Table 31. By Country – Europe DC Balanced Bridge Revenue, (US$, Mn), 2027-2034
Table 32. By Country – Europe DC Balanced Bridge Sales, (K Units), 2021-2026
Table 33. By Country – Europe DC Balanced Bridge Sales, (K Units), 2027-2034
Table 34. By Region – Asia DC Balanced Bridge Revenue, (US$, Mn), 2021-2026
Table 35. By Region – Asia DC Balanced Bridge Revenue, (US$, Mn), 2027-2034
Table 36. By Region – Asia DC Balanced Bridge Sales, (K Units), 2021-2026
Table 37. By Region – Asia DC Balanced Bridge Sales, (K Units), 2027-2034
Table 38. By Country – South America DC Balanced Bridge Revenue, (US$, Mn), 2021-2026
Table 39. By Country – South America DC Balanced Bridge Revenue, (US$, Mn), 2027-2034
Table 40. By Country – South America DC Balanced Bridge Sales, (K Units), 2021-2026
Table 41. By Country – South America DC Balanced Bridge Sales, (K Units), 2027-2034
Table 42. By Country – Middle East & Africa DC Balanced Bridge Revenue, (US$, Mn), 2021-2026
Table 43. By Country – Middle East & Africa DC Balanced Bridge Revenue, (US$, Mn), 2027-2034
Table 44. By Country – Middle East & Africa DC Balanced Bridge Sales, (K Units), 2021-2026
Table 45. By Country – Middle East & Africa DC Balanced Bridge Sales, (K Units), 2027-2034
Table 46. Keysight Technologies Company Summary
Table 47. Keysight Technologies DC Balanced Bridge Product Offerings
Table 48. Keysight Technologies DC Balanced Bridge Sales (K Units), Revenue (US$, Mn) and Average Price (US$/Unit) & (2021-2026)
Table 49. Keysight Technologies Key News & Latest Developments
Table 50. Fluke Corporation Company Summary
Table 51. Fluke Corporation DC Balanced Bridge Product Offerings
Table 52. Fluke Corporation DC Balanced Bridge Sales (K Units), Revenue (US$, Mn) and Average Price (US$/Unit) & (2021-2026)
Table 53. Fluke Corporation Key News & Latest Developments
Table 54. National Instruments Company Summary
Table 55. National Instruments DC Balanced Bridge Product Offerings
Table 56. National Instruments DC Balanced Bridge Sales (K Units), Revenue (US$, Mn) and Average Price (US$/Unit) & (2021-2026)
Table 57. National Instruments Key News & Latest Developments
Table 58. Yokogawa Electric Company Summary
Table 59. Yokogawa Electric DC Balanced Bridge Product Offerings
Table 60. Yokogawa Electric DC Balanced Bridge Sales (K Units), Revenue (US$, Mn) and Average Price (US$/Unit) & (2021-2026)
Table 61. Yokogawa Electric Key News & Latest Developments
Table 62. B&K Precision Company Summary
Table 63. B&K Precision DC Balanced Bridge Product Offerings
Table 64. B&K Precision DC Balanced Bridge Sales (K Units), Revenue (US$, Mn) and Average Price (US$/Unit) & (2021-2026)
Table 65. B&K Precision Key News & Latest Developments
Table 66. Megger Company Summary
Table 67. Megger DC Balanced Bridge Product Offerings
Table 68. Megger DC Balanced Bridge Sales (K Units), Revenue (US$, Mn) and Average Price (US$/Unit) & (2021-2026)
Table 69. Megger Key News & Latest Developments
Table 70. Tonghui Company Summary
Table 71. Tonghui DC Balanced Bridge Product Offerings
Table 72. Tonghui DC Balanced Bridge Sales (K Units), Revenue (US$, Mn) and Average Price (US$/Unit) & (2021-2026)
Table 73. Tonghui Key News & Latest Developments
Table 74. Agilent Technologies Company Summary
Table 75. Agilent Technologies DC Balanced Bridge Product Offerings
Table 76. Agilent Technologies DC Balanced Bridge Sales (K Units), Revenue (US$, Mn) and Average Price (US$/Unit) & (2021-2026)
Table 77. Agilent Technologies Key News & Latest Developments
Table 78. Baoding Huazheng Electric Manufacturing Company Summary
Table 79. Baoding Huazheng Electric Manufacturing DC Balanced Bridge Product Offerings
Table 80. Baoding Huazheng Electric Manufacturing DC Balanced Bridge Sales (K Units), Revenue (US$, Mn) and Average Price (US$/Unit) & (2021-2026)
Table 81. Baoding Huazheng Electric Manufacturing Key News & Latest Developments
Table 82. Shenzhen Yuance Technology Company Summary
Table 83. Shenzhen Yuance Technology DC Balanced Bridge Product Offerings
Table 84. Shenzhen Yuance Technology DC Balanced Bridge Sales (K Units), Revenue (US$, Mn) and Average Price (US$/Unit) & (2021-2026)
Table 85. Shenzhen Yuance Technology Key News & Latest Developments
Table 86. Shanghai Shuangxu Electronics Company Summary
Table 87. Shanghai Shuangxu Electronics DC Balanced Bridge Product Offerings
Table 88. Shanghai Shuangxu Electronics DC Balanced Bridge Sales (K Units), Revenue (US$, Mn) and Average Price (US$/Unit) & (2021-2026)
Table 89. Shanghai Shuangxu Electronics Key News & Latest Developments
Table 90. Shenzhen Concept Instruments Company Summary
Table 91. Shenzhen Concept Instruments DC Balanced Bridge Product Offerings
Table 92. Shenzhen Concept Instruments DC Balanced Bridge Sales (K Units), Revenue (US$, Mn) and Average Price (US$/Unit) & (2021-2026)
Table 93. Shenzhen Concept Instruments Key News & Latest Developments
Table 94. Shenzhen Tongce Electronic Instruments Company Summary
Table 95. Shenzhen Tongce Electronic Instruments DC Balanced Bridge Product Offerings
Table 96. Shenzhen Tongce Electronic Instruments DC Balanced Bridge Sales (K Units), Revenue (US$, Mn) and Average Price (US$/Unit) & (2021-2026)
Table 97. Shenzhen Tongce Electronic Instruments Key News & Latest Developments
Table 98. DC Balanced Bridge Capacity of Key Manufacturers in Global Market, 2024-2026 (K Units)
Table 99. Global DC Balanced Bridge Capacity Market Share of Key Manufacturers, 2024-2026
Table 100. Global DC Balanced Bridge Production by Region, 2021-2026 (K Units)
Table 101. Global DC Balanced Bridge Production by Region, 2027-2034 (K Units)
Table 102. DC Balanced Bridge Market Opportunities & Trends in Global Market
Table 103. DC Balanced Bridge Market Drivers in Global Market
Table 104. DC Balanced Bridge Market Restraints in Global Market
Table 105. DC Balanced Bridge Raw Materials
Table 106. DC Balanced Bridge Raw Materials Suppliers in Global Market
Table 107. Typical DC Balanced Bridge Downstream
Table 108. DC Balanced Bridge Downstream Clients in Global Market
Table 109. DC Balanced Bridge Distributors and Sales Agents in Global Market

List of Figures
Figure 1. DC Balanced Bridge Product Picture
Figure 2. DC Balanced Bridge Segment by Type in 2025
Figure 3. DC Balanced Bridge Segment by Application in 2025
Figure 4. Global DC Balanced Bridge Market Overview: 2025
Figure 5. Key Caveats
Figure 6. Global DC Balanced Bridge Market Size: 2025 VS 2034 (US$, Mn)
Figure 7. Global DC Balanced Bridge Revenue: 2021-2034 (US$, Mn)
Figure 8. DC Balanced Bridge Sales in Global Market: 2021-2034 (K Units)
Figure 9. The Top 3 and 5 Players Market Share by DC Balanced Bridge Revenue in 2025
Figure 10. Segment by Type – Global DC Balanced Bridge Revenue, (US$, Mn), 2025 & 2034
Figure 11. Segment by Type – Global DC Balanced Bridge Revenue Market Share, 2021-2034
Figure 12. Segment by Type – Global DC Balanced Bridge Sales Market Share, 2021-2034
Figure 13. Segment by Type – Global DC Balanced Bridge Price (US$/Unit), 2021-2034
Figure 14. Segment by Application – Global DC Balanced Bridge Revenue, (US$, Mn), 2025 & 2034
Figure 15. Segment by Application – Global DC Balanced Bridge Revenue Market Share, 2021-2034
Figure 16. Segment by Application – Global DC Balanced Bridge Sales Market Share, 2021-2034
Figure 17. Segment by Application -Global DC Balanced Bridge Price (US$/Unit), 2021-2034
Figure 18. By Region – Global DC Balanced Bridge Revenue, (US$, Mn), 2025 & 2034
Figure 19. By Region – Global DC Balanced Bridge Revenue Market Share, 2021 VS 2025 VS 2034
Figure 20. By Region – Global DC Balanced Bridge Revenue Market Share, 2021-2034
Figure 21. By Region – Global DC Balanced Bridge Sales Market Share, 2021-2034
Figure 22. By Country – North America DC Balanced Bridge Revenue Market Share, 2021-2034
Figure 23. By Country – North America DC Balanced Bridge Sales Market Share, 2021-2034
Figure 24. United States DC Balanced Bridge Revenue, (US$, Mn), 2021-2034
Figure 25. Canada DC Balanced Bridge Revenue, (US$, Mn), 2021-2034
Figure 26. Mexico DC Balanced Bridge Revenue, (US$, Mn), 2021-2034
Figure 27. By Country – Europe DC Balanced Bridge Revenue Market Share, 2021-2034
Figure 28. By Country – Europe DC Balanced Bridge Sales Market Share, 2021-2034
Figure 29. Germany DC Balanced Bridge Revenue, (US$, Mn), 2021-2034
Figure 30. France DC Balanced Bridge Revenue, (US$, Mn), 2021-2034
Figure 31. U.K. DC Balanced Bridge Revenue, (US$, Mn), 2021-2034
Figure 32. Italy DC Balanced Bridge Revenue, (US$, Mn), 2021-2034
Figure 33. Russia DC Balanced Bridge Revenue, (US$, Mn), 2021-2034
Figure 34. Nordic Countries DC Balanced Bridge Revenue, (US$, Mn), 2021-2034
Figure 35. Benelux DC Balanced Bridge Revenue, (US$, Mn), 2021-2034
Figure 36. By Region – Asia DC Balanced Bridge Revenue Market Share, 2021-2034
Figure 37. By Region – Asia DC Balanced Bridge Sales Market Share, 2021-2034
Figure 38. China DC Balanced Bridge Revenue, (US$, Mn), 2021-2034
Figure 39. Japan DC Balanced Bridge Revenue, (US$, Mn), 2021-2034
Figure 40. South Korea DC Balanced Bridge Revenue, (US$, Mn), 2021-2034
Figure 41. Southeast Asia DC Balanced Bridge Revenue, (US$, Mn), 2021-2034
Figure 42. India DC Balanced Bridge Revenue, (US$, Mn), 2021-2034
Figure 43. By Country – South America DC Balanced Bridge Revenue Market Share, 2021-2034
Figure 44. By Country – South America DC Balanced Bridge Sales, Market Share, 2021-2034
Figure 45. Brazil DC Balanced Bridge Revenue, (US$, Mn), 2021-2034
Figure 46. Argentina DC Balanced Bridge Revenue, (US$, Mn), 2021-2034
Figure 47. By Country – Middle East & Africa DC Balanced Bridge Revenue, Market Share, 2021-2034
Figure 48. By Country – Middle East & Africa DC Balanced Bridge Sales, Market Share, 2021-2034
Figure 49. Turkey DC Balanced Bridge Revenue, (US$, Mn), 2021-2034
Figure 50. Israel DC Balanced Bridge Revenue, (US$, Mn), 2021-2034
Figure 51. Saudi Arabia DC Balanced Bridge Revenue, (US$, Mn), 2021-2034
Figure 52. UAE DC Balanced Bridge Revenue, (US$, Mn), 2021-2034
Figure 53. Global DC Balanced Bridge Production Capacity (K Units), 2021-2034
Figure 54. The Percentage of Production DC Balanced Bridge by Region, 2025 VS 2034
Figure 55. DC Balanced Bridge Industry Value Chain
Figure 56. Marketing Channels