Computer On Module (COM) Market, Global Business Strategies 2025-2032

Computer On Module (COM) Market size was valued at USD 2363 million in 2024 to USD 6088 million by 2032, exhibiting a CAGR of 14.8% during the forecast period

PDF Icon Download Sample Report PDF
  • Quick Dispatch

    All Orders

  • Secure Payment

    100% Secure Payment

Price range: $1,500.00 through $4,250.00

Clear

MARKET INSIGHTS

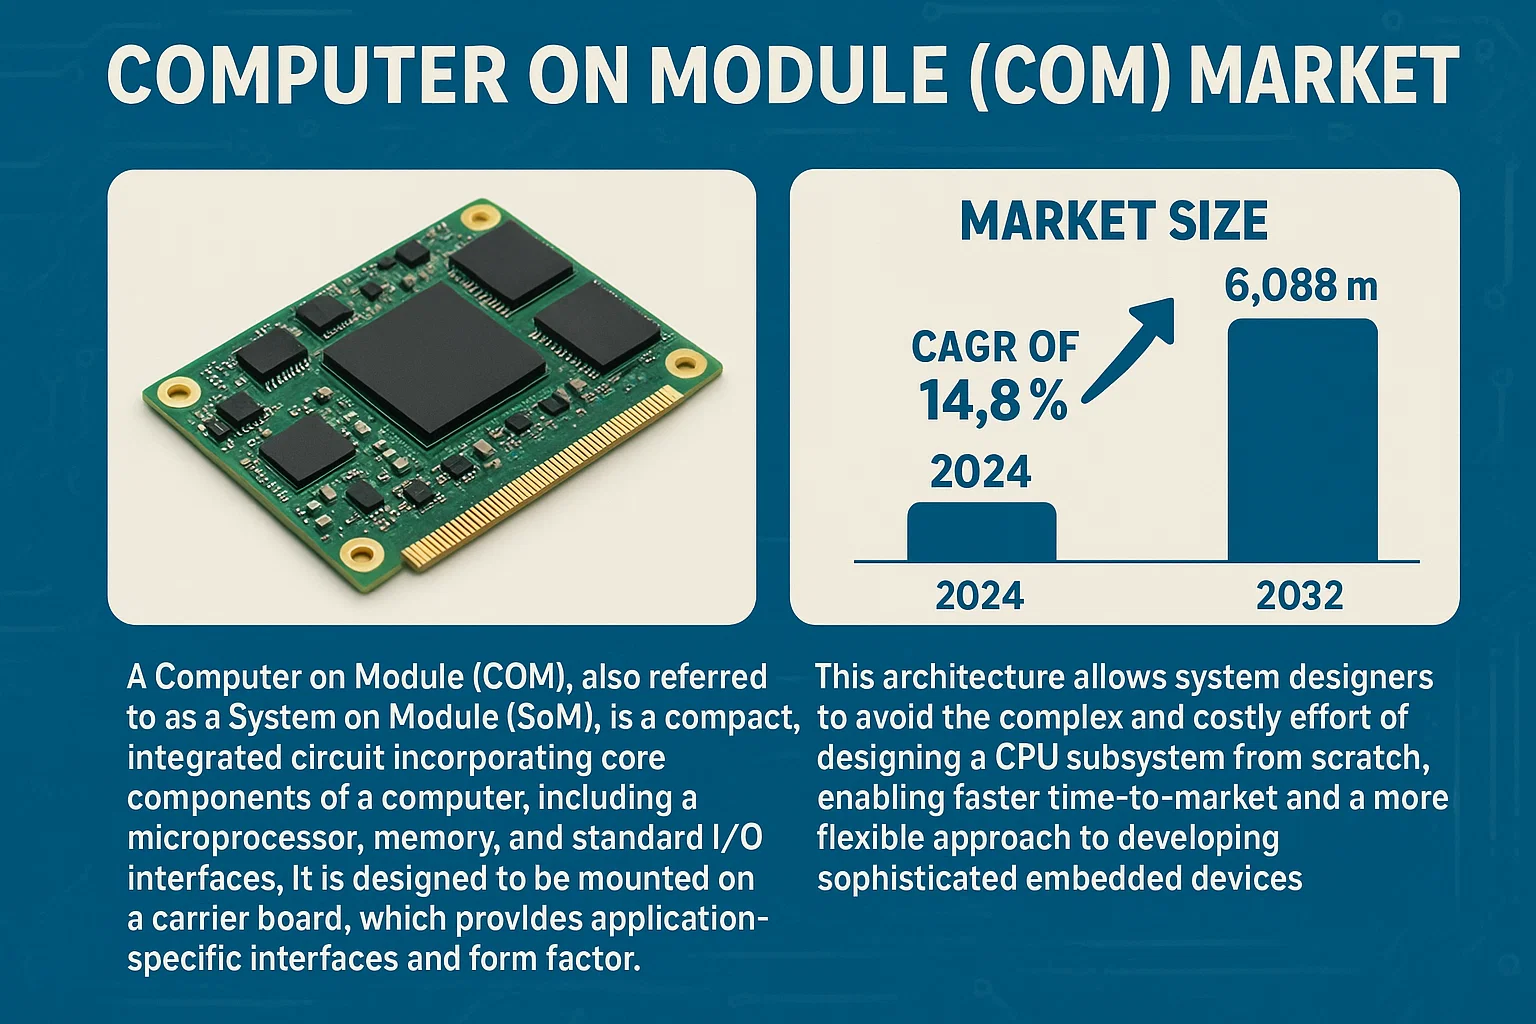
Global Computer On Module (COM) Market size was valued at USD 2363 million in 2024 to USD 6088 million by 2032, exhibiting a CAGR of 14.8% during the forecast period.

A Computer on Module (COM), also referred to as a System on Module (SoM), is a compact, integrated circuit that incorporates the core components of a computer, including a microprocessor, memory, and standard I/O interfaces. It is designed to be mounted on a carrier board, which provides the application-specific interfaces and form factor. This architecture allows system designers to avoid the complex and costly effort of designing a CPU subsystem from scratch, enabling faster time-to-market and a more flexible approach to developing sophisticated embedded devices.

The market is experiencing robust growth driven by the accelerating demand for embedded computing solutions across various industries. Key growth factors include the proliferation of Industrial Automation and the Internet of Things (IoT), which require compact, powerful, and reliable computing platforms. Furthermore, the adoption of COMs in medical equipment, transportation systems, and test & measurement devices is contributing significantly to market expansion. The top five players, including Kontron, Congatec, and Advantech, collectively hold approximately 32% of the global market share, with Europe and North America being the dominant regions, accounting for about 75% of the total market.

Computer On Module (COM) Market

MARKET DRIVERS

Expansion of IoT and Edge Computing

The proliferation of Internet of Things (IoT) devices and the need for edge computing solutions have significantly increased the demand for Computer On Modules. These compact, integrated solutions enable manufacturers to develop smarter edge devices with reduced time-to-market, leveraging the standardized architecture of COMs across various industries.

Rising Demand for Customization and Scalability

Industries are increasingly adopting COM solutions due to their modular nature, allowing for easy customization and scalability without complete system redesign. This flexibility enables manufacturers to update specific components while maintaining the core architecture, reducing both development time and overall costs for next-generation devices.

Market analysts indicate a 34% faster development cycle for companies adopting COM-based solutions compared to traditional custom board development approaches.

The shift toward modular architectures also supports sustainability efforts, as components can be upgraded or replaced individually rather than replacing entire systems, extending product lifecycles in industrial and medical applications.

MARKET CHALLENGES

High Initial Development Costs

Despite long-term savings, the initial investment required for COM-based solutions presents a significant barrier, particularly for small to medium-sized enterprises. The need for specialized design expertise and validation processes adds substantial upfront costs that can deter adoption among cost-sensitive developers and manufacturers.

Other Challenges

Integration Complexity with Legacy Systems
Many existing industrial systems rely on legacy infrastructure that isn’t immediately compatible with newer COM architectures. The integration process often requires additional middleware, custom drivers, or even partial system redesign, creating implementation challenges that can delay adoption across established manufacturing sectors.

MARKET RESTRAINTS

Supply Chain Constraints and Component Shortages

The global semiconductor shortage has particularly affected the COM market, where specific processors and components face extended lead times. This has created production bottlenecks that delay product launches and increase costs, especially for just-in-time manufacturing environments where production lines depend on timely component delivery.

MARKET OPPORTUNITIES

Emergence of Industry 4.0 and Smart Manufacturing

The fourth industrial revolution continues to drive digital transformation across manufacturing sectors, with COM solutions at the core of this transformation. Their modular nature enables manufacturers to implement smart factory solutions with real-time data processing, predictive maintenance, and AI-driven optimization at the edge, creating opportunities across automotive, aerospace, and electronics manufacturing sectors.

Healthcare digitalization represents another major growth area, with medical device manufacturers increasingly adopting COM solutions for portable diagnostic equipment, patient monitoring systems, and robotic surgery systems. The market is projected to grow at 22.3% CAGR in medical applications as regulatory pathways for modular medical devices become more established.

Computer On Module (COM) Market Trends Rising Demand for Compact and Efficient Computing Solutions Drives Market Growth

The global Computer On Module (COM) market is experiencing significant growth, driven by the increasing adoption of embedded systems across industrial, medical, and automotive sectors. With a market size valued at $2.36 billion in 2024, the sector is projected to reach $6.08 billion by 2032, representing a compound annual growth rate (CAGR) of 14.8%. This growth is primarily attributed to the need for reduced system design complexity, faster time-to-market, and cost-effective solutions for embedded computing applications.

Other Trends

Architecture Diversification and Performance Optimization

Market analysis indicates a shift towards heterogeneous computing architectures, with ARM architecture gaining significant traction due to its power efficiency in mobile and IoT applications. However, x86 architecture maintains strong presence in industrial applications requiring higher computing power. The market is also witnessing increased adoption of RISC-V and other open-source architectures, particularly in cost-sensitive applications. Manufacturers are focusing on optimizing performance per watt metrics, with recent releases achieving up to 45% improvement in performance per watt compared to previous generations.

Regional Market Dynamics and Supply Chain Evolution

The Asia-Pacific region continues to lead in both production and consumption of COM modules, accounting for approximately 58% of global production capacity. Europe and North America remain key markets for high-performance modules, with Germany and the U.S. leading in industrial automation adoption. Recent supply chain disruptions have accelerated the shift towards regional manufacturing, with 68% of manufacturers reporting increased investment in local supply chain resilience. The average lead time for standard COM modules has improved from 12 weeks to 8 weeks in the past year, though specialty configurations still face constraints.

Market intelligence indicates that pricing remains competitive, with average selling prices declining by approximately 12% annually while performance continues to improve. The industry is witnessing increased collaboration between chipset manufacturers and module developers, resulting in better optimized solutions. The adoption of PCIe 5.0 and DDR5 memory in high-end modules is becoming more prevalent, though these features are currently concentrated in the premium segment representing approximately 15% of the market.

COMPETITIVE LANDSCAPE

Key Industry Players

Computer On Module (COM) Market Competitive Landscape

The Computer On Module (COM) market is characterized by intense competition among established embedded systems manufacturers, with Advantech leading the market through its diverse portfolio of COM Express modules and strong global distribution network. Kontron follows closely with its focus on high-performance COM Express and SMARC modules for industrial applications, while ADLINK offers comprehensive COM Express and Q7 modules with strong customization capabilities. Congatec and ADLINK have particularly strengthened their positions through strategic partnerships with Intel and AMD for next-generation processors.

Beyond the top players, several specialized manufacturers have carved out significant market shares through technological specialization. Adlink, Avalue, and AAEON leverage their vertical integration capabilities to offer competitive pricing, especially in the industrial automation and IoT sectors. Artesyn and Portwell focus on ruggedized COM solutions for military and aerospace applications, while IEI and Axiomtec target the growing edge computing market with their compact COM Express modules. MEN Micro and Adlink have been particularly successful in penetrating the European market with their COM Express and SMARC modules.

List of Key Computer On Module (COM) Companies Profiled

  • Advantech Co., Ltd.
  • Kontron AG
  • ADLINK Technology Inc.
  • Congatec GmbH
  • ADLINK Technology Inc. (additional presence)
  • Adlink Technology Inc.
  • AAEON Technology Inc.
  • Artila Industries Co., Ltd.
  • Adlink Technology Inc. (Asia-Pacific)
  • IEI Integration Corp.
  • MEN Micro, Inc.
  • Axiomtek Co., Ltd.
  • Portwell Inc.
  • Avalue Technology Inc.

Segment Analysis:

Segment Category Sub-Segments Key Insights
By Type
  • ARM-based COM
  • x86-based COM
  • RISC-V based COM
ARM-based COM modules lead the market due to their energy efficiency and widespread use in mobile and embedded applications, while x86-based modules maintain strong presence in industrial computing sectors requiring higher processing power.
By Application
  • Industrial Automation
  • Medical Equipment
  • Automotive Infotainment
  • Gaming and Entertainment
Industrial automation applications drive significant demand for COM modules due to the need for reliable, compact computing in manufacturing environments, while medical equipment manufacturers increasingly adopt COM solutions for their diagnostic and monitoring equipment.
By End User
  • OEMs and System Integrators
  • Industrial Equipment Manufacturers
  • Research and Development Teams
OEMs and system integrators constitute the largest end-user segment, as they incorporate COM modules into complete systems and solutions, while research teams utilize COM platforms for prototyping and developing next-generation embedded systems.
By Connectivity
  • Wired Interfaces (Ethernet, USB)
  • Wireless (Wi-Fi, Bluetooth)
  • Industrial Fieldbus Interfaces
Wired interfaces like Ethernet remain crucial for industrial applications where reliability is paramount, while wireless connectivity gains traction in consumer-facing and mobile applications, with industrial-grade implementations emerging for specialized applications.
By Form Factor
  • COM Express
  • SMARC (Smart Mobility ARChitecture)
  • Qseven
  • Others (Custom and Emerging)
COM Express modules continue to dominate in industrial applications where ruggedness and standardization are valued, while SMARC gains traction in space-constrained and mobile applications, with both form factors evolving to support emerging connectivity standards and processing capabilities.

Regional Analysis: Computer On Module (COM) Market

North America

North America leads the global COM market due to its advanced technology infrastructure and high adoption of modular computing solutions across industries. The region benefits from strong R&D investments from major tech companies and startups focusing on industrial automation, IoT, and edge computing applications. Silicon Valley and other tech hubs drive innovation in compact and powerful COM solutions. The region’s robust semiconductor industry and strong venture capital funding enable rapid prototyping and commercialization of new COM designs. North American companies lead in developing COM solutions for aerospace, defense, and autonomous vehicle applications, with stringent quality and reliability requirements driving premium pricing and high-performance standards.

Industrial Automation Leadership
North American industries lead in adopting COM solutions for factory automation and process control systems, with manufacturers implementing modular computing to reduce downtime and enable predictive maintenance. The region’s advanced manufacturing sector drives demand for ruggedized COM solutions that operate reliably in harsh industrial environments while supporting real-time data analytics and machine learning applications.
Healthcare & Medical Technology
North America dominates in medical device innovation where COM solutions enable miniaturization of diagnostic equipment and portable medical devices. The region’s stringent FDA regulations drive development of reliable and safety-certified COM solutions for medical imaging, patient monitoring, and laboratory equipment. Medical technology companies leverage COM architecture to accelerate development while ensuring compliance with strict regulatory standards for medical-grade computing systems.
Aerospace & Defense Applications
North American aerospace and defense sectors demand the highest reliability COM solutions with extended temperature ranges and radiation hardening. The region leads in developing COM solutions for unmanned systems, avionics, and space applications where size, weight, and power constraints drive innovation. Defense contractors utilize COM architecture to future-proof systems while maintaining long product lifecycles and reducing time-to-market for new capabilities through modular upgrades.
Autonomous Systems & Robotics
North American companies lead in developing COM solutions for autonomous vehicles, drones, and industrial robotics where processing power must be compact and energy-efficient. The region’s expertise in artificial intelligence and machine learning integration with hardware drives innovation in perception systems and real-time decision making. Robotics companies leverage COM architecture to standardize core computing while customizing peripheral systems for specific applications across material handling, inspection, and delivery services.

Europe
Europe represents the second largest COM market with strength in industrial automation, automotive, and aerospace applications. European companies prioritize reliability and longevity in their COM solutions, with manufacturers offering 10-15 year availability guarantees for industrial and medical applications. The region’s strong regulatory environment for electronics recycling and energy efficiency drives development of low-power COM solutions. European aerospace and automotive companies leverage COM technology to modernize legacy systems while maintaining backward compatibility. The region shows particular strength in customized COM solutions for specialized industrial equipment and high-value applications where performance outweighs cost considerations.

Asia-Pacific
Asia-Pacific demonstrates the fastest growth in COM adoption, led by Japan and South Korea’s expertise in miniaturization and Singapore’s emergence as a technology hub. While China dominates manufacturing, Japanese and Korean companies lead in high-density COM design and manufacturing for consumer electronics, industrial, and automotive applications. The region benefits from lower production costs and extensive electronics supply chains enabling competitive pricing. Asian manufacturers increasingly adopt COM architecture to speed time-to-market for IoT devices, industrial controllers, and consumer electronics while meeting diverse market requirements across developing economies.

South America
South America shows emerging but steady growth in COM adoption, primarily in Brazil, Argentina, and Chile where industrial automation investments drive demand. The region’s mining, agriculture, and energy sectors utilize COM solutions for equipment monitoring and automation. South American manufacturers focus on value-oriented COM solutions that balance performance and cost, with increasing adoption in medical equipment manufacturing and agricultural technology. Infrastructure development projects create opportunities for ruggedized COM solutions in construction and transportation equipment.

Middle East & Africa
The Middle East demonstrates growing COM adoption in oil, gas, and smart city projects where reliability in extreme environments is critical. Dubai and Abu Dhabi lead in smart city initiatives using COM technology for infrastructure monitoring. African adoption remains limited but growing in South Africa and Nigeria where mobile technology adoption drives interest in compact computing. The region shows potential for COM applications in mobile health clinics, remote monitoring, and renewable energy systems where reliability must be maintained in challenging environmental conditions with limited technical support infrastructure.

Report Scope

This market research report provides a comprehensive analysis of the Computer On Module (COM) Market, covering the forecast period 2024–2032. It offers detailed insights into market dynamics, technological advancements, competitive landscape, and key trends shaping the industry.

Key focus areas of the report include:

  • Market Overview: The report begins with an overview outlining its current market scenario, key growth indicators, and industry transformation drivers. It discusses macroeconomic factors, demand–supply balance, regulatory landscape, and the strategic role of semiconductors in powering advancements across industries such as automotive, telecommunications, consumer electronics, and industrial automation.
  • Market Size & Forecast: Historical data and future projections for revenue, unit shipments, and market value across major regions and segments.
  • Segmentation Analysis: Detailed breakdown by product type, technology, application, and end-user industry to identify high-growth segments and investment opportunities.
  • Regional Insights: Insights into market performance across North America, Europe, Asia-Pacific, Latin America, and the Middle East & Africa, including country-level analysis where relevant.
  • Competitive Landscape: Profiles of leading market participants, including their product offerings, R&D focus, manufacturing capacity, pricing strategies, and recent developments such as mergers, acquisitions, and partnerships.
  • Technology Trends & Innovation: Assessment of emerging technologies, integration of AI/IoT, semiconductor design trends, fabrication techniques, and evolving industry standards.
  • Market Drivers & Restraints: Evaluation of factors driving market growth along with challenges, supply chain constraints, regulatory issues, and market-entry barriers.
  • Stakeholder Insights: Insights for component suppliers, OEMs, system integrators, investors, and policymakers regarding the evolving ecosystem and strategic opportunities.

Primary and secondary research methods are employed, including interviews with industry experts, data from verified sources, and real-time market intelligence to ensure the accuracy and reliability of the insights presented.

FREQUENTLY ASKED QUESTIONS:

What is the current market size of Computer On Module (COM) Market?

-> Global Computer On Module (COM) market was valued at USD 2363 million in 2024 and is projected to reach USD 6088 million by 2032.

What is the growth rate of Computer On Module (COM) Market?

-> The market is expected to grow at a CAGR of 14.8% during the forecast period 2024-2032.

Which key companies operate in Computer On Module (COM) Market?

-> Key players include Kontron, Congatec, Advantech, ADLink, Portwell, Eurotech, SECO srl, Technexion, Phytec, Axiomtek, Aaeon, Toradex, EMAC, Avalue Technology, CompuLab, Variscite, Digi International, Olimex Ltd, Shiratech(Aviv Technologies), Critical Link, LLC, IWave Systems Technologies, Calixto Systems, among others.

What are the key growth drivers?

-> Key growth drivers include increasing adoption in industrial automation, medical devices, entertainment systems, transportation, and test & measurement equipment. The demand for compact, power-efficient computing solutions across diverse industries is a major factor.

Which region dominates the market?

-> Europe and North America are the dominant markets, accounting for about 75% of the global market. However, Asia-Pacific is expected to show the highest growth rate during the forecast period.

Computer On Module (COM) Market, Global Business Strategies 2025-2032

Get Sample Report PDF for Exclusive Insights

Report Sample Includes

  • Table of Contents
  • List of Tables & Figures
  • Charts, Research Methodology, and more...
PDF Icon Download Sample Report PDF

Download Sample Report

Table of Content

1 Introduction to Research & Analysis Reports
1.1 Computer On Module (COM) Market Definition
1.2 Market Segments
1.2.1 Segment by Type
1.2.2 Segment by Application
1.3 Global Computer On Module (COM) Market Overview
1.4 Features & Benefits of This Report
1.5 Methodology & Sources of Information
1.5.1 Research Methodology
1.5.2 Research Process
1.5.3 Base Year
1.5.4 Report Assumptions & Caveats
2 Global Computer On Module (COM) Overall Market Size
2.1 Global Computer On Module (COM) Market Size: 2024 VS 2032
2.2 Global Computer On Module (COM) Market Size, Prospects & Forecasts: 2020-2032
2.3 Global Computer On Module (COM) Sales: 2020-2032
3 Company Landscape
3.1 Top Computer On Module (COM) Players in Global Market
3.2 Top Global Computer On Module (COM) Companies Ranked by Revenue
3.3 Global Computer On Module (COM) Revenue by Companies
3.4 Global Computer On Module (COM) Sales by Companies
3.5 Global Computer On Module (COM) Price by Manufacturer (2020-2025)
3.6 Top 3 and Top 5 Computer On Module (COM) Companies in Global Market, by Revenue in 2024
3.7 Global Manufacturers Computer On Module (COM) Product Type
3.8 Tier 1, Tier 2, and Tier 3 Computer On Module (COM) Players in Global Market
3.8.1 List of Global Tier 1 Computer On Module (COM) Companies
3.8.2 List of Global Tier 2 and Tier 3 Computer On Module (COM) Companies
4 Sights by Product
4.1 Overview
4.1.1 Segment by Type – Global Computer On Module (COM) Market Size Markets, 2024 & 2032
4.1.2 ARM Architecture
4.1.3 X86 Architecture
4.1.4 Power Architecture
4.1.5 Others
4.2 Segment by Type – Global Computer On Module (COM) Revenue & Forecasts
4.2.1 Segment by Type – Global Computer On Module (COM) Revenue, 2020-2025
4.2.2 Segment by Type – Global Computer On Module (COM) Revenue, 2026-2032
4.2.3 Segment by Type – Global Computer On Module (COM) Revenue Market Share, 2020-2032
4.3 Segment by Type – Global Computer On Module (COM) Sales & Forecasts
4.3.1 Segment by Type – Global Computer On Module (COM) Sales, 2020-2025
4.3.2 Segment by Type – Global Computer On Module (COM) Sales, 2026-2032
4.3.3 Segment by Type – Global Computer On Module (COM) Sales Market Share, 2020-2032
4.4 Segment by Type – Global Computer On Module (COM) Price (Manufacturers Selling Prices), 2020-2032
5 Sights by Application
5.1 Overview
5.1.1 Segment by Application – Global Computer On Module (COM) Market Size, 2024 & 2032
5.1.2 Industrial Automation
5.1.3 Medical
5.1.4 Entertainment
5.1.5 Transportation
5.1.6 Test & Measurement
5.1.7 Others
5.2 Segment by Application – Global Computer On Module (COM) Revenue & Forecasts
5.2.1 Segment by Application – Global Computer On Module (COM) Revenue, 2020-2025
5.2.2 Segment by Application – Global Computer On Module (COM) Revenue, 2026-2032
5.2.3 Segment by Application – Global Computer On Module (COM) Revenue Market Share, 2020-2032
5.3 Segment by Application – Global Computer On Module (COM) Sales & Forecasts
5.3.1 Segment by Application – Global Computer On Module (COM) Sales, 2020-2025
5.3.2 Segment by Application – Global Computer On Module (COM) Sales, 2026-2032
5.3.3 Segment by Application – Global Computer On Module (COM) Sales Market Share, 2020-2032
5.4 Segment by Application – Global Computer On Module (COM) Price (Manufacturers Selling Prices), 2020-2032
6 Sights by Region
6.1 By Region – Global Computer On Module (COM) Market Size, 2024 & 2032
6.2 By Region – Global Computer On Module (COM) Revenue & Forecasts
6.2.1 By Region – Global Computer On Module (COM) Revenue, 2020-2025
6.2.2 By Region – Global Computer On Module (COM) Revenue, 2026-2032
6.2.3 By Region – Global Computer On Module (COM) Revenue Market Share, 2020-2032
6.3 By Region – Global Computer On Module (COM) Sales & Forecasts
6.3.1 By Region – Global Computer On Module (COM) Sales, 2020-2025
6.3.2 By Region – Global Computer On Module (COM) Sales, 2026-2032
6.3.3 By Region – Global Computer On Module (COM) Sales Market Share, 2020-2032
6.4 North America
6.4.1 By Country – North America Computer On Module (COM) Revenue, 2020-2032
6.4.2 By Country – North America Computer On Module (COM) Sales, 2020-2032
6.4.3 United States Computer On Module (COM) Market Size, 2020-2032
6.4.4 Canada Computer On Module (COM) Market Size, 2020-2032
6.4.5 Mexico Computer On Module (COM) Market Size, 2020-2032
6.5 Europe
6.5.1 By Country – Europe Computer On Module (COM) Revenue, 2020-2032
6.5.2 By Country – Europe Computer On Module (COM) Sales, 2020-2032
6.5.3 Germany Computer On Module (COM) Market Size, 2020-2032
6.5.4 France Computer On Module (COM) Market Size, 2020-2032
6.5.5 U.K. Computer On Module (COM) Market Size, 2020-2032
6.5.6 Italy Computer On Module (COM) Market Size, 2020-2032
6.5.7 Russia Computer On Module (COM) Market Size, 2020-2032
6.5.8 Nordic Countries Computer On Module (COM) Market Size, 2020-2032
6.5.9 Benelux Computer On Module (COM) Market Size, 2020-2032
6.6 Asia
6.6.1 By Region – Asia Computer On Module (COM) Revenue, 2020-2032
6.6.2 By Region – Asia Computer On Module (COM) Sales, 2020-2032
6.6.3 China Computer On Module (COM) Market Size, 2020-2032
6.6.4 Japan Computer On Module (COM) Market Size, 2020-2032
6.6.5 South Korea Computer On Module (COM) Market Size, 2020-2032
6.6.6 Southeast Asia Computer On Module (COM) Market Size, 2020-2032
6.6.7 India Computer On Module (COM) Market Size, 2020-2032
6.7 South America
6.7.1 By Country – South America Computer On Module (COM) Revenue, 2020-2032
6.7.2 By Country – South America Computer On Module (COM) Sales, 2020-2032
6.7.3 Brazil Computer On Module (COM) Market Size, 2020-2032
6.7.4 Argentina Computer On Module (COM) Market Size, 2020-2032
6.8 Middle East & Africa
6.8.1 By Country – Middle East & Africa Computer On Module (COM) Revenue, 2020-2032
6.8.2 By Country – Middle East & Africa Computer On Module (COM) Sales, 2020-2032
6.8.3 Turkey Computer On Module (COM) Market Size, 2020-2032
6.8.4 Israel Computer On Module (COM) Market Size, 2020-2032
6.8.5 Saudi Arabia Computer On Module (COM) Market Size, 2020-2032
6.8.6 UAE Computer On Module (COM) Market Size, 2020-2032
7 Manufacturers & Brands Profiles
7.1 Kontron
7.1.1 Kontron Company Summary
7.1.2 Kontron Business Overview
7.1.3 Kontron Computer On Module (COM) Major Product Offerings
7.1.4 Kontron Computer On Module (COM) Sales and Revenue in Global (2020-2025)
7.1.5 Kontron Key News & Latest Developments
7.2 Congatec
7.2.1 Congatec Company Summary
7.2.2 Congatec Business Overview
7.2.3 Congatec Computer On Module (COM) Major Product Offerings
7.2.4 Congatec Computer On Module (COM) Sales and Revenue in Global (2020-2025)
7.2.5 Congatec Key News & Latest Developments
7.3 MSC Technologies(Avnet)
7.3.1 MSC Technologies(Avnet) Company Summary
7.3.2 MSC Technologies(Avnet) Business Overview
7.3.3 MSC Technologies(Avnet) Computer On Module (COM) Major Product Offerings
7.3.4 MSC Technologies(Avnet) Computer On Module (COM) Sales and Revenue in Global (2020-2025)
7.3.5 MSC Technologies(Avnet) Key News & Latest Developments
7.4 Advantech
7.4.1 Advantech Company Summary
7.4.2 Advantech Business Overview
7.4.3 Advantech Computer On Module (COM) Major Product Offerings
7.4.4 Advantech Computer On Module (COM) Sales and Revenue in Global (2020-2025)
7.4.5 Advantech Key News & Latest Developments
7.5 ADLink
7.5.1 ADLink Company Summary
7.5.2 ADLink Business Overview
7.5.3 ADLink Computer On Module (COM) Major Product Offerings
7.5.4 ADLink Computer On Module (COM) Sales and Revenue in Global (2020-2025)
7.5.5 ADLink Key News & Latest Developments
7.6 Portwell
7.6.1 Portwell Company Summary
7.6.2 Portwell Business Overview
7.6.3 Portwell Computer On Module (COM) Major Product Offerings
7.6.4 Portwell Computer On Module (COM) Sales and Revenue in Global (2020-2025)
7.6.5 Portwell Key News & Latest Developments
7.7 Eurotech
7.7.1 Eurotech Company Summary
7.7.2 Eurotech Business Overview
7.7.3 Eurotech Computer On Module (COM) Major Product Offerings
7.7.4 Eurotech Computer On Module (COM) Sales and Revenue in Global (2020-2025)
7.7.5 Eurotech Key News & Latest Developments
7.8 SECO srl
7.8.1 SECO srl Company Summary
7.8.2 SECO srl Business Overview
7.8.3 SECO srl Computer On Module (COM) Major Product Offerings
7.8.4 SECO srl Computer On Module (COM) Sales and Revenue in Global (2020-2025)
7.8.5 SECO srl Key News & Latest Developments
7.9 Technexion
7.9.1 Technexion Company Summary
7.9.2 Technexion Business Overview
7.9.3 Technexion Computer On Module (COM) Major Product Offerings
7.9.4 Technexion Computer On Module (COM) Sales and Revenue in Global (2020-2025)
7.9.5 Technexion Key News & Latest Developments
7.10 Phytec
7.10.1 Phytec Company Summary
7.10.2 Phytec Business Overview
7.10.3 Phytec Computer On Module (COM) Major Product Offerings
7.10.4 Phytec Computer On Module (COM) Sales and Revenue in Global (2020-2025)
7.10.5 Phytec Key News & Latest Developments
7.11 Axiomtek
7.11.1 Axiomtek Company Summary
7.11.2 Axiomtek Business Overview
7.11.3 Axiomtek Computer On Module (COM) Major Product Offerings
7.11.4 Axiomtek Computer On Module (COM) Sales and Revenue in Global (2020-2025)
7.11.5 Axiomtek Key News & Latest Developments
7.12 Aaeon
7.12.1 Aaeon Company Summary
7.12.2 Aaeon Business Overview
7.12.3 Aaeon Computer On Module (COM) Major Product Offerings
7.12.4 Aaeon Computer On Module (COM) Sales and Revenue in Global (2020-2025)
7.12.5 Aaeon Key News & Latest Developments
7.13 Toradex
7.13.1 Toradex Company Summary
7.13.2 Toradex Business Overview
7.13.3 Toradex Computer On Module (COM) Major Product Offerings
7.13.4 Toradex Computer On Module (COM) Sales and Revenue in Global (2020-2025)
7.13.5 Toradex Key News & Latest Developments
7.14 EMAC
7.14.1 EMAC Company Summary
7.14.2 EMAC Business Overview
7.14.3 EMAC Computer On Module (COM) Major Product Offerings
7.14.4 EMAC Computer On Module (COM) Sales and Revenue in Global (2020-2025)
7.14.5 EMAC Key News & Latest Developments
7.15 Avalue Technology
7.15.1 Avalue Technology Company Summary
7.15.2 Avalue Technology Business Overview
7.15.3 Avalue Technology Computer On Module (COM) Major Product Offerings
7.15.4 Avalue Technology Computer On Module (COM) Sales and Revenue in Global (2020-2025)
7.15.5 Avalue Technology Key News & Latest Developments
7.16 CompuLab
7.16.1 CompuLab Company Summary
7.16.2 CompuLab Business Overview
7.16.3 CompuLab Computer On Module (COM) Major Product Offerings
7.16.4 CompuLab Computer On Module (COM) Sales and Revenue in Global (2020-2025)
7.16.5 CompuLab Key News & Latest Developments
7.17 Variscite
7.17.1 Variscite Company Summary
7.17.2 Variscite Business Overview
7.17.3 Variscite Computer On Module (COM) Major Product Offerings
7.17.4 Variscite Computer On Module (COM) Sales and Revenue in Global (2020-2025)
7.17.5 Variscite Key News & Latest Developments
7.18 Digi International
7.18.1 Digi International Company Summary
7.18.2 Digi International Business Overview
7.18.3 Digi International Computer On Module (COM) Major Product Offerings
7.18.4 Digi International Computer On Module (COM) Sales and Revenue in Global (2020-2025)
7.18.5 Digi International Key News & Latest Developments
7.19 Olimex Ltd
7.19.1 Olimex Ltd Company Summary
7.19.2 Olimex Ltd Business Overview
7.19.3 Olimex Ltd Computer On Module (COM) Major Product Offerings
7.19.4 Olimex Ltd Computer On Module (COM) Sales and Revenue in Global (2020-2025)
7.19.5 Olimex Ltd Key News & Latest Developments
7.20 Shiratech(Aviv Technologies)
7.20.1 Shiratech(Aviv Technologies) Company Summary
7.20.2 Shiratech(Aviv Technologies) Business Overview
7.20.3 Shiratech(Aviv Technologies) Computer On Module (COM) Major Product Offerings
7.20.4 Shiratech(Aviv Technologies) Computer On Module (COM) Sales and Revenue in Global (2020-2025)
7.20.5 Shiratech(Aviv Technologies) Key News & Latest Developments
7.21 Critical Link, LLC
7.21.1 Critical Link, LLC Company Summary
7.21.2 Critical Link, LLC Business Overview
7.21.3 Critical Link, LLC Computer On Module (COM) Major Product Offerings
7.21.4 Critical Link, LLC Computer On Module (COM) Sales and Revenue in Global (2020-2025)
7.21.5 Critical Link, LLC Key News & Latest Developments
7.22 IWave Systems Technologies
7.22.1 IWave Systems Technologies Company Summary
7.22.2 IWave Systems Technologies Business Overview
7.22.3 IWave Systems Technologies Computer On Module (COM) Major Product Offerings
7.22.4 IWave Systems Technologies Computer On Module (COM) Sales and Revenue in Global (2020-2025)
7.22.5 IWave Systems Technologies Key News & Latest Developments
7.23 Calixto Systems
7.23.1 Calixto Systems Company Summary
7.23.2 Calixto Systems Business Overview
7.23.3 Calixto Systems Computer On Module (COM) Major Product Offerings
7.23.4 Calixto Systems Computer On Module (COM) Sales and Revenue in Global (2020-2025)
7.23.5 Calixto Systems Key News & Latest Developments
8 Global Computer On Module (COM) Production Capacity, Analysis
8.1 Global Computer On Module (COM) Production Capacity, 2020-2032
8.2 Computer On Module (COM) Production Capacity of Key Manufacturers in Global Market
8.3 Global Computer On Module (COM) Production by Region
9 Key Market Trends, Opportunity, Drivers and Restraints
9.1 Market Opportunities & Trends
9.2 Market Drivers
9.3 Market Restraints
10 Computer On Module (COM) Supply Chain Analysis
10.1 Computer On Module (COM) Industry Value Chain
10.2 Computer On Module (COM) Upstream Market
10.3 Computer On Module (COM) Downstream and Clients
10.4 Marketing Channels Analysis
10.4.1 Marketing Channels
10.4.2 Computer On Module (COM) Distributors and Sales Agents in Global
11 Conclusion
12 Appendix
12.1 Note
12.2 Examples of Clients
12.3 DisclaimerList of Tables
Table 1. Key Players of Computer On Module (COM) in Global Market
Table 2. Top Computer On Module (COM) Players in Global Market, Ranking by Revenue (2024)
Table 3. Global Computer On Module (COM) Revenue by Companies, (US$, Mn), 2020-2025
Table 4. Global Computer On Module (COM) Revenue Share by Companies, 2020-2025
Table 5. Global Computer On Module (COM) Sales by Companies, (K Units), 2020-2025
Table 6. Global Computer On Module (COM) Sales Share by Companies, 2020-2025
Table 7. Key Manufacturers Computer On Module (COM) Price (2020-2025) & (US$/Unit)
Table 8. Global Manufacturers Computer On Module (COM) Product Type
Table 9. List of Global Tier 1 Computer On Module (COM) Companies, Revenue (US$, Mn) in 2024 and Market Share
Table 10. List of Global Tier 2 and Tier 3 Computer On Module (COM) Companies, Revenue (US$, Mn) in 2024 and Market Share
Table 11. Segment by Type – Global Computer On Module (COM) Revenue, (US$, Mn), 2024 & 2032
Table 12. Segment by Type – Global Computer On Module (COM) Revenue (US$, Mn), 2020-2025
Table 13. Segment by Type – Global Computer On Module (COM) Revenue (US$, Mn), 2026-2032
Table 14. Segment by Type – Global Computer On Module (COM) Sales (K Units), 2020-2025
Table 15. Segment by Type – Global Computer On Module (COM) Sales (K Units), 2026-2032
Table 16. Segment by Application – Global Computer On Module (COM) Revenue, (US$, Mn), 2024 & 2032
Table 17. Segment by Application – Global Computer On Module (COM) Revenue, (US$, Mn), 2020-2025
Table 18. Segment by Application – Global Computer On Module (COM) Revenue, (US$, Mn), 2026-2032
Table 19. Segment by Application – Global Computer On Module (COM) Sales, (K Units), 2020-2025
Table 20. Segment by Application – Global Computer On Module (COM) Sales, (K Units), 2026-2032
Table 21. By Region – Global Computer On Module (COM) Revenue, (US$, Mn), 2025-2032
Table 22. By Region – Global Computer On Module (COM) Revenue, (US$, Mn), 2020-2025
Table 23. By Region – Global Computer On Module (COM) Revenue, (US$, Mn), 2026-2032
Table 24. By Region – Global Computer On Module (COM) Sales, (K Units), 2020-2025
Table 25. By Region – Global Computer On Module (COM) Sales, (K Units), 2026-2032
Table 26. By Country – North America Computer On Module (COM) Revenue, (US$, Mn), 2020-2025
Table 27. By Country – North America Computer On Module (COM) Revenue, (US$, Mn), 2026-2032
Table 28. By Country – North America Computer On Module (COM) Sales, (K Units), 2020-2025
Table 29. By Country – North America Computer On Module (COM) Sales, (K Units), 2026-2032
Table 30. By Country – Europe Computer On Module (COM) Revenue, (US$, Mn), 2020-2025
Table 31. By Country – Europe Computer On Module (COM) Revenue, (US$, Mn), 2026-2032
Table 32. By Country – Europe Computer On Module (COM) Sales, (K Units), 2020-2025
Table 33. By Country – Europe Computer On Module (COM) Sales, (K Units), 2026-2032
Table 34. By Region – Asia Computer On Module (COM) Revenue, (US$, Mn), 2020-2025
Table 35. By Region – Asia Computer On Module (COM) Revenue, (US$, Mn), 2026-2032
Table 36. By Region – Asia Computer On Module (COM) Sales, (K Units), 2020-2025
Table 37. By Region – Asia Computer On Module (COM) Sales, (K Units), 2026-2032
Table 38. By Country – South America Computer On Module (COM) Revenue, (US$, Mn), 2020-2025
Table 39. By Country – South America Computer On Module (COM) Revenue, (US$, Mn), 2026-2032
Table 40. By Country – South America Computer On Module (COM) Sales, (K Units), 2020-2025
Table 41. By Country – South America Computer On Module (COM) Sales, (K Units), 2026-2032
Table 42. By Country – Middle East & Africa Computer On Module (COM) Revenue, (US$, Mn), 2020-2025
Table 43. By Country – Middle East & Africa Computer On Module (COM) Revenue, (US$, Mn), 2026-2032
Table 44. By Country – Middle East & Africa Computer On Module (COM) Sales, (K Units), 2020-2025
Table 45. By Country – Middle East & Africa Computer On Module (COM) Sales, (K Units), 2026-2032
Table 46. Kontron Company Summary
Table 47. Kontron Computer On Module (COM) Product Offerings
Table 48. Kontron Computer On Module (COM) Sales (K Units), Revenue (US$, Mn) and Average Price (US$/Unit) & (2020-2025)
Table 49. Kontron Key News & Latest Developments
Table 50. Congatec Company Summary
Table 51. Congatec Computer On Module (COM) Product Offerings
Table 52. Congatec Computer On Module (COM) Sales (K Units), Revenue (US$, Mn) and Average Price (US$/Unit) & (2020-2025)
Table 53. Congatec Key News & Latest Developments
Table 54. MSC Technologies(Avnet) Company Summary
Table 55. MSC Technologies(Avnet) Computer On Module (COM) Product Offerings
Table 56. MSC Technologies(Avnet) Computer On Module (COM) Sales (K Units), Revenue (US$, Mn) and Average Price (US$/Unit) & (2020-2025)
Table 57. MSC Technologies(Avnet) Key News & Latest Developments
Table 58. Advantech Company Summary
Table 59. Advantech Computer On Module (COM) Product Offerings
Table 60. Advantech Computer On Module (COM) Sales (K Units), Revenue (US$, Mn) and Average Price (US$/Unit) & (2020-2025)
Table 61. Advantech Key News & Latest Developments
Table 62. ADLink Company Summary
Table 63. ADLink Computer On Module (COM) Product Offerings
Table 64. ADLink Computer On Module (COM) Sales (K Units), Revenue (US$, Mn) and Average Price (US$/Unit) & (2020-2025)
Table 65. ADLink Key News & Latest Developments
Table 66. Portwell Company Summary
Table 67. Portwell Computer On Module (COM) Product Offerings
Table 68. Portwell Computer On Module (COM) Sales (K Units), Revenue (US$, Mn) and Average Price (US$/Unit) & (2020-2025)
Table 69. Portwell Key News & Latest Developments
Table 70. Eurotech Company Summary
Table 71. Eurotech Computer On Module (COM) Product Offerings
Table 72. Eurotech Computer On Module (COM) Sales (K Units), Revenue (US$, Mn) and Average Price (US$/Unit) & (2020-2025)
Table 73. Eurotech Key News & Latest Developments
Table 74. SECO srl Company Summary
Table 75. SECO srl Computer On Module (COM) Product Offerings
Table 76. SECO srl Computer On Module (COM) Sales (K Units), Revenue (US$, Mn) and Average Price (US$/Unit) & (2020-2025)
Table 77. SECO srl Key News & Latest Developments
Table 78. Technexion Company Summary
Table 79. Technexion Computer On Module (COM) Product Offerings
Table 80. Technexion Computer On Module (COM) Sales (K Units), Revenue (US$, Mn) and Average Price (US$/Unit) & (2020-2025)
Table 81. Technexion Key News & Latest Developments
Table 82. Phytec Company Summary
Table 83. Phytec Computer On Module (COM) Product Offerings
Table 84. Phytec Computer On Module (COM) Sales (K Units), Revenue (US$, Mn) and Average Price (US$/Unit) & (2020-2025)
Table 85. Phytec Key News & Latest Developments
Table 86. Axiomtek Company Summary
Table 87. Axiomtek Computer On Module (COM) Product Offerings
Table 88. Axiomtek Computer On Module (COM) Sales (K Units), Revenue (US$, Mn) and Average Price (US$/Unit) & (2020-2025)
Table 89. Axiomtek Key News & Latest Developments
Table 90. Aaeon Company Summary
Table 91. Aaeon Computer On Module (COM) Product Offerings
Table 92. Aaeon Computer On Module (COM) Sales (K Units), Revenue (US$, Mn) and Average Price (US$/Unit) & (2020-2025)
Table 93. Aaeon Key News & Latest Developments
Table 94. Toradex Company Summary
Table 95. Toradex Computer On Module (COM) Product Offerings
Table 96. Toradex Computer On Module (COM) Sales (K Units), Revenue (US$, Mn) and Average Price (US$/Unit) & (2020-2025)
Table 97. Toradex Key News & Latest Developments
Table 98. EMAC Company Summary
Table 99. EMAC Computer On Module (COM) Product Offerings
Table 100. EMAC Computer On Module (COM) Sales (K Units), Revenue (US$, Mn) and Average Price (US$/Unit) & (2020-2025)
Table 101. EMAC Key News & Latest Developments
Table 102. Avalue Technology Company Summary
Table 103. Avalue Technology Computer On Module (COM) Product Offerings
Table 104. Avalue Technology Computer On Module (COM) Sales (K Units), Revenue (US$, Mn) and Average Price (US$/Unit) & (2020-2025)
Table 105. Avalue Technology Key News & Latest Developments
Table 106. CompuLab Company Summary
Table 107. CompuLab Computer On Module (COM) Product Offerings
Table 108. CompuLab Computer On Module (COM) Sales (K Units), Revenue (US$, Mn) and Average Price (US$/Unit) & (2020-2025)
Table 109. CompuLab Key News & Latest Developments
Table 110. Variscite Company Summary
Table 111. Variscite Computer On Module (COM) Product Offerings
Table 112. Variscite Computer On Module (COM) Sales (K Units), Revenue (US$, Mn) and Average Price (US$/Unit) & (2020-2025)
Table 113. Variscite Key News & Latest Developments
Table 114. Digi International Company Summary
Table 115. Digi International Computer On Module (COM) Product Offerings
Table 116. Digi International Computer On Module (COM) Sales (K Units), Revenue (US$, Mn) and Average Price (US$/Unit) & (2020-2025)
Table 117. Digi International Key News & Latest Developments
Table 118. Olimex Ltd Company Summary
Table 119. Olimex Ltd Computer On Module (COM) Product Offerings
Table 120. Olimex Ltd Computer On Module (COM) Sales (K Units), Revenue (US$, Mn) and Average Price (US$/Unit) & (2020-2025)
Table 121. Olimex Ltd Key News & Latest Developments
Table 122. Shiratech(Aviv Technologies) Company Summary
Table 123. Shiratech(Aviv Technologies) Computer On Module (COM) Product Offerings
Table 124. Shiratech(Aviv Technologies) Computer On Module (COM) Sales (K Units), Revenue (US$, Mn) and Average Price (US$/Unit) & (2020-2025)
Table 125. Shiratech(Aviv Technologies) Key News & Latest Developments
Table 126. Critical Link, LLC Company Summary
Table 127. Critical Link, LLC Computer On Module (COM) Product Offerings
Table 128. Critical Link, LLC Computer On Module (COM) Sales (K Units), Revenue (US$, Mn) and Average Price (US$/Unit) & (2020-2025)
Table 129. Critical Link, LLC Key News & Latest Developments
Table 130. IWave Systems Technologies Company Summary
Table 131. IWave Systems Technologies Computer On Module (COM) Product Offerings
Table 132. IWave Systems Technologies Computer On Module (COM) Sales (K Units), Revenue (US$, Mn) and Average Price (US$/Unit) & (2020-2025)
Table 133. IWave Systems Technologies Key News & Latest Developments
Table 134. Calixto Systems Company Summary
Table 135. Calixto Systems Computer On Module (COM) Product Offerings
Table 136. Calixto Systems Computer On Module (COM) Sales (K Units), Revenue (US$, Mn) and Average Price (US$/Unit) & (2020-2025)
Table 137. Calixto Systems Key News & Latest Developments
Table 138. Computer On Module (COM) Capacity of Key Manufacturers in Global Market, 2023-2025 (K Units)
Table 139. Global Computer On Module (COM) Capacity Market Share of Key Manufacturers, 2023-2025
Table 140. Global Computer On Module (COM) Production by Region, 2020-2025 (K Units)
Table 141. Global Computer On Module (COM) Production by Region, 2026-2032 (K Units)
Table 142. Computer On Module (COM) Market Opportunities & Trends in Global Market
Table 143. Computer On Module (COM) Market Drivers in Global Market
Table 144. Computer On Module (COM) Market Restraints in Global Market
Table 145. Computer On Module (COM) Raw Materials
Table 146. Computer On Module (COM) Raw Materials Suppliers in Global Market
Table 147. Typical Computer On Module (COM) Downstream
Table 148. Computer On Module (COM) Downstream Clients in Global Market
Table 149. Computer On Module (COM) Distributors and Sales Agents in Global Market

List of Figures
Figure 1. Computer On Module (COM) Product Picture
Figure 2. Computer On Module (COM) Segment by Type in 2024
Figure 3. Computer On Module (COM) Segment by Application in 2024
Figure 4. Global Computer On Module (COM) Market Overview: 2024
Figure 5. Key Caveats
Figure 6. Global Computer On Module (COM) Market Size: 2024 VS 2032 (US$, Mn)
Figure 7. Global Computer On Module (COM) Revenue: 2020-2032 (US$, Mn)
Figure 8. Computer On Module (COM) Sales in Global Market: 2020-2032 (K Units)
Figure 9. The Top 3 and 5 Players Market Share by Computer On Module (COM) Revenue in 2024
Figure 10. Segment by Type – Global Computer On Module (COM) Revenue, (US$, Mn), 2024 & 2032
Figure 11. Segment by Type – Global Computer On Module (COM) Revenue Market Share, 2020-2032
Figure 12. Segment by Type – Global Computer On Module (COM) Sales Market Share, 2020-2032
Figure 13. Segment by Type – Global Computer On Module (COM) Price (US$/Unit), 2020-2032
Figure 14. Segment by Application – Global Computer On Module (COM) Revenue, (US$, Mn), 2024 & 2032
Figure 15. Segment by Application – Global Computer On Module (COM) Revenue Market Share, 2020-2032
Figure 16. Segment by Application – Global Computer On Module (COM) Sales Market Share, 2020-2032
Figure 17. Segment by Application -Global Computer On Module (COM) Price (US$/Unit), 2020-2032
Figure 18. By Region – Global Computer On Module (COM) Revenue, (US$, Mn), 2025 & 2032
Figure 19. By Region – Global Computer On Module (COM) Revenue Market Share, 2020 VS 2024 VS 2032
Figure 20. By Region – Global Computer On Module (COM) Revenue Market Share, 2020-2032
Figure 21. By Region – Global Computer On Module (COM) Sales Market Share, 2020-2032
Figure 22. By Country – North America Computer On Module (COM) Revenue Market Share, 2020-2032
Figure 23. By Country – North America Computer On Module (COM) Sales Market Share, 2020-2032
Figure 24. United States Computer On Module (COM) Revenue, (US$, Mn), 2020-2032
Figure 25. Canada Computer On Module (COM) Revenue, (US$, Mn), 2020-2032
Figure 26. Mexico Computer On Module (COM) Revenue, (US$, Mn), 2020-2032
Figure 27. By Country – Europe Computer On Module (COM) Revenue Market Share, 2020-2032
Figure 28. By Country – Europe Computer On Module (COM) Sales Market Share, 2020-2032
Figure 29. Germany Computer On Module (COM) Revenue, (US$, Mn), 2020-2032
Figure 30. France Computer On Module (COM) Revenue, (US$, Mn), 2020-2032
Figure 31. U.K. Computer On Module (COM) Revenue, (US$, Mn), 2020-2032
Figure 32. Italy Computer On Module (COM) Revenue, (US$, Mn), 2020-2032
Figure 33. Russia Computer On Module (COM) Revenue, (US$, Mn), 2020-2032
Figure 34. Nordic Countries Computer On Module (COM) Revenue, (US$, Mn), 2020-2032
Figure 35. Benelux Computer On Module (COM) Revenue, (US$, Mn), 2020-2032
Figure 36. By Region – Asia Computer On Module (COM) Revenue Market Share, 2020-2032
Figure 37. By Region – Asia Computer On Module (COM) Sales Market Share, 2020-2032
Figure 38. China Computer On Module (COM) Revenue, (US$, Mn), 2020-2032
Figure 39. Japan Computer On Module (COM) Revenue, (US$, Mn), 2020-2032
Figure 40. South Korea Computer On Module (COM) Revenue, (US$, Mn), 2020-2032
Figure 41. Southeast Asia Computer On Module (COM) Revenue, (US$, Mn), 2020-2032
Figure 42. India Computer On Module (COM) Revenue, (US$, Mn), 2020-2032
Figure 43. By Country – South America Computer On Module (COM) Revenue Market Share, 2020-2032
Figure 44. By Country – South America Computer On Module (COM) Sales, Market Share, 2020-2032
Figure 45. Brazil Computer On Module (COM) Revenue, (US$, Mn), 2020-2032
Figure 46. Argentina Computer On Module (COM) Revenue, (US$, Mn), 2020-2032
Figure 47. By Country – Middle East & Africa Computer On Module (COM) Revenue, Market Share, 2020-2032
Figure 48. By Country – Middle East & Africa Computer On Module (COM) Sales, Market Share, 2020-2032
Figure 49. Turkey Computer On Module (COM) Revenue, (US$, Mn), 2020-2032
Figure 50. Israel Computer On Module (COM) Revenue, (US$, Mn), 2020-2032
Figure 51. Saudi Arabia Computer On Module (COM) Revenue, (US$, Mn), 2020-2032
Figure 52. UAE Computer On Module (COM) Revenue, (US$, Mn), 2020-2032
Figure 53. Global Computer On Module (COM) Production Capacity (K Units), 2020-2032
Figure 54. The Percentage of Production Computer On Module (COM) by Region, 2024 VS 2032
Figure 55. Computer On Module (COM) Industry Value Chain
Figure 56. Marketing Channels