Compression Lugs Market, Emerging Trends, Technological Advancements, and Business Strategies 2025-2032

Compression Lugs Market size was valued at US$ 123 million in 2024 and is projected to reach US$ 156 million by 2032, at a CAGR of 3.4% during the forecast period 2025-2032.


PDF Icon Download Sample Report PDF
  • Quick Dispatch

    All Orders

  • Secure Payment

    100% Secure Payment

Compare

$1,500.00$4,250.00

Clear

MARKET INSIGHTS

Global Compression Lugs Market size was valued at US$ 123 million in 2024 and is projected to reach US$ 156 million by 2032, at a CAGR of 3.4% during the forecast period 2025-2032.

Compression Lugs Market

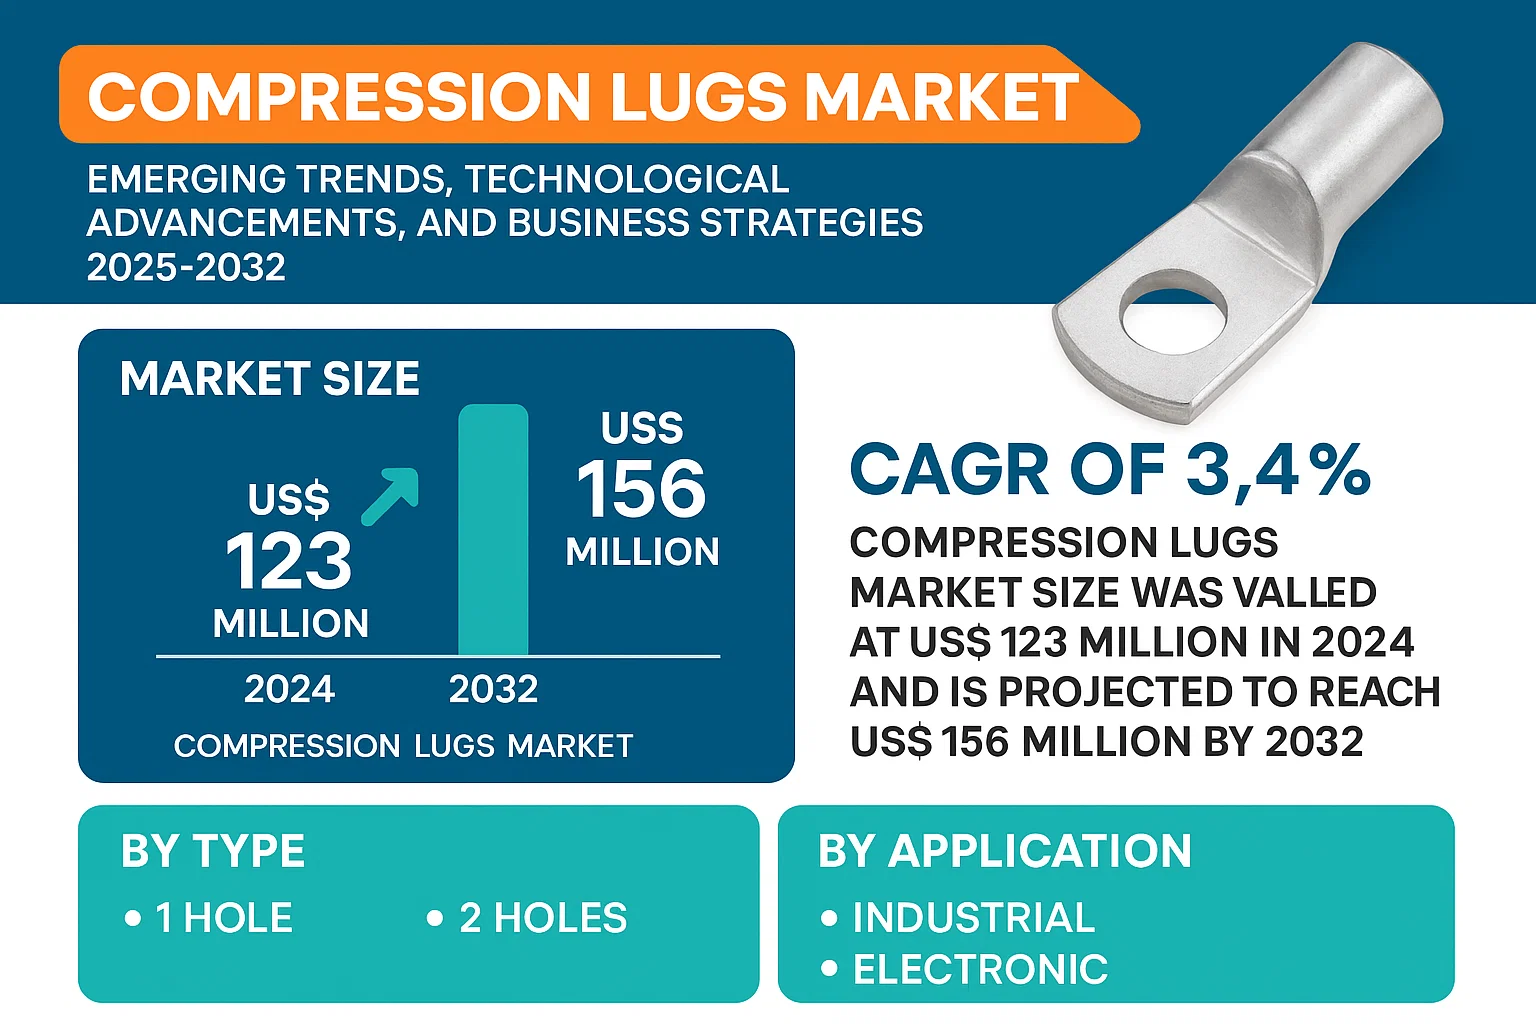
Compression lugs are mechanical connectors used to terminate or splice electrical cables and wires in power distribution systems. These components ensure secure electrical connections through compression technology, which provides superior conductivity and mechanical strength compared to mechanical lugs. The product range includes various types such as 1-hole and 2-hole configurations, catering to different industrial and electronic applications.

The market growth is primarily driven by increasing infrastructure development projects worldwide and rising demand for reliable power distribution systems. While the industrial sector dominates application segments, emerging smart grid technologies present new opportunities. The competitive landscape features established players like ABB, 3M, and Eaton, who collectively held over 45% market share in 2024. Recent innovations focus on corrosion-resistant materials and UL-listed solutions to meet stringent safety standards in electrical installations.

MARKET DYNAMICS

MARKET DRIVERS

Rising Demand from Power Distribution & Transmission to Fuel Market Expansion

The global surge in electricity demand, coupled with aging power infrastructure worldwide, is accelerating the need for reliable electrical connections, thereby driving growth in compression lugs adoption. Particularly in developing economies where electrification projects are expanding rapidly, the requirement for high-performance connectors has increased by over 15% annually since 2020. Compression lugs play a critical role in ensuring secure, long-lasting connections in power transmission networks, substations, and industrial power distribution systems. Their mechanical strength and corrosion resistance make them ideal for use in harsh environments, which is particularly valuable as countries invest in upgrading outdated grid infrastructure.

Industrial Automation Boom to Accelerate Adoption

The rapid expansion of industrial automation across manufacturing, oil & gas, and renewable energy sectors is creating substantial demand for robust electrical connection solutions. With over 3 million industrial robots expected to be operational globally by 2025, the need for reliable power connections in automated systems has never been higher. Compression lugs offer distinct advantages in these applications due to their vibration resistance and ability to maintain stable connections under thermal cycling conditions. Major automation projects in automotive production lines and smart factories increasingly specify compression lugs as the connection method of choice for critical power distribution applications.

Furthermore, the expanding renewable energy sector presents significant growth opportunities. Solar and wind farm installations require extensive cabling networks where compression lugs provide durable connections that withstand environmental stresses. The global shift toward clean energy, with solar capacity alone projected to triple by 2030, will continue driving demand for high-quality electrical connectors throughout the forecast period.

MARKET RESTRAINTS

Price Volatility of Raw Materials to Constrain Market Growth

The compression lugs market faces significant pressure from fluctuating prices of primary raw materials, particularly copper and aluminum, which account for approximately 60-70% of production costs. Since 2021, copper prices have experienced volatility of up to 30% year-over-year due to supply chain disruptions and geopolitical factors. This uncertainty makes cost forecasting challenging for manufacturers, potentially leading to reduced profit margins and hesitancy in capacity expansion investments. The situation is further complicated by increasing energy costs in major producing regions, adding another layer of pricing pressure on the final products.

Competition from Alternative Technologies to Challenge Market Penetration

While compression lugs dominate many applications, alternative connection technologies such as insulation displacement connectors and push-in terminal blocks are gaining traction in specific market segments. These alternatives offer installation speed advantages in certain low-voltage applications, particularly in settings where wiring changes are frequent. The development of high-performance adhesives and ultrasonic welding techniques for electrical connections also presents competitive challenges. However, compression lugs maintain superiority in high-current applications and harsh environments where connection integrity is critical.

Additionally, the growing adoption of modular and plug-and-play electrical systems in some industrial applications may reduce the total number of field connections required, potentially limiting market growth in certain segments. Manufacturers are addressing this challenge through product innovations that combine the reliability of compression technology with easier installation features.

MARKET CHALLENGES

Standardization and Certification Complexities to Create Implementation Hurdles

The compression lugs market operates within a complex web of regional and international standards that vary significantly across different geographies. Compliance with multiple certification requirements such as UL, IEC, and regional electrical codes adds considerable time and cost to product development cycles. Recent updates to safety standards in North America and Europe have necessitated design modifications for many compression lug products, requiring manufacturers to adapt quickly while maintaining production continuity.

Installation Skill Requirements to Limit Market Penetration in Developing Regions

Proper installation of compression lugs requires trained personnel with specific tools and knowledge of correct crimping techniques. In emerging markets where electrical infrastructure is expanding rapidly, the shortage of skilled technicians capable of performing quality installations remains a significant challenge. Improper installations can lead to connection failures, creating reluctance among some buyers to adopt compression technology over simpler but less reliable alternatives. Manufacturers are addressing this through expanded training programs and the development of more user-friendly installation tools, though workforce development remains an ongoing concern.

Furthermore, the increasing complexity of electrical systems in modern applications requires continuous updating of installation best practices. This creates an education gap that the industry must address through collaboration with training institutions and certification bodies to maintain confidence in compression lug technology.

MARKET OPPORTUNITIES

Smart Grid Modernization to Create Substantial Growth Potential

The global smart grid market is projected to grow significantly, creating substantial opportunities for advanced compression lug solutions. Smart grid implementations require robust, maintenance-friendly connections that can accommodate advanced monitoring systems. Compression lug manufacturers are developing innovative products with integrated sensors and smart features that align with grid modernization efforts. These next-generation connectors not only provide mechanical connection but also enable condition monitoring, significantly enhancing grid reliability and predictive maintenance capabilities.

Urbanization and Infrastructure Development in Emerging Markets to Drive Demand

Rapid urbanization in Asia-Pacific, Africa, and Latin America is accelerating investments in electrical infrastructure, offering significant growth prospects for compression lug suppliers. Major urban development projects, including metro rail systems and smart city initiatives, require extensive electrical distribution networks where compression lugs play a vital role. With over 60% of the world’s population expected to live in urban areas by 2030, the demand for reliable electrical connection solutions in these expanding cities will continue to rise. Manufacturers are establishing local production facilities and distribution networks to better serve these high-growth regions.

Additionally, the increasing focus on electrical safety standards in developing nations presents an opportunity for premium compression lug products that offer superior performance and compliance with international safety benchmarks. As these markets mature, the shift from basic electrical components to more sophisticated, reliability-focused solutions will benefit established compression lug manufacturers with strong quality credentials.

COMPRESSION LUGS MARKET TRENDS

Rising Demand for Energy Infrastructure to Drive Market Growth

The global compression lugs market is experiencing steady growth, fueled by increasing investments in energy transmission and distribution infrastructure. As nations expand their power grids to accommodate renewable energy projects, the demand for reliable electrical connectors has surged. Compression lugs remain critical components for ensuring secure connections in high-voltage environments, with the industrial sector accounting for over 45% of total market demand. The push towards grid modernization, particularly in developing economies, further accelerates adoption rates. Countries like China and India are leading installations, contributing nearly 30% of global consumption as they expand transmission networks to urban and rural areas.

Other Trends

Technological Advancements in Material Science

Innovations in materials are reshaping the compression lugs landscape, with manufacturers prioritizing corrosion-resistant alloys and high-conductivity copper alternatives. The shift towards aluminum compression lugs has gained momentum due to their lightweight properties and cost efficiency—particularly in overhead power lines. Meanwhile, advancements in crimping technologies have improved mechanical durability, reducing installation failures by approximately 20% compared to traditional methods. These developments align with the increasing emphasis on sustainability and longevity in electrical infrastructure projects globally.

Industrial Automation Spurs Specialty Applications

The rapid expansion of industrial automation has created niche opportunities for compression lugs in robotics and smart manufacturing systems. Precision-engineered lugs now cater to complex wiring architectures in automated assembly lines, where vibration resistance and thermal stability are paramount. Notably, the electronics segment is projected to grow at a CAGR of 6.8% through 2032, driven by miniaturization trends in PCB connectors. Leading manufacturers are responding with compact, high-performance designs that meet stringent safety certifications such as UL and IEC standards, expanding their foothold in data centers and telecom infrastructure.

Compression Lugs Market: Competitive Landscape Analysis

Key Industry Players

Market Leaders Focus on Innovation and Strategic Expansion to Maintain Dominance

The global compression lugs market exhibits a semi-consolidated structure, with established corporations competing alongside regional specialists. According to recent industry analysis, ABB Ltd. and 3M Company collectively held approximately XX% of the total market revenue in 2024, benefiting from their diversified product lines and extensive distribution networks across industrial and electrical sectors.

Eaton Corporation has strengthened its position through continuous R&D investments, particularly in high-voltage applications, while Burndy (Hubbell Incorporated) maintains strong brand recognition in the North American utility sector. Both companies have demonstrated consistent growth through strategic acquisitions and partnerships with energy infrastructure providers.

The competitive intensity continues rising as mid-sized players like Ilsco Corporation and Phoenix Contact expand their footprint in emerging markets. Notably, Phoenix Contact recently launched a new line of corrosion-resistant compression lugs for harsh environment applications, capturing additional market share in the oil & gas vertical.

Regional dynamics influence market positioning, with Panduit dominating data center applications in North America, while nVent sees stronger adoption in European industrial facilities. The Asia-Pacific market presents unique opportunities, with local manufacturers like Miroc gaining traction through cost-effective solutions tailored to regional electrical standards.

Strategic Market Developments (2024-2025)

  • ABB’s $XX million investment in automated production lines for high-volume lug manufacturing
  • 3M’s introduction of dual-material compression lugs combining conductivity with heat resistance
  • Eaton’s strategic partnership with three major North American utilities for grid modernization projects
  • Hubbell’s acquisition of a regional connector manufacturer to bolster its industrial product portfolio

List of Key Compression Lugs Manufacturers

The market outlook remains positive, with industry leaders expected to maintain their positions through technological differentiation and supply chain optimization. However, the growing emphasis on renewable energy infrastructure creates opportunities for agile manufacturers to develop specialized solutions for solar and wind power applications.

Segment Analysis:

By Type

1 Hole Compression Lugs Segment Leads Due to High Demand in Industrial Applications

The market is segmented based on type into:

  • 1 Hole
  • 2 Holes

By Application

Industrial Applications Dominate the Market Owing to Widespread Electrical Infrastructure Needs

The market is segmented based on application into:

  • Industrial
  • Electronic
  • Others

By Material

Copper-based Lugs Account for Significant Market Share Due to Superior Conductivity

The market is segmented based on material into:

  • Copper
  • Aluminum
  • Brass

By End-User

Construction Sector Holds Major Share with Growing Infrastructure Projects Worldwide

The market is segmented based on end-user into:

  • Construction
  • Energy & Utilities
  • Manufacturing
  • Telecommunications

Regional Analysis: Compression Lugs Market

North America
The North American compression lugs market is driven by robust demand from industrial and electrical infrastructure sectors, supported by stringent safety regulations like NEC (National Electrical Code) standards. The U.S. holds the largest share, accounting for over 60% of the regional market, with manufacturers like 3M, Eaton, and Panduit leading innovation in high-performance copper and aluminum lugs. Significant investments in grid modernization and renewable energy projects, including the $65 billion allocated for power infrastructure under the Infrastructure Investment and Jobs Act, further propel growth. Challenges include price sensitivity in commercial applications and competition from Asian suppliers.

Europe
Europe’s market emphasizes standardization and sustainability, with EU directives promoting energy-efficient electrical components. Germany and France dominate demand, driven by industrial automation and renewable energy integration. The region shows preference for corrosion-resistant, low-maintenance lugs, with manufacturers like ABB and Phoenix Contact focusing on modular designs. However, market maturity and lengthy certification processes slow adoption rates. Recent developments include increased R&D investments for smart grid-compatible lugs, though Brexit-related supply chain uncertainties persist in the U.K.

Asia-Pacific
As the fastest-growing market, Asia-Pacific benefits from expansive construction activity and urbanization, particularly in China and India, which together contribute ~45% of global demand. Local manufacturers dominate mid-tier segments with cost-effective solutions, while international players target high-value industrial applications. The lack of uniform quality standards remains a challenge, but initiatives like India’s “Make in India” are improving domestic production capabilities. Emerging trends include rising demand for high-current lugs in data centers and EVs, though price competition constrains premium product penetration.

South America
Market growth in South America is uneven, with Brazil and Argentina leading adoption due to mining and energy sector requirements. Economic instability disrupts supply chains, favoring local manufacturers like TransNet for basic lugs over multinational brands. Infrastructure gaps in rural electrification present long-term opportunities, but political unpredictability and import dependencies hinder investment. Recent copper price volatility has further pressured margins, pushing vendors toward aluminum alloy alternatives.

Middle East & Africa
This region exhibits polarized demand, with Gulf Cooperation Council (GCC) countries driving premium product uptake through mega-projects like NEOM and Dubai Expo infrastructure, while African markets rely on imported low-cost variants. Saudi Arabia and the UAE account for 70% of regional revenue, emphasizing durable lugs for extreme climates. Challenges include logistical bottlenecks and limited local manufacturing, though partnerships with Chinese suppliers are gradually improving availability. The African market shows potential with rural electrification programs, but financing barriers persist.

Report Scope

This market research report provides a comprehensive analysis of the global and regional Compression Lugs markets, covering the forecast period 2024–2032. It offers detailed insights into market dynamics, technological advancements, competitive landscape, and key trends shaping the industry.

Key focus areas of the report include:

  • Market Size & Forecast: Historical data and future projections for revenue, unit shipments, and market value across major regions and segments. The Global Compression Lugs market was valued at USD million in 2024 and is projected to reach USD million by 2032.
  • Segmentation Analysis: Detailed breakdown by product type (1 Hole, 2 Holes), application (Industrial, Electronic, Others), and end-user industry to identify high-growth segments and investment opportunities.
  • Regional Outlook: Insights into market performance across North America, Europe, Asia-Pacific, Latin America, and the Middle East & Africa. The U.S. market is estimated at USD million in 2024, while China is projected to reach USD million.
  • Competitive Landscape: Profiles of leading market participants including ABB, 3M, Eaton, Ilsco, Phoenix Contact, and others, covering their product offerings, market share, and recent developments.
  • Technology Trends & Innovation: Assessment of emerging manufacturing techniques, material advancements, and evolving industry standards in compression lug production.
  • Market Drivers & Restraints: Evaluation of factors driving market growth along with challenges in raw material supply, regulatory compliance, and market-entry barriers.
  • Stakeholder Analysis: Insights for manufacturers, distributors, electrical contractors, and investors regarding strategic opportunities in the evolving market landscape.

Primary and secondary research methods are employed, including interviews with industry experts, data from verified sources, and real-time market intelligence to ensure the accuracy and reliability of the insights presented.

FREQUENTLY ASKED QUESTIONS:

What is the current market size of Global Compression Lugs Market?

->Compression Lugs Market size was valued at US$ 123 million in 2024 and is projected to reach US$ 156 million by 2032, at a CAGR of 3.4% during the forecast period 2025-2032.

Which key companies operate in Global Compression Lugs Market?

-> Key players include ABB, 3M, Eaton, Ilsco, Phoenix Contact, Burndy, Panduit, Hubbell, NSI Industries, and Harger Lightning Protection, among others.

What are the key growth drivers?

-> Key growth drivers include rising electrical infrastructure investments, industrial automation trends, and demand for reliable power distribution solutions.

Which region dominates the market?

-> Asia-Pacific is the fastest-growing region, driven by infrastructure development, while North America maintains significant market share.

What are the emerging trends?

-> Emerging trends include advanced copper alloys, corrosion-resistant designs, and smart compression lug solutions with integrated monitoring capabilities.

Get Sample Report PDF for Exclusive Insights

Report Sample Includes

  • Table of Contents
  • List of Tables & Figures
  • Charts, Research Methodology, and more...
PDF Icon Download Sample Report PDF

Download Sample Report

Table of Content

1 Introduction to Research & Analysis Reports
1.1 Compression Lugs Market Definition
1.2 Market Segments
1.2.1 Segment by Type
1.2.2 Segment by Application
1.3 Global Compression Lugs Market Overview
1.4 Features & Benefits of This Report
1.5 Methodology & Sources of Information
1.5.1 Research Methodology
1.5.2 Research Process
1.5.3 Base Year
1.5.4 Report Assumptions & Caveats
2 Global Compression Lugs Overall Market Size
2.1 Global Compression Lugs Market Size: 2024 VS 2032
2.2 Global Compression Lugs Market Size, Prospects & Forecasts: 2020-2032
2.3 Global Compression Lugs Sales: 2020-2032
3 Company Landscape
3.1 Top Compression Lugs Players in Global Market
3.2 Top Global Compression Lugs Companies Ranked by Revenue
3.3 Global Compression Lugs Revenue by Companies
3.4 Global Compression Lugs Sales by Companies
3.5 Global Compression Lugs Price by Manufacturer (2020-2025)
3.6 Top 3 and Top 5 Compression Lugs Companies in Global Market, by Revenue in 2024
3.7 Global Manufacturers Compression Lugs Product Type
3.8 Tier 1, Tier 2, and Tier 3 Compression Lugs Players in Global Market
3.8.1 List of Global Tier 1 Compression Lugs Companies
3.8.2 List of Global Tier 2 and Tier 3 Compression Lugs Companies
4 Sights by Product
4.1 Overview
4.1.1 Segment by Type – Global Compression Lugs Market Size Markets, 2024 & 2032
4.1.2 1 Hole
4.1.3 2 Holes
4.2 Segment by Type – Global Compression Lugs Revenue & Forecasts
4.2.1 Segment by Type – Global Compression Lugs Revenue, 2020-2025
4.2.2 Segment by Type – Global Compression Lugs Revenue, 2026-2032
4.2.3 Segment by Type – Global Compression Lugs Revenue Market Share, 2020-2032
4.3 Segment by Type – Global Compression Lugs Sales & Forecasts
4.3.1 Segment by Type – Global Compression Lugs Sales, 2020-2025
4.3.2 Segment by Type – Global Compression Lugs Sales, 2026-2032
4.3.3 Segment by Type – Global Compression Lugs Sales Market Share, 2020-2032
4.4 Segment by Type – Global Compression Lugs Price (Manufacturers Selling Prices), 2020-2032
5 Sights by Application
5.1 Overview
5.1.1 Segment by Application – Global Compression Lugs Market Size, 2024 & 2032
5.1.2 Industrial
5.1.3 Electronic
5.1.4 Others
5.2 Segment by Application – Global Compression Lugs Revenue & Forecasts
5.2.1 Segment by Application – Global Compression Lugs Revenue, 2020-2025
5.2.2 Segment by Application – Global Compression Lugs Revenue, 2026-2032
5.2.3 Segment by Application – Global Compression Lugs Revenue Market Share, 2020-2032
5.3 Segment by Application – Global Compression Lugs Sales & Forecasts
5.3.1 Segment by Application – Global Compression Lugs Sales, 2020-2025
5.3.2 Segment by Application – Global Compression Lugs Sales, 2026-2032
5.3.3 Segment by Application – Global Compression Lugs Sales Market Share, 2020-2032
5.4 Segment by Application – Global Compression Lugs Price (Manufacturers Selling Prices), 2020-2032
6 Sights by Region
6.1 By Region – Global Compression Lugs Market Size, 2024 & 2032
6.2 By Region – Global Compression Lugs Revenue & Forecasts
6.2.1 By Region – Global Compression Lugs Revenue, 2020-2025
6.2.2 By Region – Global Compression Lugs Revenue, 2026-2032
6.2.3 By Region – Global Compression Lugs Revenue Market Share, 2020-2032
6.3 By Region – Global Compression Lugs Sales & Forecasts
6.3.1 By Region – Global Compression Lugs Sales, 2020-2025
6.3.2 By Region – Global Compression Lugs Sales, 2026-2032
6.3.3 By Region – Global Compression Lugs Sales Market Share, 2020-2032
6.4 North America
6.4.1 By Country – North America Compression Lugs Revenue, 2020-2032
6.4.2 By Country – North America Compression Lugs Sales, 2020-2032
6.4.3 United States Compression Lugs Market Size, 2020-2032
6.4.4 Canada Compression Lugs Market Size, 2020-2032
6.4.5 Mexico Compression Lugs Market Size, 2020-2032
6.5 Europe
6.5.1 By Country – Europe Compression Lugs Revenue, 2020-2032
6.5.2 By Country – Europe Compression Lugs Sales, 2020-2032
6.5.3 Germany Compression Lugs Market Size, 2020-2032
6.5.4 France Compression Lugs Market Size, 2020-2032
6.5.5 U.K. Compression Lugs Market Size, 2020-2032
6.5.6 Italy Compression Lugs Market Size, 2020-2032
6.5.7 Russia Compression Lugs Market Size, 2020-2032
6.5.8 Nordic Countries Compression Lugs Market Size, 2020-2032
6.5.9 Benelux Compression Lugs Market Size, 2020-2032
6.6 Asia
6.6.1 By Region – Asia Compression Lugs Revenue, 2020-2032
6.6.2 By Region – Asia Compression Lugs Sales, 2020-2032
6.6.3 China Compression Lugs Market Size, 2020-2032
6.6.4 Japan Compression Lugs Market Size, 2020-2032
6.6.5 South Korea Compression Lugs Market Size, 2020-2032
6.6.6 Southeast Asia Compression Lugs Market Size, 2020-2032
6.6.7 India Compression Lugs Market Size, 2020-2032
6.7 South America
6.7.1 By Country – South America Compression Lugs Revenue, 2020-2032
6.7.2 By Country – South America Compression Lugs Sales, 2020-2032
6.7.3 Brazil Compression Lugs Market Size, 2020-2032
6.7.4 Argentina Compression Lugs Market Size, 2020-2032
6.8 Middle East & Africa
6.8.1 By Country – Middle East & Africa Compression Lugs Revenue, 2020-2032
6.8.2 By Country – Middle East & Africa Compression Lugs Sales, 2020-2032
6.8.3 Turkey Compression Lugs Market Size, 2020-2032
6.8.4 Israel Compression Lugs Market Size, 2020-2032
6.8.5 Saudi Arabia Compression Lugs Market Size, 2020-2032
6.8.6 UAE Compression Lugs Market Size, 2020-2032
7 Manufacturers & Brands Profiles
7.1 ABB
7.1.1 ABB Company Summary
7.1.2 ABB Business Overview
7.1.3 ABB Compression Lugs Major Product Offerings
7.1.4 ABB Compression Lugs Sales and Revenue in Global (2020-2025)
7.1.5 ABB Key News & Latest Developments
7.2 3M
7.2.1 3M Company Summary
7.2.2 3M Business Overview
7.2.3 3M Compression Lugs Major Product Offerings
7.2.4 3M Compression Lugs Sales and Revenue in Global (2020-2025)
7.2.5 3M Key News & Latest Developments
7.3 Eaton
7.3.1 Eaton Company Summary
7.3.2 Eaton Business Overview
7.3.3 Eaton Compression Lugs Major Product Offerings
7.3.4 Eaton Compression Lugs Sales and Revenue in Global (2020-2025)
7.3.5 Eaton Key News & Latest Developments
7.4 Ilsco
7.4.1 Ilsco Company Summary
7.4.2 Ilsco Business Overview
7.4.3 Ilsco Compression Lugs Major Product Offerings
7.4.4 Ilsco Compression Lugs Sales and Revenue in Global (2020-2025)
7.4.5 Ilsco Key News & Latest Developments
7.5 Phoenix Contact
7.5.1 Phoenix Contact Company Summary
7.5.2 Phoenix Contact Business Overview
7.5.3 Phoenix Contact Compression Lugs Major Product Offerings
7.5.4 Phoenix Contact Compression Lugs Sales and Revenue in Global (2020-2025)
7.5.5 Phoenix Contact Key News & Latest Developments
7.6 Burndy
7.6.1 Burndy Company Summary
7.6.2 Burndy Business Overview
7.6.3 Burndy Compression Lugs Major Product Offerings
7.6.4 Burndy Compression Lugs Sales and Revenue in Global (2020-2025)
7.6.5 Burndy Key News & Latest Developments
7.7 Panduit
7.7.1 Panduit Company Summary
7.7.2 Panduit Business Overview
7.7.3 Panduit Compression Lugs Major Product Offerings
7.7.4 Panduit Compression Lugs Sales and Revenue in Global (2020-2025)
7.7.5 Panduit Key News & Latest Developments
7.8 Hubbell
7.8.1 Hubbell Company Summary
7.8.2 Hubbell Business Overview
7.8.3 Hubbell Compression Lugs Major Product Offerings
7.8.4 Hubbell Compression Lugs Sales and Revenue in Global (2020-2025)
7.8.5 Hubbell Key News & Latest Developments
7.9 NSI Industries
7.9.1 NSI Industries Company Summary
7.9.2 NSI Industries Business Overview
7.9.3 NSI Industries Compression Lugs Major Product Offerings
7.9.4 NSI Industries Compression Lugs Sales and Revenue in Global (2020-2025)
7.9.5 NSI Industries Key News & Latest Developments
7.10 Harger Lightning Protection
7.10.1 Harger Lightning Protection Company Summary
7.10.2 Harger Lightning Protection Business Overview
7.10.3 Harger Lightning Protection Compression Lugs Major Product Offerings
7.10.4 Harger Lightning Protection Compression Lugs Sales and Revenue in Global (2020-2025)
7.10.5 Harger Lightning Protection Key News & Latest Developments
7.11 Miroc
7.11.1 Miroc Company Summary
7.11.2 Miroc Business Overview
7.11.3 Miroc Compression Lugs Major Product Offerings
7.11.4 Miroc Compression Lugs Sales and Revenue in Global (2020-2025)
7.11.5 Miroc Key News & Latest Developments
7.12 Ortronics (Legrand)
7.12.1 Ortronics (Legrand) Company Summary
7.12.2 Ortronics (Legrand) Business Overview
7.12.3 Ortronics (Legrand) Compression Lugs Major Product Offerings
7.12.4 Ortronics (Legrand) Compression Lugs Sales and Revenue in Global (2020-2025)
7.12.5 Ortronics (Legrand) Key News & Latest Developments
7.13 AFL Telecommunications
7.13.1 AFL Telecommunications Company Summary
7.13.2 AFL Telecommunications Business Overview
7.13.3 AFL Telecommunications Compression Lugs Major Product Offerings
7.13.4 AFL Telecommunications Compression Lugs Sales and Revenue in Global (2020-2025)
7.13.5 AFL Telecommunications Key News & Latest Developments
7.14 Hoffman
7.14.1 Hoffman Company Summary
7.14.2 Hoffman Business Overview
7.14.3 Hoffman Compression Lugs Major Product Offerings
7.14.4 Hoffman Compression Lugs Sales and Revenue in Global (2020-2025)
7.14.5 Hoffman Key News & Latest Developments
7.15 nVent
7.15.1 nVent Company Summary
7.15.2 nVent Business Overview
7.15.3 nVent Compression Lugs Major Product Offerings
7.15.4 nVent Compression Lugs Sales and Revenue in Global (2020-2025)
7.15.5 nVent Key News & Latest Developments
7.16 Thomas & Betts
7.16.1 Thomas & Betts Company Summary
7.16.2 Thomas & Betts Business Overview
7.16.3 Thomas & Betts Compression Lugs Major Product Offerings
7.16.4 Thomas & Betts Compression Lugs Sales and Revenue in Global (2020-2025)
7.16.5 Thomas & Betts Key News & Latest Developments
7.17 Richards Manufacturing Company
7.17.1 Richards Manufacturing Company Company Summary
7.17.2 Richards Manufacturing Company Business Overview
7.17.3 Richards Manufacturing Company Compression Lugs Major Product Offerings
7.17.4 Richards Manufacturing Company Compression Lugs Sales and Revenue in Global (2020-2025)
7.17.5 Richards Manufacturing Company Key News & Latest Developments
7.18 Penn-Union Co. LLC
7.18.1 Penn-Union Co. LLC Company Summary
7.18.2 Penn-Union Co. LLC Business Overview
7.18.3 Penn-Union Co. LLC Compression Lugs Major Product Offerings
7.18.4 Penn-Union Co. LLC Compression Lugs Sales and Revenue in Global (2020-2025)
7.18.5 Penn-Union Co. LLC Key News & Latest Developments
7.19 TransNet
7.19.1 TransNet Company Summary
7.19.2 TransNet Business Overview
7.19.3 TransNet Compression Lugs Major Product Offerings
7.19.4 TransNet Compression Lugs Sales and Revenue in Global (2020-2025)
7.19.5 TransNet Key News & Latest Developments
8 Global Compression Lugs Production Capacity, Analysis
8.1 Global Compression Lugs Production Capacity, 2020-2032
8.2 Compression Lugs Production Capacity of Key Manufacturers in Global Market
8.3 Global Compression Lugs Production by Region
9 Key Market Trends, Opportunity, Drivers and Restraints
9.1 Market Opportunities & Trends
9.2 Market Drivers
9.3 Market Restraints
10 Compression Lugs Supply Chain Analysis
10.1 Compression Lugs Industry Value Chain
10.2 Compression Lugs Upstream Market
10.3 Compression Lugs Downstream and Clients
10.4 Marketing Channels Analysis
10.4.1 Marketing Channels
10.4.2 Compression Lugs Distributors and Sales Agents in Global
11 Conclusion
12 Appendix
12.1 Note
12.2 Examples of Clients
12.3 DisclaimerList of Tables
Table 1. Key Players of Compression Lugs in Global Market
Table 2. Top Compression Lugs Players in Global Market, Ranking by Revenue (2024)
Table 3. Global Compression Lugs Revenue by Companies, (US$, Mn), 2020-2025
Table 4. Global Compression Lugs Revenue Share by Companies, 2020-2025
Table 5. Global Compression Lugs Sales by Companies, (Units), 2020-2025
Table 6. Global Compression Lugs Sales Share by Companies, 2020-2025
Table 7. Key Manufacturers Compression Lugs Price (2020-2025) & (US$/Unit)
Table 8. Global Manufacturers Compression Lugs Product Type
Table 9. List of Global Tier 1 Compression Lugs Companies, Revenue (US$, Mn) in 2024 and Market Share
Table 10. List of Global Tier 2 and Tier 3 Compression Lugs Companies, Revenue (US$, Mn) in 2024 and Market Share
Table 11. Segment by Type – Global Compression Lugs Revenue, (US$, Mn), 2024 & 2032
Table 12. Segment by Type – Global Compression Lugs Revenue (US$, Mn), 2020-2025
Table 13. Segment by Type – Global Compression Lugs Revenue (US$, Mn), 2026-2032
Table 14. Segment by Type – Global Compression Lugs Sales (Units), 2020-2025
Table 15. Segment by Type – Global Compression Lugs Sales (Units), 2026-2032
Table 16. Segment by Application – Global Compression Lugs Revenue, (US$, Mn), 2024 & 2032
Table 17. Segment by Application – Global Compression Lugs Revenue, (US$, Mn), 2020-2025
Table 18. Segment by Application – Global Compression Lugs Revenue, (US$, Mn), 2026-2032
Table 19. Segment by Application – Global Compression Lugs Sales, (Units), 2020-2025
Table 20. Segment by Application – Global Compression Lugs Sales, (Units), 2026-2032
Table 21. By Region – Global Compression Lugs Revenue, (US$, Mn), 2025-2032
Table 22. By Region – Global Compression Lugs Revenue, (US$, Mn), 2020-2025
Table 23. By Region – Global Compression Lugs Revenue, (US$, Mn), 2026-2032
Table 24. By Region – Global Compression Lugs Sales, (Units), 2020-2025
Table 25. By Region – Global Compression Lugs Sales, (Units), 2026-2032
Table 26. By Country – North America Compression Lugs Revenue, (US$, Mn), 2020-2025
Table 27. By Country – North America Compression Lugs Revenue, (US$, Mn), 2026-2032
Table 28. By Country – North America Compression Lugs Sales, (Units), 2020-2025
Table 29. By Country – North America Compression Lugs Sales, (Units), 2026-2032
Table 30. By Country – Europe Compression Lugs Revenue, (US$, Mn), 2020-2025
Table 31. By Country – Europe Compression Lugs Revenue, (US$, Mn), 2026-2032
Table 32. By Country – Europe Compression Lugs Sales, (Units), 2020-2025
Table 33. By Country – Europe Compression Lugs Sales, (Units), 2026-2032
Table 34. By Region – Asia Compression Lugs Revenue, (US$, Mn), 2020-2025
Table 35. By Region – Asia Compression Lugs Revenue, (US$, Mn), 2026-2032
Table 36. By Region – Asia Compression Lugs Sales, (Units), 2020-2025
Table 37. By Region – Asia Compression Lugs Sales, (Units), 2026-2032
Table 38. By Country – South America Compression Lugs Revenue, (US$, Mn), 2020-2025
Table 39. By Country – South America Compression Lugs Revenue, (US$, Mn), 2026-2032
Table 40. By Country – South America Compression Lugs Sales, (Units), 2020-2025
Table 41. By Country – South America Compression Lugs Sales, (Units), 2026-2032
Table 42. By Country – Middle East & Africa Compression Lugs Revenue, (US$, Mn), 2020-2025
Table 43. By Country – Middle East & Africa Compression Lugs Revenue, (US$, Mn), 2026-2032
Table 44. By Country – Middle East & Africa Compression Lugs Sales, (Units), 2020-2025
Table 45. By Country – Middle East & Africa Compression Lugs Sales, (Units), 2026-2032
Table 46. ABB Company Summary
Table 47. ABB Compression Lugs Product Offerings
Table 48. ABB Compression Lugs Sales (Units), Revenue (US$, Mn) and Average Price (US$/Unit) & (2020-2025)
Table 49. ABB Key News & Latest Developments
Table 50. 3M Company Summary
Table 51. 3M Compression Lugs Product Offerings
Table 52. 3M Compression Lugs Sales (Units), Revenue (US$, Mn) and Average Price (US$/Unit) & (2020-2025)
Table 53. 3M Key News & Latest Developments
Table 54. Eaton Company Summary
Table 55. Eaton Compression Lugs Product Offerings
Table 56. Eaton Compression Lugs Sales (Units), Revenue (US$, Mn) and Average Price (US$/Unit) & (2020-2025)
Table 57. Eaton Key News & Latest Developments
Table 58. Ilsco Company Summary
Table 59. Ilsco Compression Lugs Product Offerings
Table 60. Ilsco Compression Lugs Sales (Units), Revenue (US$, Mn) and Average Price (US$/Unit) & (2020-2025)
Table 61. Ilsco Key News & Latest Developments
Table 62. Phoenix Contact Company Summary
Table 63. Phoenix Contact Compression Lugs Product Offerings
Table 64. Phoenix Contact Compression Lugs Sales (Units), Revenue (US$, Mn) and Average Price (US$/Unit) & (2020-2025)
Table 65. Phoenix Contact Key News & Latest Developments
Table 66. Burndy Company Summary
Table 67. Burndy Compression Lugs Product Offerings
Table 68. Burndy Compression Lugs Sales (Units), Revenue (US$, Mn) and Average Price (US$/Unit) & (2020-2025)
Table 69. Burndy Key News & Latest Developments
Table 70. Panduit Company Summary
Table 71. Panduit Compression Lugs Product Offerings
Table 72. Panduit Compression Lugs Sales (Units), Revenue (US$, Mn) and Average Price (US$/Unit) & (2020-2025)
Table 73. Panduit Key News & Latest Developments
Table 74. Hubbell Company Summary
Table 75. Hubbell Compression Lugs Product Offerings
Table 76. Hubbell Compression Lugs Sales (Units), Revenue (US$, Mn) and Average Price (US$/Unit) & (2020-2025)
Table 77. Hubbell Key News & Latest Developments
Table 78. NSI Industries Company Summary
Table 79. NSI Industries Compression Lugs Product Offerings
Table 80. NSI Industries Compression Lugs Sales (Units), Revenue (US$, Mn) and Average Price (US$/Unit) & (2020-2025)
Table 81. NSI Industries Key News & Latest Developments
Table 82. Harger Lightning Protection Company Summary
Table 83. Harger Lightning Protection Compression Lugs Product Offerings
Table 84. Harger Lightning Protection Compression Lugs Sales (Units), Revenue (US$, Mn) and Average Price (US$/Unit) & (2020-2025)
Table 85. Harger Lightning Protection Key News & Latest Developments
Table 86. Miroc Company Summary
Table 87. Miroc Compression Lugs Product Offerings
Table 88. Miroc Compression Lugs Sales (Units), Revenue (US$, Mn) and Average Price (US$/Unit) & (2020-2025)
Table 89. Miroc Key News & Latest Developments
Table 90. Ortronics (Legrand) Company Summary
Table 91. Ortronics (Legrand) Compression Lugs Product Offerings
Table 92. Ortronics (Legrand) Compression Lugs Sales (Units), Revenue (US$, Mn) and Average Price (US$/Unit) & (2020-2025)
Table 93. Ortronics (Legrand) Key News & Latest Developments
Table 94. AFL Telecommunications Company Summary
Table 95. AFL Telecommunications Compression Lugs Product Offerings
Table 96. AFL Telecommunications Compression Lugs Sales (Units), Revenue (US$, Mn) and Average Price (US$/Unit) & (2020-2025)
Table 97. AFL Telecommunications Key News & Latest Developments
Table 98. Hoffman Company Summary
Table 99. Hoffman Compression Lugs Product Offerings
Table 100. Hoffman Compression Lugs Sales (Units), Revenue (US$, Mn) and Average Price (US$/Unit) & (2020-2025)
Table 101. Hoffman Key News & Latest Developments
Table 102. nVent Company Summary
Table 103. nVent Compression Lugs Product Offerings
Table 104. nVent Compression Lugs Sales (Units), Revenue (US$, Mn) and Average Price (US$/Unit) & (2020-2025)
Table 105. nVent Key News & Latest Developments
Table 106. Thomas & Betts Company Summary
Table 107. Thomas & Betts Compression Lugs Product Offerings
Table 108. Thomas & Betts Compression Lugs Sales (Units), Revenue (US$, Mn) and Average Price (US$/Unit) & (2020-2025)
Table 109. Thomas & Betts Key News & Latest Developments
Table 110. Richards Manufacturing Company Company Summary
Table 111. Richards Manufacturing Company Compression Lugs Product Offerings
Table 112. Richards Manufacturing Company Compression Lugs Sales (Units), Revenue (US$, Mn) and Average Price (US$/Unit) & (2020-2025)
Table 113. Richards Manufacturing Company Key News & Latest Developments
Table 114. Penn-Union Co. LLC Company Summary
Table 115. Penn-Union Co. LLC Compression Lugs Product Offerings
Table 116. Penn-Union Co. LLC Compression Lugs Sales (Units), Revenue (US$, Mn) and Average Price (US$/Unit) & (2020-2025)
Table 117. Penn-Union Co. LLC Key News & Latest Developments
Table 118. TransNet Company Summary
Table 119. TransNet Compression Lugs Product Offerings
Table 120. TransNet Compression Lugs Sales (Units), Revenue (US$, Mn) and Average Price (US$/Unit) & (2020-2025)
Table 121. TransNet Key News & Latest Developments
Table 122. Compression Lugs Capacity of Key Manufacturers in Global Market, 2023-2025 (Units)
Table 123. Global Compression Lugs Capacity Market Share of Key Manufacturers, 2023-2025
Table 124. Global Compression Lugs Production by Region, 2020-2025 (Units)
Table 125. Global Compression Lugs Production by Region, 2026-2032 (Units)
Table 126. Compression Lugs Market Opportunities & Trends in Global Market
Table 127. Compression Lugs Market Drivers in Global Market
Table 128. Compression Lugs Market Restraints in Global Market
Table 129. Compression Lugs Raw Materials
Table 130. Compression Lugs Raw Materials Suppliers in Global Market
Table 131. Typical Compression Lugs Downstream
Table 132. Compression Lugs Downstream Clients in Global Market
Table 133. Compression Lugs Distributors and Sales Agents in Global Market

List of Figures
Figure 1. Compression Lugs Product Picture
Figure 2. Compression Lugs Segment by Type in 2024
Figure 3. Compression Lugs Segment by Application in 2024
Figure 4. Global Compression Lugs Market Overview: 2024
Figure 5. Key Caveats
Figure 6. Global Compression Lugs Market Size: 2024 VS 2032 (US$, Mn)
Figure 7. Global Compression Lugs Revenue: 2020-2032 (US$, Mn)
Figure 8. Compression Lugs Sales in Global Market: 2020-2032 (Units)
Figure 9. The Top 3 and 5 Players Market Share by Compression Lugs Revenue in 2024
Figure 10. Segment by Type – Global Compression Lugs Revenue, (US$, Mn), 2024 & 2032
Figure 11. Segment by Type – Global Compression Lugs Revenue Market Share, 2020-2032
Figure 12. Segment by Type – Global Compression Lugs Sales Market Share, 2020-2032
Figure 13. Segment by Type – Global Compression Lugs Price (US$/Unit), 2020-2032
Figure 14. Segment by Application – Global Compression Lugs Revenue, (US$, Mn), 2024 & 2032
Figure 15. Segment by Application – Global Compression Lugs Revenue Market Share, 2020-2032
Figure 16. Segment by Application – Global Compression Lugs Sales Market Share, 2020-2032
Figure 17. Segment by Application -Global Compression Lugs Price (US$/Unit), 2020-2032
Figure 18. By Region – Global Compression Lugs Revenue, (US$, Mn), 2025 & 2032
Figure 19. By Region – Global Compression Lugs Revenue Market Share, 2020 VS 2024 VS 2032
Figure 20. By Region – Global Compression Lugs Revenue Market Share, 2020-2032
Figure 21. By Region – Global Compression Lugs Sales Market Share, 2020-2032
Figure 22. By Country – North America Compression Lugs Revenue Market Share, 2020-2032
Figure 23. By Country – North America Compression Lugs Sales Market Share, 2020-2032
Figure 24. United States Compression Lugs Revenue, (US$, Mn), 2020-2032
Figure 25. Canada Compression Lugs Revenue, (US$, Mn), 2020-2032
Figure 26. Mexico Compression Lugs Revenue, (US$, Mn), 2020-2032
Figure 27. By Country – Europe Compression Lugs Revenue Market Share, 2020-2032
Figure 28. By Country – Europe Compression Lugs Sales Market Share, 2020-2032
Figure 29. Germany Compression Lugs Revenue, (US$, Mn), 2020-2032
Figure 30. France Compression Lugs Revenue, (US$, Mn), 2020-2032
Figure 31. U.K. Compression Lugs Revenue, (US$, Mn), 2020-2032
Figure 32. Italy Compression Lugs Revenue, (US$, Mn), 2020-2032
Figure 33. Russia Compression Lugs Revenue, (US$, Mn), 2020-2032
Figure 34. Nordic Countries Compression Lugs Revenue, (US$, Mn), 2020-2032
Figure 35. Benelux Compression Lugs Revenue, (US$, Mn), 2020-2032
Figure 36. By Region – Asia Compression Lugs Revenue Market Share, 2020-2032
Figure 37. By Region – Asia Compression Lugs Sales Market Share, 2020-2032
Figure 38. China Compression Lugs Revenue, (US$, Mn), 2020-2032
Figure 39. Japan Compression Lugs Revenue, (US$, Mn), 2020-2032
Figure 40. South Korea Compression Lugs Revenue, (US$, Mn), 2020-2032
Figure 41. Southeast Asia Compression Lugs Revenue, (US$, Mn), 2020-2032
Figure 42. India Compression Lugs Revenue, (US$, Mn), 2020-2032
Figure 43. By Country – South America Compression Lugs Revenue Market Share, 2020-2032
Figure 44. By Country – South America Compression Lugs Sales, Market Share, 2020-2032
Figure 45. Brazil Compression Lugs Revenue, (US$, Mn), 2020-2032
Figure 46. Argentina Compression Lugs Revenue, (US$, Mn), 2020-2032
Figure 47. By Country – Middle East & Africa Compression Lugs Revenue, Market Share, 2020-2032
Figure 48. By Country – Middle East & Africa Compression Lugs Sales, Market Share, 2020-2032
Figure 49. Turkey Compression Lugs Revenue, (US$, Mn), 2020-2032
Figure 50. Israel Compression Lugs Revenue, (US$, Mn), 2020-2032
Figure 51. Saudi Arabia Compression Lugs Revenue, (US$, Mn), 2020-2032
Figure 52. UAE Compression Lugs Revenue, (US$, Mn), 2020-2032
Figure 53. Global Compression Lugs Production Capacity (Units), 2020-2032
Figure 54. The Percentage of Production Compression Lugs by Region, 2024 VS 2032
Figure 55. Compression Lugs Industry Value Chain
Figure 56. Marketing Channels