Chip On Flex (COF) Market, Global Business Strategies 2026-2034

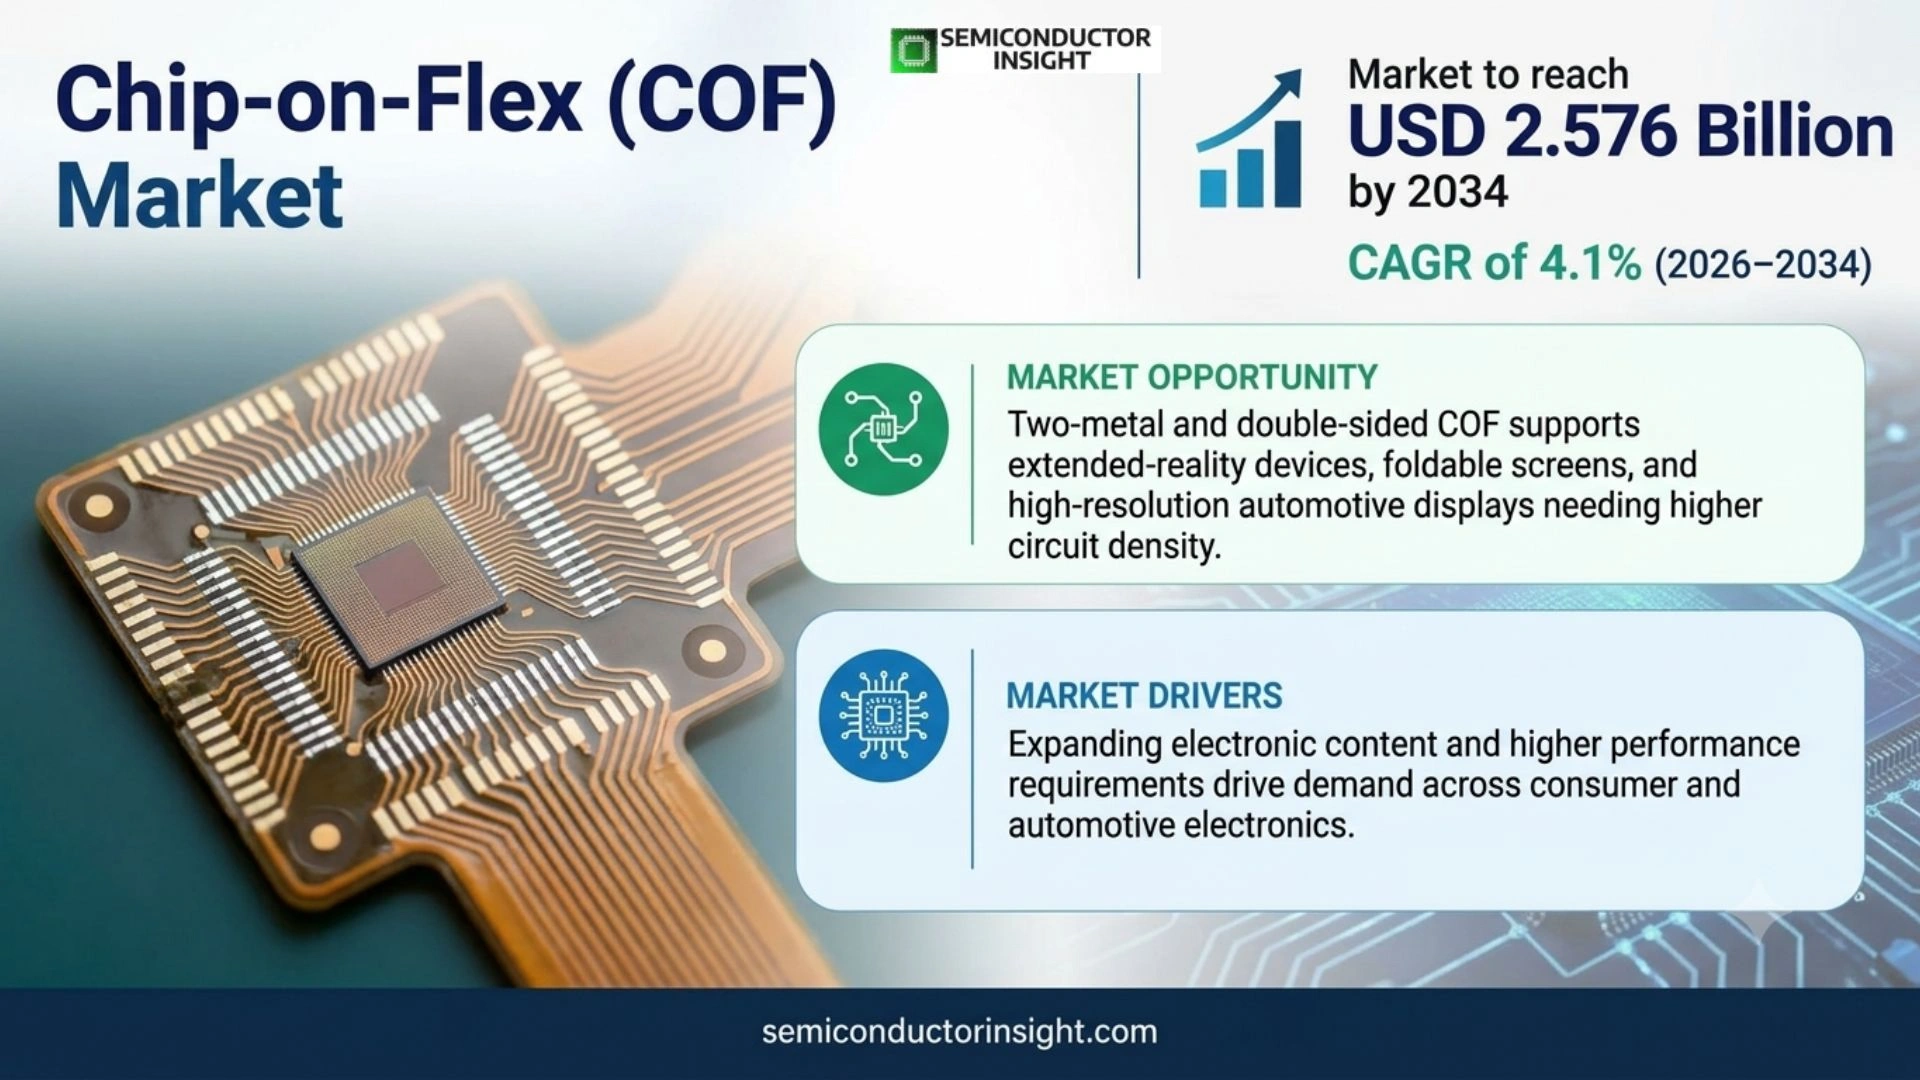
Chip-on-Flex (COF) Market was valued at USD 1.787 billion in 2025 and is projected to reach USD 2.576 billion by 2034, growing at a CAGR of 4.1% during 2026–2034. Asia Pacific held the largest regional position in 2025, supported by concentrated manufacturing, downstream electronics production and established component supply networks.

PDF Icon Download Sample Report PDF
  • Quick Dispatch

    All Orders

  • Secure Payment

    100% Secure Payment

Price range: $1,500.00 through $4,250.00

Clear

Key Statistics

2025 Market Size
USD 1.787 billion
2034 Projected Size
USD 2.576 billion
CAGR (2026–2034)
4.1%
Largest Market in 2025
Asia Pacific

Key Takeaways

  • The report’s 2024 and 2032 endpoints imply USD 1.787 billion in 2025 and USD 2.576 billion by 2034, representing an updated 4.1% CAGR during 2026–2034. The rebasing corrects the source page’s inconsistent stated rate.
  • Single-sided COF remains the largest type because mature reel-to-reel processing meets mainstream display-driver requirements at competitive cost, while double-sided or 2-metal formats address denser routing.
  • Electronics is the largest application through televisions, monitors, notebooks, tablets, smartphones, wearables, and display modules; automotive and specialized flexible assemblies offer qualification-led growth.
  • Asia Pacific dominates because South Koreav, Japan, Taiwan, and China concentrate panels, driver IC packaging, tape substrates, flexible circuits, and final device assembly.
  • Fine-line yield is the decisive operating metric. Conductive defects, warpage, contamination, or bonding errors can cause expensive downstream panel scrap, making inspection, traceability, and rapid failure analysis central to competitiveness.

Chip-on-Flex (COF) Market Overview

Chip-on-Flex (COF) Market was valued at USD 1.787 billion in 2025 and is projected to reach USD 2.576 billion by 2034, growing at a CAGR of 4.1% during 2026–2034. Asia Pacific held the largest regional position in 2025, supported by concentrated manufacturing, downstream electronics production and established component supply networks.

Base year: 2025 · Forecast period: 2026–2034 · Historical data: 2021–2025 · Values in USD; volumes reported where disclosed

Chip-on-Flex mounts and electrically connects a semiconductor die directly to a flexible circuit substrate, shortening the interconnect between the integrated circuit and the host assembly. In display applications, a driver IC on a tape-like substrate links the panel with the printed circuit board while allowing narrow bezels, folding, and compact mechanical routing. Commercial value depends on fine-line capability, bumping, bonding accuracy, substrate quality, electrical test, yield, and customer-specific qualification.

The report page provides a 2024 base and a 2032 terminal value. Those anchors imply compound annual growth of approximately four and one-tenth percent rather than the separately stated rate. Applying the endpoint-implied relationship produces a consistent 2025 base and 2034 endpoint for this overview. This method preserves the published trajectory, corrects the internal inconsistency, and extends the values to the requested horizon without importing another publisher’s forecast.

COF demand is closely tied to displays for televisions, monitors, notebooks, tablets, smartphones, wearables, automotive cockpits, and emerging foldable or extended-reality devices. The addressable market also includes specialized medical, aerospace, and military flexible assemblies. Revenue does not move only with device shipments: higher resolution, narrower bezels, additional driver channels, dual-sided routing, substrate dimensions, metallization, test complexity, and yield all influence value per unit and supplier economics.

Segment Analysis: By Type

By type, the Chip-on-Flex (COF) market is segmented into Single-Sided COF · Double-Sided COF · Other COF Configurations. Each category represents a different degree of integration, qualification burden and value capture, so suppliers compete through a combination of material performance, design support, manufacturing consistency, package architecture and application-specific testing rather than through unit price alone. Procurement also reflects lifecycle support, interoperability, compliance evidence, warranty exposure, and the cost of unsuccessful qualification.

Type Market relevance
Single-Sided COF Distinct performance, condition, integration, and qualification requirements shape demand and supplier positioning.
Double-Sided COF Distinct performance, condition, integration, and qualification requirements shape demand and supplier positioning.
Other COF Configurations Distinct performance, condition, integration, and qualification requirements shape demand and supplier positioning.

Segment Analysis: By Application

By application, the market covers Electronics · Medical · Aerospace · Military · Other Applications. Demand varies by production volume and qualification intensity: consumer programmes reward scale and miniaturisation, while automotive, industrial, aerospace, medical or security designs place greater weight on reliability evidence, long product availability and system-level performance under demanding operating conditions. Channel design, documentation, service coverage, and total ownership economics further determine which application converts technical interest into repeat purchasing.

Application Market relevance
Electronics Purchasing criteria reflect use-case economics, technical requirements, warranty expectations, and channel support.
Medical Purchasing criteria reflect use-case economics, technical requirements, warranty expectations, and channel support.
Aerospace Purchasing criteria reflect use-case economics, technical requirements, warranty expectations, and channel support.
Military Purchasing criteria reflect use-case economics, technical requirements, warranty expectations, and channel support.
Other Applications Purchasing criteria reflect use-case economics, technical requirements, warranty expectations, and channel support.

Chip-on-Flex (COF) Prizing

Regional Analysis

Asia Pacific is the largest regional market for Chip-on-Flex (COF) products, combining an established component-production ecosystem with major downstream customers. North America and Europe are strategically important for premium, automotive, aerospace, industrial and specialised applications, while South America and Middle East & Africa are primarily import- and project-led markets where distributor reach, local support and supply continuity shape vendor selection.

How does regional demand differ across this market?

For Chip-on-Flex (COF), Asia Pacific holds the largest position, supported by an established customer base, supplier presence, and mature purchasing channels. Europe contributes regulation, industrial demand, and technical expertise, while Asia Pacific combines electronics manufacturing, large device populations, and expanding engineering capability. South America and the Middle East and Africa develop through targeted infrastructure, enterprise, research, consumer, or public-sector programs rather than uniform adoption.

Region Position
Asia Pacific Largest and most established demand base
North America Developing demand shaped by local applications, channels, and qualification conditions
Europe Developing demand shaped by local applications, channels, and qualification conditions
South America Developing demand shaped by local applications, channels, and qualification conditions
Middle East & Africa Developing demand shaped by local applications, channels, and qualification conditions
Asia Pacific LARGEST & FASTEST-GROWING

Why is Asia Pacific strategically important?

Asia Pacific demand for Chip-on-Flex (COF) reflects its mix of research, industrial, consumer, enterprise, infrastructure, and technology investment. Commercial outcomes depend on local procurement, technical or quality qualification, channel trust, service coverage, and total ownership economics. The region is assessed separately because adoption conditions and routes to market differ materially across countries, even when the underlying product or measurement need is similar.

Market positionLargest region
Growth outlookAbove market average
Demand profileProduction and demand hub
Market access gateScale and local qualification
Indicator Assessment
Demand base Application- and program-led
Supplier access Direct sales, partners, distributors, or marketplaces
Decision criteria Performance, quality, compliance, price, and support

Market instances

  • Official and industry evidence for Asia Pacific shows that adoption is tied to documented performance, repair or measurement capability, and dependable after-sales support. The report therefore evaluates concrete programs, regulatory signals, supplier activity, channel maturity, and customer requirements rather than treating population or headline technology spending as a direct proxy for market revenue. Source Source
  • 2025–2026 commercial signal. Asia Pacific demand is governed by the same application and qualification conditions described above, but purchasing decisions are made through local OEM programmes, distributors and technical approvals. Suppliers that document electrical performance, reliability and continuity of supply can convert a regional deployment into repeat orders; vendors relying only on headline pricing face a slower qualification path.
  • 2026–2034 execution issue. Growth in Asia Pacific will depend on whether suppliers align manufacturing, field engineering and inventory with the region’s downstream customers. The practical opportunity is not uniform across every country: it concentrates where device assembly, telecom investment, vehicle production, industrial automation or security deployment creates a repeatable design-in pipeline backed by local technical support.
In the full report: country-level market size, sales volume, pricing, application mix and CAGR for every market listed above across 2021–2034.
North America HIGH-VALUE SPECIALTY

Why is North America strategically important?

North America demand for Chip-on-Flex (COF) reflects its mix of research, industrial, consumer, enterprise, infrastructure, and technology investment. Commercial outcomes depend on local procurement, technical or quality qualification, channel trust, service coverage, and total ownership economics. The region is assessed separately because adoption conditions and routes to market differ materially across countries, even when the underlying product or measurement need is similar.

Market positionHigh-value market
Growth outlookModerate
Demand profileSpecialty demand
Market access gateReliability and long-term support
Indicator Assessment
Demand base Application- and program-led
Supplier access Direct sales, partners, distributors, or marketplaces
Decision criteria Performance, quality, compliance, price, and support

Market instances

  • Official and industry evidence for North America shows that adoption is tied to documented performance, repair or measurement capability, and dependable after-sales support. The report therefore evaluates concrete programs, regulatory signals, supplier activity, channel maturity, and customer requirements rather than treating population or headline technology spending as a direct proxy for market revenue. Source Source
  • 2025–2026 commercial signal. North America demand is governed by the same application and qualification conditions described above, but purchasing decisions are made through local OEM programmes, distributors and technical approvals. Suppliers that document electrical performance, reliability and continuity of supply can convert a regional deployment into repeat orders; vendors relying only on headline pricing face a slower qualification path.
  • 2026–2034 execution issue. Growth in North America will depend on whether suppliers align manufacturing, field engineering and inventory with the region’s downstream customers. The practical opportunity is not uniform across every country: it concentrates where device assembly, telecom investment, vehicle production, industrial automation or security deployment creates a repeatable design-in pipeline backed by local technical support.
In the full report: country-level market size, sales volume, pricing, application mix and CAGR for every market listed above across 2021–2034.
Europe AUTOMOTIVE & INDUSTRIAL

Why is Europe strategically important?

Europe demand for Chip-on-Flex (COF) reflects its mix of research, industrial, consumer, enterprise, infrastructure, and technology investment. Commercial outcomes depend on local procurement, technical or quality qualification, channel trust, service coverage, and total ownership economics. The region is assessed separately because adoption conditions and routes to market differ materially across countries, even when the underlying product or measurement need is similar.

Market positionEstablished market
Growth outlookSteady
Demand profileQualification led
Market access gateAutomotive or industrial approval
Indicator Assessment
Demand base Application- and program-led
Supplier access Direct sales, partners, distributors, or marketplaces
Decision criteria Performance, quality, compliance, price, and support

Market instances

  • Official and industry evidence for Europe shows that adoption is tied to documented performance, repair or measurement capability, and dependable after-sales support. The report therefore evaluates concrete programs, regulatory signals, supplier activity, channel maturity, and customer requirements rather than treating population or headline technology spending as a direct proxy for market revenue. Source Source
  • 2025–2026 commercial signal. Europe demand is governed by the same application and qualification conditions described above, but purchasing decisions are made through local OEM programmes, distributors and technical approvals. Suppliers that document electrical performance, reliability and continuity of supply can convert a regional deployment into repeat orders; vendors relying only on headline pricing face a slower qualification path.
  • 2026–2034 execution issue. Growth in Europe will depend on whether suppliers align manufacturing, field engineering and inventory with the region’s downstream customers. The practical opportunity is not uniform across every country: it concentrates where device assembly, telecom investment, vehicle production, industrial automation or security deployment creates a repeatable design-in pipeline backed by local technical support.
In the full report: country-level market size, sales volume, pricing, application mix and CAGR for every market listed above across 2021–2034.
South America IMPORT-LED

Why is South America strategically important?

South America demand for Chip-on-Flex (COF) reflects its mix of research, industrial, consumer, enterprise, infrastructure, and technology investment. Commercial outcomes depend on local procurement, technical or quality qualification, channel trust, service coverage, and total ownership economics. The region is assessed separately because adoption conditions and routes to market differ materially across countries, even when the underlying product or measurement need is similar.

Market positionEmerging market
Growth outlookSelective growth
Demand profileImport dependent
Market access gateLanded cost and distribution
Indicator Assessment
Demand base Application- and program-led
Supplier access Direct sales, partners, distributors, or marketplaces
Decision criteria Performance, quality, compliance, price, and support

Market instances

  • Official and industry evidence for South America shows that adoption is tied to documented performance, repair or measurement capability, and dependable after-sales support. The report therefore evaluates concrete programs, regulatory signals, supplier activity, channel maturity, and customer requirements rather than treating population or headline technology spending as a direct proxy for market revenue. Source Source
  • 2025–2026 commercial signal. South America demand is governed by the same application and qualification conditions described above, but purchasing decisions are made through local OEM programmes, distributors and technical approvals. Suppliers that document electrical performance, reliability and continuity of supply can convert a regional deployment into repeat orders; vendors relying only on headline pricing face a slower qualification path.
  • 2026–2034 execution issue. Growth in South America will depend on whether suppliers align manufacturing, field engineering and inventory with the region’s downstream customers. The practical opportunity is not uniform across every country: it concentrates where device assembly, telecom investment, vehicle production, industrial automation or security deployment creates a repeatable design-in pipeline backed by local technical support.
In the full report: country-level market size, sales volume, pricing, application mix and CAGR for every market listed above across 2021–2034.
Middle East & Africa

Why is Middle East & Africa strategically important?

Middle East & Africa demand for Chip-on-Flex (COF) reflects its mix of research, industrial, consumer, enterprise, infrastructure, and technology investment. Commercial outcomes depend on local procurement, technical or quality qualification, channel trust, service coverage, and total ownership economics. The region is assessed separately because adoption conditions and routes to market differ materially across countries, even when the underlying product or measurement need is similar.

Market positionDeveloping market
Growth outlookInfrastructure-led
Demand profileProject dependent
Market access gateProject access and logistics
Indicator Assessment
Demand base Application- and program-led
Supplier access Direct sales, partners, distributors, or marketplaces
Decision criteria Performance, quality, compliance, price, and support

Market instances

  • Official and industry evidence for Middle East & Africa shows that adoption is tied to documented performance, repair or measurement capability, and dependable after-sales support. The report therefore evaluates concrete programs, regulatory signals, supplier activity, channel maturity, and customer requirements rather than treating population or headline technology spending as a direct proxy for market revenue. Source Source
  • 2025–2026 commercial signal. Middle East & Africa demand is governed by the same application and qualification conditions described above, but purchasing decisions are made through local OEM programmes, distributors and technical approvals. Suppliers that document electrical performance, reliability and continuity of supply can convert a regional deployment into repeat orders; vendors relying only on headline pricing face a slower qualification path.
  • 2026–2034 execution issue. Growth in Middle East & Africa will depend on whether suppliers align manufacturing, field engineering and inventory with the region’s downstream customers. The practical opportunity is not uniform across every country: it concentrates where device assembly, telecom investment, vehicle production, industrial automation or security deployment creates a repeatable design-in pipeline backed by local technical support.
In the full report: country-level market size, sales volume, pricing, application mix and CAGR for every market listed above across 2021–2034.

Key Chip-on-Flex (COF) Manufacturers and Competitive Landscape

The Chip-on-Flex (COF) competitive landscape includes global technology leaders, diversified semiconductor or component groups, RF and imaging specialists, and regional manufacturers. The report profiles every named company across product positioning, manufacturing footprint, application exposure, recent development activity and strategic strengths; the complete coverage list is reproduced below so the intended company universe is explicit.

The competitive landscape includes tape-substrate manufacturers, flexible-circuit specialists, display-driver packaging providers, and outsourced semiconductor assembly companies. LG Innotek, STEMCO, Flexceed, Chipbond Technology, CWE, Danbond Technology, AKM Industrial, Compass Technology, Compunetics, and STARS Microelectronics represent the report’s company universe. Participants differ in whether they supply bare COF tape, bumped and bonded driver assemblies, specialized flex circuits, testing, or broader manufacturing services, so capacity comparisons require a consistent product boundary.

Competition centers on conductor pitch, line and space control, alignment accuracy, substrate thickness, two-sided routing, via formation, warpage, adhesion, electrical yield, reel handling, inspection, and long-term reliability. Display customers also value high-volume continuity, rapid engineering changes, localized support, and the ability to qualify new driver ICs or panel architectures without disrupting launch schedules. Scale matters, but a lower quoted price cannot compensate for panel scrap, bonding instability, or field failures caused by marginal substrate performance.

Key companies profiled

  • LG Innotek
  • STEMCO
  • Flexceed
  • Chipbond Technology
  • CWE
  • Danbond Technology
  • AKM Industrial Co., Ltd.
  • Compass Technology Company
  • Compunetics, Inc.
  • STARS Microelectronics

Chip-on-Flex (COF) Production Capacity Analysis

Production capacity is a material competitive factor in the Chip-on-Flex (COF) market because electrical performance depends on specialised processes, qualified materials, repeatable yields and application-specific test capability. Capacity cannot be assessed only by nominal factory floor area: effective supply is the output that passes dimensional, electrical, reliability and customer qualification requirements at the required product mix.

COF capacity is measured in qualified tape area, reels, units, or bonded driver assemblies that meet a customer’s design rules and defect limits. Production involves polyimide or alternative films, copper formation, photoimaging, etching or additive patterning, surface finishing, solder masks or protective coatings, precision punching, inspection, inner-lead bonding, anisotropic conductive film attachment, and electrical test. The usable output is lower than installed equipment capacity whenever fine-line yield, material defects, or bonding alignment become the limiting step.

Higher-resolution and narrow-bezel displays push conductor density and dimensional tolerance. Double-sided or 2-metal COF adds vias and interlayer registration while improving routing flexibility, heat distribution, and electromagnetic performance. These benefits increase process steps and yield sensitivity. Capacity expansion therefore requires clean processing, high-resolution imaging, plating control, automated optical inspection, laser drilling where used, accurate reel-to-reel handling, and statistical process control tied to each substrate material and customer design.

Qualification capacity is commercially important because a new driver IC, panel, adhesive, film, or production site can require electrical, mechanical, humidity, thermal-cycle, bending, and long-duration reliability tests. Suppliers with dedicated pilot lines and engineering support can shorten launches without disturbing high-volume output. Effective capacity also includes bumping, test, and downstream bonding partners, since an imbalance between bare tape production and chip-attachment capability can delay finished COF deliveries even when substrate inventory is available.

Chip-on-Flex (COF) Market Dynamics: Drivers, Restraints and Opportunities

Chip-on-Flex (COF) market growth reflects expanding electronic content and higher performance requirements, moderated by manufacturing complexity, long qualification cycles and competing technologies. The impact ranges below are directional analytical estimates rather than additive forecasts; they show the relative pressure each factor can place on the baseline CAGR when other assumptions remain broadly stable.

Market growth reflects continuing demand for high-resolution displays, narrow borders, thinner devices, foldable form factors, and efficient high-density connections between driver ICs and panels. Asia Pacific dominates because it concentrates panel fabrication, semiconductor packaging, tape-substrate production, and final electronics assembly. The market remains cyclical, however, because television, monitor, smartphone, and notebook inventories can change rapidly, while a small number of panel makers and driver-IC programs account for substantial procurement volume.

The outlook balances rising interconnect density against display-sector price pressure and alternative packaging routes. COF is attractive where the flexible substrate can fold behind a panel and reduce bezel width, but chip-on-glass, flexible printed circuits with packaged ICs, and other integration methods remain viable in selected designs. Customers continually pressure substrate and packaging suppliers to reduce cost while improving pitch, thermal behavior, reliability, and delivery, creating a demanding yield-management environment.

MARKET DRIVERS

Drivers Impact Analysis*

Driver (~) % impact on CAGR forecast Geographic relevance Impact timeline
Higher-resolution and narrow-bezel display architectures +1.0% Asia Pacific and global device brands Medium term (2–4 years)
OLED, foldable and rollable display adoption +0.8% South Korea, China, Japan, North America Long term (≥4 years)
Automotive cockpit and information displays +0.7% Europe, China, Japan, North America Long term (≥4 years)
Two-metal routing for extended-reality devices +0.5% South Korea, Japan, China, North America Medium term (2–4 years)
Miniaturized medical and specialized flexible electronics +0.4% North America, Europe, developed Asia Medium term (2–4 years)
Advanced reel-to-reel inspection and process control +0.3% Major Asian production clusters Short term (≤2 years)

Higher display resolution increases the number and speed of signals that must travel from display-driver ICs to the panel. COF provides short interconnects and fine-pitch routing in a thin, flexible format, supporting television, monitor, notebook, tablet, smartphone, and wearable architectures. The demand mechanism is strongest when panel makers also pursue narrow borders or folded packaging, because the tape can route the driver connection behind the active display area more efficiently than a rigid assembly.

OLED, foldable, rollable, and advanced automotive displays create additional design complexity. These products reward thin substrates, bending capability, high conductor density, low electromagnetic interference, heat management, and reliable attachment under repeated mechanical or environmental stress. Double-sided COF can provide more routing area in a similar footprint. Commercial capture depends on early collaboration among the panel maker, driver-IC supplier, tape manufacturer, bonding-material provider, and module assembler.

Miniaturization in medical, aerospace, defense, sensors, and specialized electronics expands the non-display opportunity. Direct die attachment to flex can reduce connectors, cable mass, and interconnect length while fitting curved or space-constrained assemblies. These applications usually have lower volume than consumer displays but can offer higher value per program. Suppliers must demonstrate controlled impedance, material traceability, thermal performance, harsh-environment reliability, and long-term configuration control to win and retain qualified designs.

MARKET RESTRAINTS

Restraints Impact Analysis*

Restraint (~) % impact on CAGR forecast Geographic relevance Impact timeline
Display inventory and panel-price cyclicality −1.1% Global consumer electronics Short term (≤2 years)
Fine-line yield and bonding-defect exposure −0.8% All manufacturing regions Persistent
Concentrated films, chemicals and packaging capacity −0.5% Asia-linked supply chains Medium term (2–4 years)
Customer-specific qualification and switching cost −0.4% Global panel and automotive programs Long term (≥4 years)
Alternative display-driver packaging approaches −0.3% Application-specific global designs Medium term (2–4 years)

Display cyclicality is the principal commercial restraint. Television, monitor, notebook, and smartphone customers can correct inventory quickly when retail demand weakens, causing abrupt changes in COF orders and factory utilization. Suppliers carry specialized equipment and customer-specific materials that cannot always be redirected. Flexible production planning, diversified end markets, conservative inventory, and early visibility into panel-maker schedules are essential, but they cannot eliminate the bargaining power of large downstream buyers.

Fine-line yield and bonding defects can erase margins. Opens, shorts, uneven copper, particles, via defects, warpage, surface contamination, poor adhesion, or alignment errors may be discovered only after expensive driver ICs or panels are involved. As pitch shrinks, process windows narrow and inspection requirements increase. Manufacturers need traceable reels, automated optical and electrical testing, disciplined material handling, and rapid root-cause analysis because a low defect rate can still create significant downstream scrap at high production volume.

Material and geographic concentration create supply risk. High-quality polyimide films, copper foils, photoresists, surface finishes, anisotropic conductive films, driver IC bumping, and advanced panel production are concentrated among limited suppliers and regions. Substitution is difficult because film dimensions, copper properties, adhesion, surface treatment, and bonding behavior interact. A nominal alternate source must pass customer qualification, so resilience requires prequalified materials, safety inventory, equipment redundancy, and transparent change-notification procedures.

MARKET OPPORTUNITIES

Two-metal and double-sided COF provides an opportunity to support extended-reality devices, foldable screens, high-resolution automotive displays, and other products needing greater circuit density in a limited footprint. Routing on both sides can improve design freedom, electromagnetic behavior, and heat spreading, but only if microvias and registration are stable at volume. Suppliers that combine material processing, micro-patterning, via formation, inspection, and customer co-design can earn premium positions before the architecture becomes standardized.

Automotive display growth creates a longer-lifecycle opportunity. Digital clusters, center displays, passenger screens, mirrors, and head-up systems increase panel area and driver content, while vehicles require temperature, vibration, humidity, and long-service reliability. COF suppliers can differentiate through automotive quality systems, production-change discipline, failure analysis, and multi-year availability. The opportunity is slower to qualify than consumer electronics but may provide greater program visibility and more defensible supplier relationships once approved.

Advanced flex integration beyond displays can expand the addressable market. Medical probes, imaging systems, sensors, aerospace modules, and defense electronics value reduced weight, compact routing, and direct die attachment. Suppliers can capture additional value by offering design-for-manufacture support, controlled-impedance flex, microvias, thermal paths, assembly, encapsulation, and testing as one qualified service. Regional engineering and prototype capability can help customers move from low-volume validation to repeat production without changing the fundamental stack.

Chip-on-Flex (COF) Supply Chain Analysis

The Chip-on-Flex (COF) supply chain links specialty materials and wafer or ceramic processing equipment to high-precision manufacturing, packaging, distribution and downstream system integration. Commercial resilience depends on qualified alternate materials, realistic yield assumptions, geographic redundancy and traceable process controls because a nominal second source is not interchangeable until the customer has validated electrical behaviour, reliability and package compatibility.

MaterialsPolyimide or polyester film, copper, plating chemicals, photoresists, etchants, coatings, finishes, adhesives and reel materials.
Tape FabricationFine-line imaging, copper patterning, via creation, surface finishing, protection, punching, reel handling and automated inspection.
Chip AttachmentDriver-IC bumping, inner-lead bonding, anisotropic conductive film processing, encapsulation, electrical test and reliability qualification.
Module IntegrationDisplay panels, printed circuit boards, smartphones, televisions, notebooks, automotive displays, medical devices and specialized systems.

The supply chain begins with polyimide or polyester films, copper foil and plating chemicals, photoresists, etchants, adhesives, protective coatings, surface finishes, carrier and reel materials, anisotropic conductive films, bumping materials, and semiconductor dies. Tape and flexible-circuit manufacturers form fine conductors and vias, package or OSAT partners bump and bond driver ICs, and module assemblers attach COF to display panels and printed circuit boards before final equipment integration and test.

Supply continuity depends on synchronized specifications across the chain. A change in film shrinkage, copper roughness, plating thickness, surface chemistry, adhesive cure, bump metallurgy, or bonding profile can affect alignment and reliability. Strong programs maintain approved material lists, lot traceability, shared change control, statistical process data, and failure-analysis responsibility. Geographic redundancy is valuable only when each site and upstream material source has passed the same panel-maker qualification and can reproduce the required yield.

Recent Developments in the Chip-on-Flex (COF) Market

Developments tracked to September 2026 and linked to official company or industry sources.

  • November 2025 Published
    STARS Microelectronics participated in SEMICON Europa 2025, presenting its OSAT and advanced electronics-manufacturing capabilities to European semiconductor customers and partners. Source
  • November 2025 Published
    The Semiconductor Industry Association reported third-quarter 2025 global semiconductor sales of USD 208.4 billion, up 15.8% sequentially, indicating stronger activity across the broader chip ecosystem that supports advanced packaging investment. Source
  • January 2025 Published
    LG Innotek reported that recovery in display-product demand, including COF, remained delayed amid weak television conditions, illustrating the inventory and utilization sensitivity of tape-substrate suppliers. Source
  • September 2025 Published
    LG Innotek outlined its next-generation substrate roadmap and highlighted continuing development in package and tape-substrate technologies requiring advanced material processing and precision manufacturing. Source
  • August 2025 Published
    LG Display presented next-generation OLED technologies at K-Display 2025, reinforcing downstream demand for increasingly sophisticated panel architectures, compact module integration, and high-density driver connections. Source

REPORT SCOPE & SEGMENTATION

Attribute Details
Study Period 2021–2034
Base Year 2025
Estimated Year 2026
Forecast Period 2026–2034
Historical Period 2021–2025
Market Size 2025 USD 1.787 billion
Market Size 2034 USD 2.576 billion
Growth Rate CAGR of 4.1% from 2026–2034
Unit Value in USD billion and shipment or production volume where disclosed
Segmentation By Type, By Application, additional technology axis and By Region
By Type Single-Sided COF · Double-Sided COF · Other COF Configurations
By Application Electronics · Medical · Aerospace · Military · Other Applications
By Substrate Material and Bonding Technology Polyimide · Polyester · Other Films · Anisotropic Conductive Film Bonding · Non-Conductive Adhesive Bonding · Other Bonding Methods
By Region Each region analysed by type, application and countryNorth AmericaU.S., Canada, MexicoEuropeGermany, France, U.K., Italy, Nordic Countries, BeneluxAsia PacificChina, Japan, South Korea, India, Southeast AsiaSouth AmericaBrazil, Argentina, Rest of South AmericaMiddle East & AfricaTurkey, Israel, Saudi Arabia, UAE, Rest of MEA
Key Companies Profiled LG Innotek; STEMCO; Flexceed; Chipbond Technology; CWE; Danbond Technology; AKM Industrial Co., Ltd.; Compass Technology Company; Compunetics, Inc.; STARS Microelectronics
Customization Scope Free report customization equivalent to up to four analyst working days with purchase, including additions or alterations to country, regional and segment coverage.

Frequently Asked Questions

What is Chip-on-Flex technology?

The Chip-on-Flex (COF) Market is valued at USD 1.787 billion in 2025 and is projected to reach USD 2.576 billion by 2034, representing a 4.1% CAGR during 2026–2034. The estimate covers the complete stated product, application, technology and regional scope, and the 2034 endpoint was extended from the report’s published anchors using the endpoint-implied compound annual relationship rather than an unrelated third-party forecast.

How was the 2025–2034 forecast calculated?

The 2034 Chip-on-Flex (COF) projection extends the report’s published endpoint relationship through the requested horizon. It should be interpreted as a constant-rate rebasing scenario: actual annual results can vary with device production, qualification timing, technology substitution, pricing and regional investment, but the method keeps the terminal value mathematically consistent with the validated source anchors and the forecast period used throughout this overview.

Which COF type has the largest share?

Single-sided COF is the largest type because it offers mature reel-to-reel production, adequate routing for many display-driver connections, and lower cost than more complex two-sided structures. Double-sided or 2-metal COF is attractive when extended-reality, foldable, narrow-bezel, or high-resolution devices need greater routing density, improved electromagnetic behavior, or thermal advantages. Other configurations serve specialized packaging and flexible-electronics requirements.

Which application leads demand?

Electronics leads demand through televisions, monitors, notebooks, tablets, smartphones, wearables, and display modules. Medical, aerospace, and military applications represent smaller but technically demanding opportunities where low weight, compact geometry, and direct die attachment can create system value. Application economics depend on conductor pitch, substrate area, driver complexity, qualification, reliability, and production volume rather than only the number of finished devices shipped.

Why does Asia Pacific dominate?

Asia Pacific concentrates display-panel fabrication, display-driver IC packaging, tape-substrate production, flexible-circuit manufacturing, and electronics assembly in South Korea, Japan, Taiwan, and China. This co-location supports faster engineering changes and high-volume delivery. The report page attributes more than 60% of 2024 volume to the region. North America and Europe remain important for device design, specialized flex applications, equipment, materials, automotive programs, aerospace, and medical engineering.

What drives COF market growth?

Growth comes from higher display resolution, narrower borders, larger and more numerous screens, OLED adoption, foldable devices, automotive cockpits, extended-reality hardware, and miniaturized specialized electronics. These designs require more signal routing in limited space and often benefit from a thin connection that folds behind the panel. Revenue growth also depends on value per unit as pitch, double-sided routing, testing, and qualification complexity increase.

What are the main market restraints?

Display inventory cycles, strong customer price pressure, fine-line yield risk, concentrated materials, qualification delays, and alternative packaging approaches restrain the market. A small defect rate can create costly downstream scrap after driver IC or panel attachment. Customer-specific designs also limit inventory flexibility. Suppliers mitigate risk through statistical process control, automated inspection, approved alternate materials, diversified applications, capacity discipline, and transparent change management.

How do suppliers compete?

Suppliers compete through line and space capability, conductor uniformity, substrate thickness, via quality, surface finish, registration, bonding yield, reliability, volume continuity, engineering support, and customer qualification history. Two-sided routing and advanced micro-patterning support premium designs. Panel makers also assess responsiveness, failure analysis, change notification, geographic support, and whether the supplier can coordinate effectively with driver-IC bumping, bonding-material, and module-assembly partners.

What opportunities are emerging?

Emerging opportunities include 2-metal COF for extended reality and foldable devices, automotive display modules, high-resolution OLED panels, and direct-die flexible assemblies for medical, aerospace, defense, and sensor applications. Suppliers can increase value through co-design, prototype services, controlled-impedance routing, assembly, encapsulation, testing, and automotive-grade change control. The most defensible programs combine advanced geometry with long qualification and dependable lifecycle support.

Which companies are covered?

The report covers LG Innotek, STEMCO, Flexceed, Chipbond Technology, CWE, Danbond Technology, AKM Industrial, Compass Technology Company, Compunetics, and STARS Microelectronics. Profiles examine COF or flexible-circuit capability, product type, fine-line and two-sided technology, packaging and test services, customer and application exposure, manufacturing footprint, quality systems, geographic presence, strategic positioning, and recent developments without assuming that every company serves an identical product boundary.

Chip On Flex (COF) Market, Global Business Strategies 2026-2034

Get Sample Report PDF for Exclusive Insights

Report Sample Includes

  • Table of Contents
  • List of Tables & Figures
  • Charts, Research Methodology, and more...

PDF Icon Download Sample Report PDF
SKU: 6b750ca69053
Category:

Download Sample Report

Table of Content

1 Introduction to Research & Analysis Reports
1.1 Chip On Flex (COF) Market Definition
1.2 Market Segments
1.2.1 Segment by Type
1.2.2 Segment by Application
1.3 Global Chip On Flex (COF) Market Overview
1.4 Features & Benefits of This Report
1.5 Methodology & Sources of Information
1.5.1 Research Methodology
1.5.2 Research Process
1.5.3 Base Year
1.5.4 Report Assumptions & Caveats
2 Global Chip On Flex (COF) Overall Market Size
2.1 Global Chip On Flex (COF) Market Size: 2024 VS 2032
2.2 Global Chip On Flex (COF) Market Size, Prospects & Forecasts: 2020-2032
2.3 Global Chip On Flex (COF) Sales: 2020-2032
3 Company Landscape
3.1 Top Chip On Flex (COF) Players in Global Market
3.2 Top Global Chip On Flex (COF) Companies Ranked by Revenue
3.3 Global Chip On Flex (COF) Revenue by Companies
3.4 Global Chip On Flex (COF) Sales by Companies
3.5 Global Chip On Flex (COF) Price by Manufacturer (2020-2025)
3.6 Top 3 and Top 5 Chip On Flex (COF) Companies in Global Market, by Revenue in 2024
3.7 Global Manufacturers Chip On Flex (COF) Product Type
3.8 Tier 1, Tier 2, and Tier 3 Chip On Flex (COF) Players in Global Market
3.8.1 List of Global Tier 1 Chip On Flex (COF) Companies
3.8.2 List of Global Tier 2 and Tier 3 Chip On Flex (COF) Companies
4 Sights by Product
4.1 Overview
4.1.1 Segment by Type – Global Chip On Flex (COF) Market Size Markets, 2024 & 2032
4.1.2 Single Sided COF
4.1.3 Others
4.2 Segment by Type – Global Chip On Flex (COF) Revenue & Forecasts
4.2.1 Segment by Type – Global Chip On Flex (COF) Revenue, 2020-2025
4.2.2 Segment by Type – Global Chip On Flex (COF) Revenue, 2026-2032
4.2.3 Segment by Type – Global Chip On Flex (COF) Revenue Market Share, 2020-2032
4.3 Segment by Type – Global Chip On Flex (COF) Sales & Forecasts
4.3.1 Segment by Type – Global Chip On Flex (COF) Sales, 2020-2025
4.3.2 Segment by Type – Global Chip On Flex (COF) Sales, 2026-2032
4.3.3 Segment by Type – Global Chip On Flex (COF) Sales Market Share, 2020-2032
4.4 Segment by Type – Global Chip On Flex (COF) Price (Manufacturers Selling Prices), 2020-2032
5 Sights by Application
5.1 Overview
5.1.1 Segment by Application – Global Chip On Flex (COF) Market Size, 2024 & 2032
5.1.2 Military
5.1.3 Medical
5.1.4 Aerospace
5.1.5 Electronics
5.1.6 Others
5.2 Segment by Application – Global Chip On Flex (COF) Revenue & Forecasts
5.2.1 Segment by Application – Global Chip On Flex (COF) Revenue, 2020-2025
5.2.2 Segment by Application – Global Chip On Flex (COF) Revenue, 2026-2032
5.2.3 Segment by Application – Global Chip On Flex (COF) Revenue Market Share, 2020-2032
5.3 Segment by Application – Global Chip On Flex (COF) Sales & Forecasts
5.3.1 Segment by Application – Global Chip On Flex (COF) Sales, 2020-2025
5.3.2 Segment by Application – Global Chip On Flex (COF) Sales, 2026-2032
5.3.3 Segment by Application – Global Chip On Flex (COF) Sales Market Share, 2020-2032
5.4 Segment by Application – Global Chip On Flex (COF) Price (Manufacturers Selling Prices), 2020-2032
6 Sights by Region
6.1 By Region – Global Chip On Flex (COF) Market Size, 2024 & 2032
6.2 By Region – Global Chip On Flex (COF) Revenue & Forecasts
6.2.1 By Region – Global Chip On Flex (COF) Revenue, 2020-2025
6.2.2 By Region – Global Chip On Flex (COF) Revenue, 2026-2032
6.2.3 By Region – Global Chip On Flex (COF) Revenue Market Share, 2020-2032
6.3 By Region – Global Chip On Flex (COF) Sales & Forecasts
6.3.1 By Region – Global Chip On Flex (COF) Sales, 2020-2025
6.3.2 By Region – Global Chip On Flex (COF) Sales, 2026-2032
6.3.3 By Region – Global Chip On Flex (COF) Sales Market Share, 2020-2032
6.4 North America
6.4.1 By Country – North America Chip On Flex (COF) Revenue, 2020-2032
6.4.2 By Country – North America Chip On Flex (COF) Sales, 2020-2032
6.4.3 United States Chip On Flex (COF) Market Size, 2020-2032
6.4.4 Canada Chip On Flex (COF) Market Size, 2020-2032
6.4.5 Mexico Chip On Flex (COF) Market Size, 2020-2032
6.5 Europe
6.5.1 By Country – Europe Chip On Flex (COF) Revenue, 2020-2032
6.5.2 By Country – Europe Chip On Flex (COF) Sales, 2020-2032
6.5.3 Germany Chip On Flex (COF) Market Size, 2020-2032
6.5.4 France Chip On Flex (COF) Market Size, 2020-2032
6.5.5 U.K. Chip On Flex (COF) Market Size, 2020-2032
6.5.6 Italy Chip On Flex (COF) Market Size, 2020-2032
6.5.7 Russia Chip On Flex (COF) Market Size, 2020-2032
6.5.8 Nordic Countries Chip On Flex (COF) Market Size, 2020-2032
6.5.9 Benelux Chip On Flex (COF) Market Size, 2020-2032
6.6 Asia
6.6.1 By Region – Asia Chip On Flex (COF) Revenue, 2020-2032
6.6.2 By Region – Asia Chip On Flex (COF) Sales, 2020-2032
6.6.3 China Chip On Flex (COF) Market Size, 2020-2032
6.6.4 Japan Chip On Flex (COF) Market Size, 2020-2032
6.6.5 South Korea Chip On Flex (COF) Market Size, 2020-2032
6.6.6 Southeast Asia Chip On Flex (COF) Market Size, 2020-2032
6.6.7 India Chip On Flex (COF) Market Size, 2020-2032
6.7 South America
6.7.1 By Country – South America Chip On Flex (COF) Revenue, 2020-2032
6.7.2 By Country – South America Chip On Flex (COF) Sales, 2020-2032
6.7.3 Brazil Chip On Flex (COF) Market Size, 2020-2032
6.7.4 Argentina Chip On Flex (COF) Market Size, 2020-2032
6.8 Middle East & Africa
6.8.1 By Country – Middle East & Africa Chip On Flex (COF) Revenue, 2020-2032
6.8.2 By Country – Middle East & Africa Chip On Flex (COF) Sales, 2020-2032
6.8.3 Turkey Chip On Flex (COF) Market Size, 2020-2032
6.8.4 Israel Chip On Flex (COF) Market Size, 2020-2032
6.8.5 Saudi Arabia Chip On Flex (COF) Market Size, 2020-2032
6.8.6 UAE Chip On Flex (COF) Market Size, 2020-2032
7 Manufacturers & Brands Profiles
7.1 LGIT
7.1.1 LGIT Company Summary
7.1.2 LGIT Business Overview
7.1.3 LGIT Chip On Flex (COF) Major Product Offerings
7.1.4 LGIT Chip On Flex (COF) Sales and Revenue in Global (2020-2025)
7.1.5 LGIT Key News & Latest Developments
7.2 Stemco
7.2.1 Stemco Company Summary
7.2.2 Stemco Business Overview
7.2.3 Stemco Chip On Flex (COF) Major Product Offerings
7.2.4 Stemco Chip On Flex (COF) Sales and Revenue in Global (2020-2025)
7.2.5 Stemco Key News & Latest Developments
7.3 Flexceed
7.3.1 Flexceed Company Summary
7.3.2 Flexceed Business Overview
7.3.3 Flexceed Chip On Flex (COF) Major Product Offerings
7.3.4 Flexceed Chip On Flex (COF) Sales and Revenue in Global (2020-2025)
7.3.5 Flexceed Key News & Latest Developments
7.4 Chipbond Technology
7.4.1 Chipbond Technology Company Summary
7.4.2 Chipbond Technology Business Overview
7.4.3 Chipbond Technology Chip On Flex (COF) Major Product Offerings
7.4.4 Chipbond Technology Chip On Flex (COF) Sales and Revenue in Global (2020-2025)
7.4.5 Chipbond Technology Key News & Latest Developments
7.5 CWE
7.5.1 CWE Company Summary
7.5.2 CWE Business Overview
7.5.3 CWE Chip On Flex (COF) Major Product Offerings
7.5.4 CWE Chip On Flex (COF) Sales and Revenue in Global (2020-2025)
7.5.5 CWE Key News & Latest Developments
7.6 Danbond Technology
7.6.1 Danbond Technology Company Summary
7.6.2 Danbond Technology Business Overview
7.6.3 Danbond Technology Chip On Flex (COF) Major Product Offerings
7.6.4 Danbond Technology Chip On Flex (COF) Sales and Revenue in Global (2020-2025)
7.6.5 Danbond Technology Key News & Latest Developments
7.7 AKM Industrial
7.7.1 AKM Industrial Company Summary
7.7.2 AKM Industrial Business Overview
7.7.3 AKM Industrial Chip On Flex (COF) Major Product Offerings
7.7.4 AKM Industrial Chip On Flex (COF) Sales and Revenue in Global (2020-2025)
7.7.5 AKM Industrial Key News & Latest Developments
7.8 Compass Technology Company
7.8.1 Compass Technology Company Company Summary
7.8.2 Compass Technology Company Business Overview
7.8.3 Compass Technology Company Chip On Flex (COF) Major Product Offerings
7.8.4 Compass Technology Company Chip On Flex (COF) Sales and Revenue in Global (2020-2025)
7.8.5 Compass Technology Company Key News & Latest Developments
7.9 Compunetics
7.9.1 Compunetics Company Summary
7.9.2 Compunetics Business Overview
7.9.3 Compunetics Chip On Flex (COF) Major Product Offerings
7.9.4 Compunetics Chip On Flex (COF) Sales and Revenue in Global (2020-2025)
7.9.5 Compunetics Key News & Latest Developments
7.10 STARS Microelectronics
7.10.1 STARS Microelectronics Company Summary
7.10.2 STARS Microelectronics Business Overview
7.10.3 STARS Microelectronics Chip On Flex (COF) Major Product Offerings
7.10.4 STARS Microelectronics Chip On Flex (COF) Sales and Revenue in Global (2020-2025)
7.10.5 STARS Microelectronics Key News & Latest Developments
8 Global Chip On Flex (COF) Production Capacity, Analysis
8.1 Global Chip On Flex (COF) Production Capacity, 2020-2032
8.2 Chip On Flex (COF) Production Capacity of Key Manufacturers in Global Market
8.3 Global Chip On Flex (COF) Production by Region
9 Key Market Trends, Opportunity, Drivers and Restraints
9.1 Market Opportunities & Trends
9.2 Market Drivers
9.3 Market Restraints
10 Chip On Flex (COF) Supply Chain Analysis
10.1 Chip On Flex (COF) Industry Value Chain
10.2 Chip On Flex (COF) Upstream Market
10.3 Chip On Flex (COF) Downstream and Clients
10.4 Marketing Channels Analysis
10.4.1 Marketing Channels
10.4.2 Chip On Flex (COF) Distributors and Sales Agents in Global
11 Conclusion
12 Appendix
12.1 Note
12.2 Examples of Clients
12.3 DisclaimerList of Tables
Table 1. Key Players of Chip On Flex (COF) in Global Market
Table 2. Top Chip On Flex (COF) Players in Global Market, Ranking by Revenue (2024)
Table 3. Global Chip On Flex (COF) Revenue by Companies, (US$, Mn), 2020-2025
Table 4. Global Chip On Flex (COF) Revenue Share by Companies, 2020-2025
Table 5. Global Chip On Flex (COF) Sales by Companies, (K Units), 2020-2025
Table 6. Global Chip On Flex (COF) Sales Share by Companies, 2020-2025
Table 7. Key Manufacturers Chip On Flex (COF) Price (2020-2025) & (USD/Unit)
Table 8. Global Manufacturers Chip On Flex (COF) Product Type
Table 9. List of Global Tier 1 Chip On Flex (COF) Companies, Revenue (US$, Mn) in 2024 and Market Share
Table 10. List of Global Tier 2 and Tier 3 Chip On Flex (COF) Companies, Revenue (US$, Mn) in 2024 and Market Share
Table 11. Segment by Type – Global Chip On Flex (COF) Revenue, (US$, Mn), 2024 & 2032
Table 12. Segment by Type – Global Chip On Flex (COF) Revenue (US$, Mn), 2020-2025
Table 13. Segment by Type – Global Chip On Flex (COF) Revenue (US$, Mn), 2026-2032
Table 14. Segment by Type – Global Chip On Flex (COF) Sales (K Units), 2020-2025
Table 15. Segment by Type – Global Chip On Flex (COF) Sales (K Units), 2026-2032
Table 16. Segment by Application – Global Chip On Flex (COF) Revenue, (US$, Mn), 2024 & 2032
Table 17. Segment by Application – Global Chip On Flex (COF) Revenue, (US$, Mn), 2020-2025
Table 18. Segment by Application – Global Chip On Flex (COF) Revenue, (US$, Mn), 2026-2032
Table 19. Segment by Application – Global Chip On Flex (COF) Sales, (K Units), 2020-2025
Table 20. Segment by Application – Global Chip On Flex (COF) Sales, (K Units), 2026-2032
Table 21. By Region – Global Chip On Flex (COF) Revenue, (US$, Mn), 2025-2032
Table 22. By Region – Global Chip On Flex (COF) Revenue, (US$, Mn), 2020-2025
Table 23. By Region – Global Chip On Flex (COF) Revenue, (US$, Mn), 2026-2032
Table 24. By Region – Global Chip On Flex (COF) Sales, (K Units), 2020-2025
Table 25. By Region – Global Chip On Flex (COF) Sales, (K Units), 2026-2032
Table 26. By Country – North America Chip On Flex (COF) Revenue, (US$, Mn), 2020-2025
Table 27. By Country – North America Chip On Flex (COF) Revenue, (US$, Mn), 2026-2032
Table 28. By Country – North America Chip On Flex (COF) Sales, (K Units), 2020-2025
Table 29. By Country – North America Chip On Flex (COF) Sales, (K Units), 2026-2032
Table 30. By Country – Europe Chip On Flex (COF) Revenue, (US$, Mn), 2020-2025
Table 31. By Country – Europe Chip On Flex (COF) Revenue, (US$, Mn), 2026-2032
Table 32. By Country – Europe Chip On Flex (COF) Sales, (K Units), 2020-2025
Table 33. By Country – Europe Chip On Flex (COF) Sales, (K Units), 2026-2032
Table 34. By Region – Asia Chip On Flex (COF) Revenue, (US$, Mn), 2020-2025
Table 35. By Region – Asia Chip On Flex (COF) Revenue, (US$, Mn), 2026-2032
Table 36. By Region – Asia Chip On Flex (COF) Sales, (K Units), 2020-2025
Table 37. By Region – Asia Chip On Flex (COF) Sales, (K Units), 2026-2032
Table 38. By Country – South America Chip On Flex (COF) Revenue, (US$, Mn), 2020-2025
Table 39. By Country – South America Chip On Flex (COF) Revenue, (US$, Mn), 2026-2032
Table 40. By Country – South America Chip On Flex (COF) Sales, (K Units), 2020-2025
Table 41. By Country – South America Chip On Flex (COF) Sales, (K Units), 2026-2032
Table 42. By Country – Middle East & Africa Chip On Flex (COF) Revenue, (US$, Mn), 2020-2025
Table 43. By Country – Middle East & Africa Chip On Flex (COF) Revenue, (US$, Mn), 2026-2032
Table 44. By Country – Middle East & Africa Chip On Flex (COF) Sales, (K Units), 2020-2025
Table 45. By Country – Middle East & Africa Chip On Flex (COF) Sales, (K Units), 2026-2032
Table 46. LGIT Company Summary
Table 47. LGIT Chip On Flex (COF) Product Offerings
Table 48. LGIT Chip On Flex (COF) Sales (K Units), Revenue (US$, Mn) and Average Price (USD/Unit) & (2020-2025)
Table 49. LGIT Key News & Latest Developments
Table 50. Stemco Company Summary
Table 51. Stemco Chip On Flex (COF) Product Offerings
Table 52. Stemco Chip On Flex (COF) Sales (K Units), Revenue (US$, Mn) and Average Price (USD/Unit) & (2020-2025)
Table 53. Stemco Key News & Latest Developments
Table 54. Flexceed Company Summary
Table 55. Flexceed Chip On Flex (COF) Product Offerings
Table 56. Flexceed Chip On Flex (COF) Sales (K Units), Revenue (US$, Mn) and Average Price (USD/Unit) & (2020-2025)
Table 57. Flexceed Key News & Latest Developments
Table 58. Chipbond Technology Company Summary
Table 59. Chipbond Technology Chip On Flex (COF) Product Offerings
Table 60. Chipbond Technology Chip On Flex (COF) Sales (K Units), Revenue (US$, Mn) and Average Price (USD/Unit) & (2020-2025)
Table 61. Chipbond Technology Key News & Latest Developments
Table 62. CWE Company Summary
Table 63. CWE Chip On Flex (COF) Product Offerings
Table 64. CWE Chip On Flex (COF) Sales (K Units), Revenue (US$, Mn) and Average Price (USD/Unit) & (2020-2025)
Table 65. CWE Key News & Latest Developments
Table 66. Danbond Technology Company Summary
Table 67. Danbond Technology Chip On Flex (COF) Product Offerings
Table 68. Danbond Technology Chip On Flex (COF) Sales (K Units), Revenue (US$, Mn) and Average Price (USD/Unit) & (2020-2025)
Table 69. Danbond Technology Key News & Latest Developments
Table 70. AKM Industrial Company Summary
Table 71. AKM Industrial Chip On Flex (COF) Product Offerings
Table 72. AKM Industrial Chip On Flex (COF) Sales (K Units), Revenue (US$, Mn) and Average Price (USD/Unit) & (2020-2025)
Table 73. AKM Industrial Key News & Latest Developments
Table 74. Compass Technology Company Company Summary
Table 75. Compass Technology Company Chip On Flex (COF) Product Offerings
Table 76. Compass Technology Company Chip On Flex (COF) Sales (K Units), Revenue (US$, Mn) and Average Price (USD/Unit) & (2020-2025)
Table 77. Compass Technology Company Key News & Latest Developments
Table 78. Compunetics Company Summary
Table 79. Compunetics Chip On Flex (COF) Product Offerings
Table 80. Compunetics Chip On Flex (COF) Sales (K Units), Revenue (US$, Mn) and Average Price (USD/Unit) & (2020-2025)
Table 81. Compunetics Key News & Latest Developments
Table 82. STARS Microelectronics Company Summary
Table 83. STARS Microelectronics Chip On Flex (COF) Product Offerings
Table 84. STARS Microelectronics Chip On Flex (COF) Sales (K Units), Revenue (US$, Mn) and Average Price (USD/Unit) & (2020-2025)
Table 85. STARS Microelectronics Key News & Latest Developments
Table 86. Chip On Flex (COF) Capacity of Key Manufacturers in Global Market, 2023-2025 (K Units)
Table 87. Global Chip On Flex (COF) Capacity Market Share of Key Manufacturers, 2023-2025
Table 88. Global Chip On Flex (COF) Production by Region, 2020-2025 (K Units)
Table 89. Global Chip On Flex (COF) Production by Region, 2026-2032 (K Units)
Table 90. Chip On Flex (COF) Market Opportunities & Trends in Global Market
Table 91. Chip On Flex (COF) Market Drivers in Global Market
Table 92. Chip On Flex (COF) Market Restraints in Global Market
Table 93. Chip On Flex (COF) Raw Materials
Table 94. Chip On Flex (COF) Raw Materials Suppliers in Global Market
Table 95. Typical Chip On Flex (COF) Downstream
Table 96. Chip On Flex (COF) Downstream Clients in Global Market
Table 97. Chip On Flex (COF) Distributors and Sales Agents in Global Market

List of Figures
Figure 1. Chip On Flex (COF) Product Picture
Figure 2. Chip On Flex (COF) Segment by Type in 2024
Figure 3. Chip On Flex (COF) Segment by Application in 2024
Figure 4. Global Chip On Flex (COF) Market Overview: 2024
Figure 5. Key Caveats
Figure 6. Global Chip On Flex (COF) Market Size: 2024 VS 2032 (US$, Mn)
Figure 7. Global Chip On Flex (COF) Revenue: 2020-2032 (US$, Mn)
Figure 8. Chip On Flex (COF) Sales in Global Market: 2020-2032 (K Units)
Figure 9. The Top 3 and 5 Players Market Share by Chip On Flex (COF) Revenue in 2024
Figure 10. Segment by Type – Global Chip On Flex (COF) Revenue, (US$, Mn), 2024 & 2032
Figure 11. Segment by Type – Global Chip On Flex (COF) Revenue Market Share, 2020-2032
Figure 12. Segment by Type – Global Chip On Flex (COF) Sales Market Share, 2020-2032
Figure 13. Segment by Type – Global Chip On Flex (COF) Price (USD/Unit), 2020-2032
Figure 14. Segment by Application – Global Chip On Flex (COF) Revenue, (US$, Mn), 2024 & 2032
Figure 15. Segment by Application – Global Chip On Flex (COF) Revenue Market Share, 2020-2032
Figure 16. Segment by Application – Global Chip On Flex (COF) Sales Market Share, 2020-2032
Figure 17. Segment by Application -Global Chip On Flex (COF) Price (USD/Unit), 2020-2032
Figure 18. By Region – Global Chip On Flex (COF) Revenue, (US$, Mn), 2025 & 2032
Figure 19. By Region – Global Chip On Flex (COF) Revenue Market Share, 2020 VS 2024 VS 2032
Figure 20. By Region – Global Chip On Flex (COF) Revenue Market Share, 2020-2032
Figure 21. By Region – Global Chip On Flex (COF) Sales Market Share, 2020-2032
Figure 22. By Country – North America Chip On Flex (COF) Revenue Market Share, 2020-2032
Figure 23. By Country – North America Chip On Flex (COF) Sales Market Share, 2020-2032
Figure 24. United States Chip On Flex (COF) Revenue, (US$, Mn), 2020-2032
Figure 25. Canada Chip On Flex (COF) Revenue, (US$, Mn), 2020-2032
Figure 26. Mexico Chip On Flex (COF) Revenue, (US$, Mn), 2020-2032
Figure 27. By Country – Europe Chip On Flex (COF) Revenue Market Share, 2020-2032
Figure 28. By Country – Europe Chip On Flex (COF) Sales Market Share, 2020-2032
Figure 29. Germany Chip On Flex (COF) Revenue, (US$, Mn), 2020-2032
Figure 30. France Chip On Flex (COF) Revenue, (US$, Mn), 2020-2032
Figure 31. U.K. Chip On Flex (COF) Revenue, (US$, Mn), 2020-2032
Figure 32. Italy Chip On Flex (COF) Revenue, (US$, Mn), 2020-2032
Figure 33. Russia Chip On Flex (COF) Revenue, (US$, Mn), 2020-2032
Figure 34. Nordic Countries Chip On Flex (COF) Revenue, (US$, Mn), 2020-2032
Figure 35. Benelux Chip On Flex (COF) Revenue, (US$, Mn), 2020-2032
Figure 36. By Region – Asia Chip On Flex (COF) Revenue Market Share, 2020-2032
Figure 37. By Region – Asia Chip On Flex (COF) Sales Market Share, 2020-2032
Figure 38. China Chip On Flex (COF) Revenue, (US$, Mn), 2020-2032
Figure 39. Japan Chip On Flex (COF) Revenue, (US$, Mn), 2020-2032
Figure 40. South Korea Chip On Flex (COF) Revenue, (US$, Mn), 2020-2032
Figure 41. Southeast Asia Chip On Flex (COF) Revenue, (US$, Mn), 2020-2032
Figure 42. India Chip On Flex (COF) Revenue, (US$, Mn), 2020-2032
Figure 43. By Country – South America Chip On Flex (COF) Revenue Market Share, 2020-2032
Figure 44. By Country – South America Chip On Flex (COF) Sales, Market Share, 2020-2032
Figure 45. Brazil Chip On Flex (COF) Revenue, (US$, Mn), 2020-2032
Figure 46. Argentina Chip On Flex (COF) Revenue, (US$, Mn), 2020-2032
Figure 47. By Country – Middle East & Africa Chip On Flex (COF) Revenue, Market Share, 2020-2032
Figure 48. By Country – Middle East & Africa Chip On Flex (COF) Sales, Market Share, 2020-2032
Figure 49. Turkey Chip On Flex (COF) Revenue, (US$, Mn), 2020-2032
Figure 50. Israel Chip On Flex (COF) Revenue, (US$, Mn), 2020-2032
Figure 51. Saudi Arabia Chip On Flex (COF) Revenue, (US$, Mn), 2020-2032
Figure 52. UAE Chip On Flex (COF) Revenue, (US$, Mn), 2020-2032
Figure 53. Global Chip On Flex (COF) Production Capacity (K Units), 2020-2032
Figure 54. The Percentage of Production Chip On Flex (COF) by Region, 2024 VS 2032
Figure 55. Chip On Flex (COF) Industry Value Chain
Figure 56. Marketing Channels