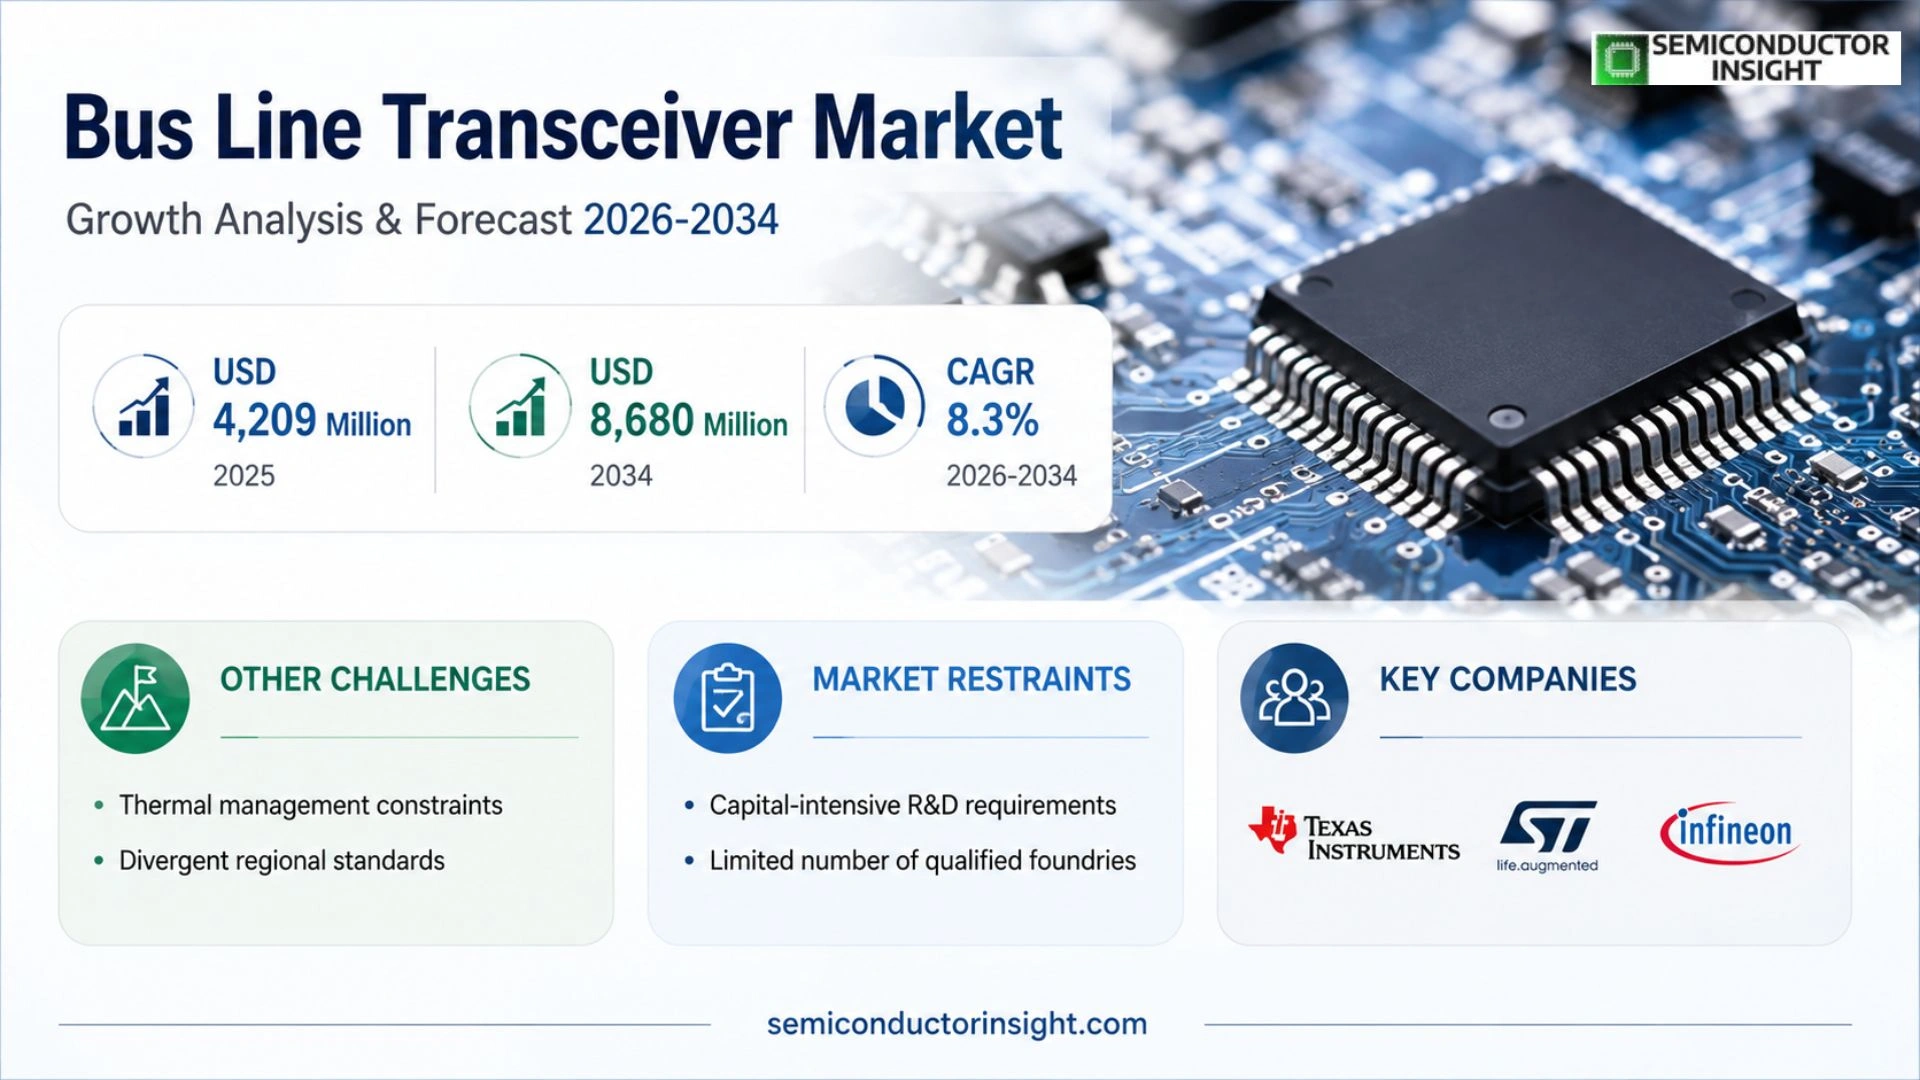
Bus Line Transceiver Market, Trends, Business Strategies 2026-2034

Bus Line Transceiver Market was valued at USD 4.21 billion in 2026 and is projected to reach USD 7.38 billion by 2034, exhibiting a CAGR of 8.4% during the forecast period.

PDF Icon Download Sample Report PDF
  • Quick Dispatch

    All Orders

  • Secure Payment

    100% Secure Payment

Price range: $1,500.00 through $4,250.00

Clear

Market Insights

Global Bus Line Transceiver Market was valued at USD 4.21 billion in 2026 and is projected to reach USD 7.38 billion by 2034, exhibiting a CAGR of 8.4% during the forecast period.

In 2026, global sales of bus line transceivers across various applications were estimated at 5.91 billion units, with an average selling price ranging between USD 0.75–0.85 per unit.

Bus Line Transceiver Market is a physical layer interface device that facilitates bidirectional data transmission between microcontrollers or system-on-chips (SoCs) and external buses such as CAN, LIN, RS-485, or parallel buses. These components perform critical functions including level conversion, signal conditioning, and bus protection while integrating features like ESD protection and fault detection to ensure reliable communication in electrically noisy environments.

The market growth is driven by increasing adoption in automotive electronics, where modern vehicles utilize 15–60 transceivers per unit for in-vehicle networking. Industrial automation applications also contribute significantly, with PLCs and motor control systems requiring multiple transceivers for robust fieldbus communication. While international semiconductor leaders dominate the high-reliability segments, regional manufacturers are gaining traction in cost-sensitive applications through localized solutions.

Xyz market size & forecast

MARKET DRIVERS

Growing Demand for Automotive Networking Solutions

Bus Line Transceiver Market is experiencing significant growth due to the rising adoption of advanced networking protocols in modern vehicles. With the automotive industry shifting toward connected and autonomous vehicles , the need for reliable data transmission across Controller Area Network (CAN) and FlexRay systems has intensified. An estimated 78% of new vehicles now incorporate multiple bus line transceivers for enhanced communication between electronic control units (ECUs).

Electrification of Vehicle Architectures

The transition to electric and hybrid vehicles is accelerating demand for robust bus line transceivers capable of operating in high-noise environments. These components ensure uninterrupted communication between battery management systems, motor controllers, and charging interfaces. Market data indicates a 32% year-over-year increase in transceiver shipments for electric vehicle applications.

OEMs across North America and Europe are prioritizing transceivers with advanced electromagnetic compatibility features, further propelling market expansion.

MARKET CHALLENGES

Technical Complexities in High-Speed Data Transmission

Bus Line Transceiver Market faces engineering hurdles in maintaining signal integrity at increasing data rates. As automotive networks evolve to support 10Mbps+ communication speeds , transceiver manufacturers must address challenges related to signal degradation and cross-talk without compromising power efficiency.

Other Challenges

Thermal Management Constraints
Modern transceivers must operate within tight thermal budgets while handling peak loads during simultaneous CAN FD and LIN network operation. This requires innovative packaging solutions that add 15-20% to production costs.

MARKET RESTRAINTS

Prolonged Automotive Certification Cycles

Stringent AEC-Q100 qualification requirements extend development timelines for new bus line transceiver models by 18-24 months. This delays market entry for innovative solutions despite proven technical advantages, particularly for safety-critical applications in autonomous driving systems.

MARKET OPPORTUNITIES


Expansion in Vehicle-to-Everything (V2X) Infrastructure

Bus Line Transceiver Market stands to gain from global V2X deployment initiatives requiring enhanced CAN FD and Ethernet backbone networks. Projections indicate this sector will account for 28% of total transceiver demand by 2026, with particular growth in roadside unit installations and smart city projects.
Bus Line Transceiver Market Trends

Increased Demand in Automotive and Industrial Applications

Bus Line Transceiver Market is experiencing robust growth due to rising adoption in automotive electronics and industrial automation systems. Modern vehicles now integrate 30-60 CAN/LIN bus transceivers to support advanced driver-assistance systems (ADAS) and in-vehicle networking, while industrial applications utilize 2-6 RS-485/fieldbus transceivers per PLC or distributed I/O station.

Other Trends

Transition to High-Speed Communication Protocols

Bus line transceivers supporting CAN FD and multi-gigabit Ethernet are gaining prominence as automotive E/E architectures evolve toward domain controllers and zonal gateways. Industrial systems are also transitioning from traditional RS-485 to high-speed protocols with integrated isolation features.

Technological Advancements in Transceiver Design

Manufacturers are developing transceivers with enhanced ESD protection (±16kV), extended temperature ranges (-40°C to +125°C), and improved power efficiency to meet stringent automotive and industrial requirements. New designs incorporate fault protection circuits and support mixed-voltage operation across 3.3V and 5V systems.

Supply Chain Localization Efforts

Regional manufacturers are gaining traction in mid-tier bus transceiver segments, particularly for RS-485 and LIN applications, challenging traditional IDM dominance. This trend is accelerating in Asia-Pacific markets where localized supply chains are prioritized.

Integration with Smart Energy Systems

The expansion of renewable energy infrastructure is driving demand for bus transceivers in photovoltaic inverters and battery management systems, with typical installations requiring 4-10 transceivers per unit. These applications demand robust communication interfaces capable of operating in high-noise environments.

COMPETITIVE LANDSCAPE

Key Industry Players

Global Bus Line Transceiver Market Dominated by Semiconductor Giants with Emerging Regional Challengers

Bus Line Transceiver Market remains highly consolidated, with Texas Instruments, NXP Semiconductors, and Infineon Technologies collectively holding over 45% market share. These established players leverage advanced process technologies and automotive-grade reliability to dominate high-performance segments like CAN FD and isolated RS-485 transceivers. Second-tier suppliers including STMicroelectronics and Microchip Technology compete through broad product portfolios covering industrial and automotive applications, while Asian manufacturers like SG Micro and Nexperia are gaining traction in cost-sensitive segments.

Specialized suppliers such as Vector Informatik and Exar focus on niche industrial protocols, while Japanese vendors Toshiba and Renesas maintain strong positions in automotive supply chains. The market shows increasing bifurcation between premium-priced automotive/industrial solutions and commoditized general-purpose transceivers, with price pressures intensifying in standard RS-485 and LIN bus segments. Recent capacity expansions by Analog Devices and Diodes Incorporated indicate growing demand for radiation-hardened and high-temperature variants.

List of Key Bus Line Transceiver Companies Profiled

Segment Analysis:

Segment Category Sub-Segments Key Insights
By Type
  • CAN/LIN Transceivers
  • RS-485/RS-422 Transceivers
  • Parallel Bus Transceivers
CAN/LIN Transceivers dominate automotive applications with robust EMC performance and functional safety integration. Key drivers include:

  • Increasing ECU complexity in vehicle architectures requires more bus nodes
  • Transition to CAN FD protocols supporting higher data rates for advanced driver assistance systems
  • Growing demand for fault-tolerant designs with integrated protection circuits
By Application
  • Automotive Electronics
  • Industrial Control
  • Energy Infrastructure
  • Building Automation
Automotive Electronics represents the most strategic growth segment due to:

  • New energy vehicles requiring 2-3x more transceivers than conventional vehicles
  • Domain controller architectures increasing bus network complexity
  • Stringent automotive qualification standards creating high barrier-to-entry
  • Emerging vehicle-to-everything (V2X) communication requirements
By End User
  • Tier 1 Automotive Suppliers
  • Industrial Equipment OEMs
  • Energy System Integrators
Tier 1 Automotive Suppliers drive innovation through:

  • Demand for ASIL-compliant transceiver solutions for safety-critical systems
  • Preference for supplier partnerships with ISO 26262 expertise
  • Increasing adoption of multi-protocol transceivers to reduce BOM complexity
  • Requirement for extended temperature range components (-40°C to +150°C)
By Protection Level
  • Basic ESD Protection
  • Enhanced EMI/EMC Protection
  • Galvanically Isolated
Galvanically Isolated transceivers are seeing accelerating adoption because:

  • Critical for industrial applications with high-voltage environments
  • Eliminates ground loops in distributed control systems
  • Enables higher bus voltage operation in harsh conditions
  • Provides superior surge protection for outdoor energy applications
By Integration Level
  • Discrete Components
  • Integrated Protection Circuits
  • System-on-Chip Solutions
System-on-Chip Solutions are gaining market share due to:

  • Space savings in dense automotive ECU designs
  • Improved reliability through monolithic integration
  • Reduced power consumption versus discrete implementations
  • Simplified design-in process for volume production

Regional Analysis: Bus Line Transceiver Market

Asia-Pacific

The Asia-Pacific region dominates the Bus Line Transceiver Market, driven by rapid urbanization and expanding public transportation infrastructure. China’s aggressive smart city initiatives and Japan’s advanced automotive electronics sector create strong demand for reliable bus communication systems. India’s growing electric bus fleet presents new opportunities for CAN bus transceiver adoption. Regional manufacturers benefit from established semiconductor ecosystems in South Korea and Taiwan, while government mandates for vehicle connectivity solutions in ASEAN countries further propel market growth. This region’s competitive edge stems from integrated supply chains supporting both domestic and international bus manufacturers with cost-effective transceiver solutions.

China’s Manufacturing Ecosystem
Home to the world’s largest bus production facilities, China’s vertically integrated supply chain allows for streamlined bus line transceiver development. Local players dominate commercial vehicle applications through partnerships with state-owned transit operators.
Japan’s Technological Leadership
Japanese automakers drive innovation in high-reliability CAN FD transceivers for premium bus applications. Keiretsu networks facilitate close collaboration between semiconductor suppliers and vehicle manufacturers, ensuring superior signal integrity.
India’s Growth Potential
Government’s FAME II scheme accelerates electric bus adoption, creating demand for specialized transceivers. Local startups are developing cost-optimized solutions tailored to India’s harsh operating conditions and voltage fluctuations.
ASEAN Market Dynamics
Southeast Asian nations prioritize fleet modernization, favoring transceivers with enhanced EMC performance. Regional partnerships between Japanese suppliers and local assemblers are reshaping the competitive landscape for bus communication systems.

North America
The North American bus line transceiver market benefits from stringent safety regulations and school bus fleet upgrades. Major transit authorities prioritize CAN XL compatible solutions for next-generation vehicles. U.S. manufacturers focus on ruggedized designs for extreme weather conditions, while cross-border harmonization with Canadian standards creates a unified procurement environment. The region’s strong R&D ecosystem supports development of cybersecurity-enhanced transceivers for connected bus platforms.

Europe
European manufacturers lead in implementing sophisticated bus networks for electric and hybrid vehicles. EU mandates for standardized communication protocols drive adoption of ISO 11898 compliant transceivers. Germany’s automotive electronics expertise produces premium solutions, while Eastern European countries emerge as cost-effective manufacturing hubs. The region’s focus on sustainable transit accelerates demand for energy-efficient transceiver designs.

South America
Brazil’s bus rapid transit systems create steady demand for robust communication components. Local suppliers adapt global transceiver designs to withstand tropical climates and biofuel compatibility requirements. Government investments in urban mobility projects across major cities are opening new opportunities for bus line transceiver suppliers, though pricing sensitivity remains a key market characteristic.

Middle East & Africa
Gulf Cooperation Council countries drive premium bus acquisitions with sophisticated electronics, while African markets increasingly adopt basic CAN bus systems for fleet management. Hot climate operation requirements and dust protection features differentiate product specifications in this region. Emerging transit projects in North Africa present growth avenues for cost-competitive transceiver solutions.

Report Scope

This market research report provides a comprehensive analysis of the Bus Line Transceiver Market, covering the forecast period 2026–2034. It offers detailed insights into market dynamics, technological advancements, competitive landscape, and key trends shaping the industry.

Key focus areas of the report include:

  • Market Overview: The report begins with an overview outlining its current market scenario, key growth indicators, and industry transformation drivers. It discusses macroeconomic factors, demand–supply balance, regulatory landscape, and the strategic role of semiconductors in powering advancements across industries such as automotive, telecommunications, consumer electronics, and industrial automation.
  • Market Size & Forecast: Historical data and future projections for revenue, unit shipments, and market value across major regions and segments.
  • Segmentation Analysis: Detailed breakdown by product type, technology, application, and end-user industry to identify high-growth segments and investment opportunities.
  • Regional Insights: Insights into market performance across North America, Europe, Asia-Pacific, Latin America, and the Middle East & Africa, including country-level analysis where relevant.
  • Competitive Landscape: Profiles of leading market participants, including their product offerings, R&D focus, manufacturing capacity, pricing strategies, and recent developments such as mergers, acquisitions, and partnerships.
  • Technology Trends & Innovation: Assessment of emerging technologies, integration of AI/IoT, semiconductor design trends, fabrication techniques, and evolving industry standards.
  • Market Drivers & Restraints: Evaluation of factors driving market growth along with challenges, supply chain constraints, regulatory issues, and market-entry barriers.
  • Stakeholder Insights: Insights for component suppliers, OEMs, system integrators, investors, and policymakers regarding the evolving ecosystem and strategic opportunities.

Primary and secondary research methods are employed, including interviews with industry experts, data from verified sources, and real-time market intelligence to ensure the accuracy and reliability of the insights presented.

FREQUENTLY ASKED QUESTIONS:

What is the current market size of Bus Line Transceiver Market?

-> Bus Line Transceiver Market was valued at USD 4.21 billion in 2026 and is projected to reach USD 7.38 billion by 2034, exhibiting a CAGR of 8.4% during the forecast period.

What are the key applications of bus line transceivers?

-> Key applications include automotive electronics (15-60 units per vehicle), industrial control systems (2-6 units per PLC), photovoltaic inverters (4-10 units), and motor/servo drives (1-3 units).

Which companies dominate the Bus Line Transceiver Market?

-> Key players include TI, Onsemi, STMicroelectronics, Microchip Technology, Renesas Electronics, Infineon, and Analog Devices, among others.

What are the major growth drivers?

-> Growth is driven by increasing automotive electronics adoption, new energy vehicle production, industrial automation, and demand for high-reliability communication in harsh environments.

What are the typical technical specifications?

-> Bus line transceivers typically feature data rates from 20 kbit/s to 50 Mbit/s, operating voltages of 3.3V or 5V, temperature range of -40°C to +125°C, and ESD protection up to ±16 kV.

Bus Line Transceiver Market, Trends, Business Strategies 2026-2034

Get Sample Report PDF for Exclusive Insights

Report Sample Includes

  • Table of Contents
  • List of Tables & Figures
  • Charts, Research Methodology, and more...

PDF Icon Download Sample Report PDF
SKU: b762610f4e6b
Category:
License Type

Corporate License, Excel License, PDF and Excel Databook License

Download Sample Report

Table of Content

1 Introduction to Research & Analysis Reports
1.1 Bus Line Transceiver Market Definition
1.2 Market Segments
1.2.1 Segment by Voltage
1.2.2 Segment by Current Sinking Capability
1.2.3 Segment by Packaging Method
1.2.4 Segment by Application
1.3 Global Bus Line Transceiver Market Overview
1.4 Features & Benefits of This Report
1.5 Methodology & Sources of Information
1.5.1 Research Methodology
1.5.2 Research Process
1.5.3 Base Year
1.5.4 Report Assumptions & Caveats
2 Global Bus Line Transceiver Overall Market Size
2.1 Global Bus Line Transceiver Market Size: 2025 VS 2032
2.2 Global Bus Line Transceiver Market Size, Prospects & Forecasts: 2021-2032
2.3 Global Bus Line Transceiver Sales: 2021-2032
3 Company Landscape
3.1 Top Bus Line Transceiver Players in Global Market
3.2 Top Global Bus Line Transceiver Companies Ranked by Revenue
3.3 Global Bus Line Transceiver Revenue by Companies
3.4 Global Bus Line Transceiver Sales by Companies
3.5 Global Bus Line Transceiver Price by Manufacturer (2021-2026)
3.6 Top 3 and Top 5 Bus Line Transceiver Companies in Global Market, by Revenue in 2025
3.7 Global Manufacturers Bus Line Transceiver Product Type
3.8 Tier 1, Tier 2, and Tier 3 Bus Line Transceiver Players in Global Market
3.8.1 List of Global Tier 1 Bus Line Transceiver Companies
3.8.2 List of Global Tier 2 and Tier 3 Bus Line Transceiver Companies
4 Sights by Voltage
4.1 Overview
4.1.1 Segment by Voltage – Global Bus Line Transceiver Market Size Markets, 2025 & 2032
4.1.2 3.6V
4.1.3 5.5V
4.1.4 6V
4.2 Segment by Voltage – Global Bus Line Transceiver Revenue & Forecasts
4.2.1 Segment by Voltage – Global Bus Line Transceiver Revenue, 2021-2026
4.2.2 Segment by Voltage – Global Bus Line Transceiver Revenue, 2027-2032
4.2.3 Segment by Voltage – Global Bus Line Transceiver Revenue Market Share, 2021-2032
4.3 Segment by Voltage – Global Bus Line Transceiver Sales & Forecasts
4.3.1 Segment by Voltage – Global Bus Line Transceiver Sales, 2021-2026
4.3.2 Segment by Voltage – Global Bus Line Transceiver Sales, 2027-2032
4.3.3 Segment by Voltage – Global Bus Line Transceiver Sales Market Share, 2021-2032
4.4 Segment by Voltage – Global Bus Line Transceiver Price (Manufacturers Selling Prices), 2021-2032
5 Sights by Current Sinking Capability
5.1 Overview
5.1.1 Segment by Current Sinking Capability – Global Bus Line Transceiver Market Size Markets, 2025 & 2032
5.1.2 8 mA
5.1.3 24 mA
5.1.4 Others
5.2 Segment by Current Sinking Capability – Global Bus Line Transceiver Revenue & Forecasts
5.2.1 Segment by Current Sinking Capability – Global Bus Line Transceiver Revenue, 2021-2026
5.2.2 Segment by Current Sinking Capability – Global Bus Line Transceiver Revenue, 2027-2032
5.2.3 Segment by Current Sinking Capability – Global Bus Line Transceiver Revenue Market Share, 2021-2032
5.3 Segment by Current Sinking Capability – Global Bus Line Transceiver Sales & Forecasts
5.3.1 Segment by Current Sinking Capability – Global Bus Line Transceiver Sales, 2021-2026
5.3.2 Segment by Current Sinking Capability – Global Bus Line Transceiver Sales, 2027-2032
5.3.3 Segment by Current Sinking Capability – Global Bus Line Transceiver Sales Market Share, 2021-2032
5.4 Segment by Current Sinking Capability – Global Bus Line Transceiver Price (Manufacturers Selling Prices), 2021-2032
6 Sights by Packaging Method
6.1 Overview
6.1.1 Segment by Packaging Method – Global Bus Line Transceiver Market Size Markets, 2025 & 2032
6.1.2 DW Package
6.1.3 N Package
6.2 Segment by Packaging Method – Global Bus Line Transceiver Revenue & Forecasts
6.2.1 Segment by Packaging Method – Global Bus Line Transceiver Revenue, 2021-2026
6.2.2 Segment by Packaging Method – Global Bus Line Transceiver Revenue, 2027-2032
6.2.3 Segment by Packaging Method – Global Bus Line Transceiver Revenue Market Share, 2021-2032
6.3 Segment by Packaging Method – Global Bus Line Transceiver Sales & Forecasts
6.3.1 Segment by Packaging Method – Global Bus Line Transceiver Sales, 2021-2026
6.3.2 Segment by Packaging Method – Global Bus Line Transceiver Sales, 2027-2032
6.3.3 Segment by Packaging Method – Global Bus Line Transceiver Sales Market Share, 2021-2032
6.4 Segment by Packaging Method – Global Bus Line Transceiver Price (Manufacturers Selling Prices), 2021-2032
7 Sights by Application
7.1 Overview
7.1.1 Segment by Application – Global Bus Line Transceiver Market Size, 2025 & 2032
7.1.2 Industrial Control
7.1.3 Automotive Electronics
7.1.4 Smart Home
7.1.5 Others
7.2 Segment by Application – Global Bus Line Transceiver Revenue & Forecasts
7.2.1 Segment by Application – Global Bus Line Transceiver Revenue, 2021-2026
7.2.2 Segment by Application – Global Bus Line Transceiver Revenue, 2027-2032
7.2.3 Segment by Application – Global Bus Line Transceiver Revenue Market Share, 2021-2032
7.3 Segment by Application – Global Bus Line Transceiver Sales & Forecasts
7.3.1 Segment by Application – Global Bus Line Transceiver Sales, 2021-2026
7.3.2 Segment by Application – Global Bus Line Transceiver Sales, 2027-2032
7.3.3 Segment by Application – Global Bus Line Transceiver Sales Market Share, 2021-2032
7.4 Segment by Application – Global Bus Line Transceiver Price (Manufacturers Selling Prices), 2021-2032
8 Sights Region
8.1 By Region – Global Bus Line Transceiver Market Size, 2025 & 2032
8.2 By Region – Global Bus Line Transceiver Revenue & Forecasts
8.2.1 By Region – Global Bus Line Transceiver Revenue, 2021-2026
8.2.2 By Region – Global Bus Line Transceiver Revenue, 2027-2032
8.2.3 By Region – Global Bus Line Transceiver Revenue Market Share, 2021-2032
8.3 By Region – Global Bus Line Transceiver Sales & Forecasts
8.3.1 By Region – Global Bus Line Transceiver Sales, 2021-2026
8.3.2 By Region – Global Bus Line Transceiver Sales, 2027-2032
8.3.3 By Region – Global Bus Line Transceiver Sales Market Share, 2021-2032
8.4 North America
8.4.1 By Country – North America Bus Line Transceiver Revenue, 2021-2032
8.4.2 By Country – North America Bus Line Transceiver Sales, 2021-2032
8.4.3 United States Bus Line Transceiver Market Size, 2021-2032
8.4.4 Canada Bus Line Transceiver Market Size, 2021-2032
8.4.5 Mexico Bus Line Transceiver Market Size, 2021-2032
8.5 Europe
8.5.1 By Country – Europe Bus Line Transceiver Revenue, 2021-2032
8.5.2 By Country – Europe Bus Line Transceiver Sales, 2021-2032
8.5.3 Germany Bus Line Transceiver Market Size, 2021-2032
8.5.4 France Bus Line Transceiver Market Size, 2021-2032
8.5.5 U.K. Bus Line Transceiver Market Size, 2021-2032
8.5.6 Italy Bus Line Transceiver Market Size, 2021-2032
8.5.7 Russia Bus Line Transceiver Market Size, 2021-2032
8.5.8 Nordic Countries Bus Line Transceiver Market Size, 2021-2032
8.5.9 Benelux Bus Line Transceiver Market Size, 2021-2032
8.6 Asia
8.6.1 By Region – Asia Bus Line Transceiver Revenue, 2021-2032
8.6.2 By Region – Asia Bus Line Transceiver Sales, 2021-2032
8.6.3 China Bus Line Transceiver Market Size, 2021-2032
8.6.4 Japan Bus Line Transceiver Market Size, 2021-2032
8.6.5 South Korea Bus Line Transceiver Market Size, 2021-2032
8.6.6 Southeast Asia Bus Line Transceiver Market Size, 2021-2032
8.6.7 India Bus Line Transceiver Market Size, 2021-2032
8.7 South America
8.7.1 By Country – South America Bus Line Transceiver Revenue, 2021-2032
8.7.2 By Country – South America Bus Line Transceiver Sales, 2021-2032
8.7.3 Brazil Bus Line Transceiver Market Size, 2021-2032
8.7.4 Argentina Bus Line Transceiver Market Size, 2021-2032
8.8 Middle East & Africa
8.8.1 By Country – Middle East & Africa Bus Line Transceiver Revenue, 2021-2032
8.8.2 By Country – Middle East & Africa Bus Line Transceiver Sales, 2021-2032
8.8.3 Turkey Bus Line Transceiver Market Size, 2021-2032
8.8.4 Israel Bus Line Transceiver Market Size, 2021-2032
8.8.5 Saudi Arabia Bus Line Transceiver Market Size, 2021-2032
8.8.6 UAE Bus Line Transceiver Market Size, 2021-2032
9 Manufacturers & Brands Profiles
9.1 Onsemi
9.1.1 Onsemi Company Summary
9.1.2 Onsemi Business Overview
9.1.3 Onsemi Bus Line Transceiver Major Product Offerings
9.1.4 Onsemi Bus Line Transceiver Sales and Revenue in Global (2021-2026)
9.1.5 Onsemi Key News & Latest Developments
9.2 TI
9.2.1 TI Company Summary
9.2.2 TI Business Overview
9.2.3 TI Bus Line Transceiver Major Product Offerings
9.2.4 TI Bus Line Transceiver Sales and Revenue in Global (2021-2026)
9.2.5 TI Key News & Latest Developments
9.3 Vector Informatik
9.3.1 Vector Informatik Company Summary
9.3.2 Vector Informatik Business Overview
9.3.3 Vector Informatik Bus Line Transceiver Major Product Offerings
9.3.4 Vector Informatik Bus Line Transceiver Sales and Revenue in Global (2021-2026)
9.3.5 Vector Informatik Key News & Latest Developments
9.4 Toshiba
9.4.1 Toshiba Company Summary
9.4.2 Toshiba Business Overview
9.4.3 Toshiba Bus Line Transceiver Major Product Offerings
9.4.4 Toshiba Bus Line Transceiver Sales and Revenue in Global (2021-2026)
9.4.5 Toshiba Key News & Latest Developments
9.5 Infineon
9.5.1 Infineon Company Summary
9.5.2 Infineon Business Overview
9.5.3 Infineon Bus Line Transceiver Major Product Offerings
9.5.4 Infineon Bus Line Transceiver Sales and Revenue in Global (2021-2026)
9.5.5 Infineon Key News & Latest Developments
9.6 Microchip Technology
9.6.1 Microchip Technology Company Summary
9.6.2 Microchip Technology Business Overview
9.6.3 Microchip Technology Bus Line Transceiver Major Product Offerings
9.6.4 Microchip Technology Bus Line Transceiver Sales and Revenue in Global (2021-2026)
9.6.5 Microchip Technology Key News & Latest Developments
9.7 Exar
9.7.1 Exar Company Summary
9.7.2 Exar Business Overview
9.7.3 Exar Bus Line Transceiver Major Product Offerings
9.7.4 Exar Bus Line Transceiver Sales and Revenue in Global (2021-2026)
9.7.5 Exar Key News & Latest Developments
9.8 STMicroelectronics
9.8.1 STMicroelectronics Company Summary
9.8.2 STMicroelectronics Business Overview
9.8.3 STMicroelectronics Bus Line Transceiver Major Product Offerings
9.8.4 STMicroelectronics Bus Line Transceiver Sales and Revenue in Global (2021-2026)
9.8.5 STMicroelectronics Key News & Latest Developments
9.9 SG MICRO
9.9.1 SG MICRO Company Summary
9.9.2 SG MICRO Business Overview
9.9.3 SG MICRO Bus Line Transceiver Major Product Offerings
9.9.4 SG MICRO Bus Line Transceiver Sales and Revenue in Global (2021-2026)
9.9.5 SG MICRO Key News & Latest Developments
9.10 Nexperia
9.10.1 Nexperia Company Summary
9.10.2 Nexperia Business Overview
9.10.3 Nexperia Bus Line Transceiver Major Product Offerings
9.10.4 Nexperia Bus Line Transceiver Sales and Revenue in Global (2021-2026)
9.10.5 Nexperia Key News & Latest Developments
9.11 Adafruit
9.11.1 Adafruit Company Summary
9.11.2 Adafruit Business Overview
9.11.3 Adafruit Bus Line Transceiver Major Product Offerings
9.11.4 Adafruit Bus Line Transceiver Sales and Revenue in Global (2021-2026)
9.11.5 Adafruit Key News & Latest Developments
9.12 Analog Devices
9.12.1 Analog Devices Company Summary
9.12.2 Analog Devices Business Overview
9.12.3 Analog Devices Bus Line Transceiver Major Product Offerings
9.12.4 Analog Devices Bus Line Transceiver Sales and Revenue in Global (2021-2026)
9.12.5 Analog Devices Key News & Latest Developments
9.13 NTE Electronics
9.13.1 NTE Electronics Company Summary
9.13.2 NTE Electronics Business Overview
9.13.3 NTE Electronics Bus Line Transceiver Major Product Offerings
9.13.4 NTE Electronics Bus Line Transceiver Sales and Revenue in Global (2021-2026)
9.13.5 NTE Electronics Key News & Latest Developments
9.14 Diodes Incorporated
9.14.1 Diodes Incorporated Company Summary
9.14.2 Diodes Incorporated Business Overview
9.14.3 Diodes Incorporated Bus Line Transceiver Major Product Offerings
9.14.4 Diodes Incorporated Bus Line Transceiver Sales and Revenue in Global (2021-2026)
9.14.5 Diodes Incorporated Key News & Latest Developments
9.15 Renesas Electronics
9.15.1 Renesas Electronics Company Summary
9.15.2 Renesas Electronics Business Overview
9.15.3 Renesas Electronics Bus Line Transceiver Major Product Offerings
9.15.4 Renesas Electronics Bus Line Transceiver Sales and Revenue in Global (2021-2026)
9.15.5 Renesas Electronics Key News & Latest Developments
9.16 Teledyne
9.16.1 Teledyne Company Summary
9.16.2 Teledyne Business Overview
9.16.3 Teledyne Bus Line Transceiver Major Product Offerings
9.16.4 Teledyne Bus Line Transceiver Sales and Revenue in Global (2021-2026)
9.16.5 Teledyne Key News & Latest Developments
10 Global Bus Line Transceiver Production Capacity, Analysis
10.1 Global Bus Line Transceiver Production Capacity, 2021-2032
10.2 Bus Line Transceiver Production Capacity of Key Manufacturers in Global Market
10.3 Global Bus Line Transceiver Production by Region
11 Key Market Trends, Opportunity, Drivers and Restraints
11.1 Market Opportunities & Trends
11.2 Market Drivers
11.3 Market Restraints
12 Bus Line Transceiver Supply Chain Analysis
12.1 Bus Line Transceiver Industry Value Chain
12.2 Bus Line Transceiver Upstream Market
12.3 Bus Line Transceiver Downstream and Clients
12.4 Marketing Channels Analysis
12.4.1 Marketing Channels
12.4.2 Bus Line Transceiver Distributors and Sales Agents in Global
13 Conclusion
14 Appendix
14.1 Note
14.2 Examples of Clients
14.3 DisclaimerList of Tables
Table 1. Key Players of Bus Line Transceiver in Global Market
Table 2. Top Bus Line Transceiver Players in Global Market, Ranking by Revenue (2025)
Table 3. Global Bus Line Transceiver Revenue by Companies, (US$, Mn), 2021-2026
Table 4. Global Bus Line Transceiver Revenue Share by Companies, 2021-2026
Table 5. Global Bus Line Transceiver Sales by Companies, (Million Units), 2021-2026
Table 6. Global Bus Line Transceiver Sales Share by Companies, 2021-2026
Table 7. Key Manufacturers Bus Line Transceiver Price (2021-2026) & (US$/Unit)
Table 8. Global Manufacturers Bus Line Transceiver Product Type
Table 9. List of Global Tier 1 Bus Line Transceiver Companies, Revenue (US$, Mn) in 2025 and Market Share
Table 10. List of Global Tier 2 and Tier 3 Bus Line Transceiver Companies, Revenue (US$, Mn) in 2025 and Market Share
Table 11. Segment by Voltage – Global Bus Line Transceiver Revenue, (US$, Mn), 2025 & 2032
Table 12. Segment by Voltage – Global Bus Line Transceiver Revenue (US$, Mn), 2021-2026
Table 13. Segment by Voltage – Global Bus Line Transceiver Revenue (US$, Mn), 2027-2032
Table 14. Segment by Voltage – Global Bus Line Transceiver Sales (Million Units), 2021-2026
Table 15. Segment by Voltage – Global Bus Line Transceiver Sales (Million Units), 2027-2032
Table 16. Segment by Current Sinking Capability – Global Bus Line Transceiver Revenue, (US$, Mn), 2025 & 2032
Table 17. Segment by Current Sinking Capability – Global Bus Line Transceiver Revenue (US$, Mn), 2021-2026
Table 18. Segment by Current Sinking Capability – Global Bus Line Transceiver Revenue (US$, Mn), 2027-2032
Table 19. Segment by Current Sinking Capability – Global Bus Line Transceiver Sales (Million Units), 2021-2026
Table 20. Segment by Current Sinking Capability – Global Bus Line Transceiver Sales (Million Units), 2027-2032
Table 21. Segment by Packaging Method – Global Bus Line Transceiver Revenue, (US$, Mn), 2025 & 2032
Table 22. Segment by Packaging Method – Global Bus Line Transceiver Revenue (US$, Mn), 2021-2026
Table 23. Segment by Packaging Method – Global Bus Line Transceiver Revenue (US$, Mn), 2027-2032
Table 24. Segment by Packaging Method – Global Bus Line Transceiver Sales (Million Units), 2021-2026
Table 25. Segment by Packaging Method – Global Bus Line Transceiver Sales (Million Units), 2027-2032
Table 26. Segment by Application – Global Bus Line Transceiver Revenue, (US$, Mn), 2025 & 2032
Table 27. Segment by Application – Global Bus Line Transceiver Revenue, (US$, Mn), 2021-2026
Table 28. Segment by Application – Global Bus Line Transceiver Revenue, (US$, Mn), 2027-2032
Table 29. Segment by Application – Global Bus Line Transceiver Sales, (Million Units), 2021-2026
Table 30. Segment by Application – Global Bus Line Transceiver Sales, (Million Units), 2027-2032
Table 31. By Region – Global Bus Line Transceiver Revenue, (US$, Mn), 2025 & 2032
Table 32. By Region – Global Bus Line Transceiver Revenue, (US$, Mn), 2021-2026
Table 33. By Region – Global Bus Line Transceiver Revenue, (US$, Mn), 2027-2032
Table 34. By Region – Global Bus Line Transceiver Sales, (Million Units), 2021-2026
Table 35. By Region – Global Bus Line Transceiver Sales, (Million Units), 2027-2032
Table 36. By Country – North America Bus Line Transceiver Revenue, (US$, Mn), 2021-2026
Table 37. By Country – North America Bus Line Transceiver Revenue, (US$, Mn), 2027-2032
Table 38. By Country – North America Bus Line Transceiver Sales, (Million Units), 2021-2026
Table 39. By Country – North America Bus Line Transceiver Sales, (Million Units), 2027-2032
Table 40. By Country – Europe Bus Line Transceiver Revenue, (US$, Mn), 2021-2026
Table 41. By Country – Europe Bus Line Transceiver Revenue, (US$, Mn), 2027-2032
Table 42. By Country – Europe Bus Line Transceiver Sales, (Million Units), 2021-2026
Table 43. By Country – Europe Bus Line Transceiver Sales, (Million Units), 2027-2032
Table 44. By Region – Asia Bus Line Transceiver Revenue, (US$, Mn), 2021-2026
Table 45. By Region – Asia Bus Line Transceiver Revenue, (US$, Mn), 2027-2032
Table 46. By Region – Asia Bus Line Transceiver Sales, (Million Units), 2021-2026
Table 47. By Region – Asia Bus Line Transceiver Sales, (Million Units), 2027-2032
Table 48. By Country – South America Bus Line Transceiver Revenue, (US$, Mn), 2021-2026
Table 49. By Country – South America Bus Line Transceiver Revenue, (US$, Mn), 2027-2032
Table 50. By Country – South America Bus Line Transceiver Sales, (Million Units), 2021-2026
Table 51. By Country – South America Bus Line Transceiver Sales, (Million Units), 2027-2032
Table 52. By Country – Middle East & Africa Bus Line Transceiver Revenue, (US$, Mn), 2021-2026
Table 53. By Country – Middle East & Africa Bus Line Transceiver Revenue, (US$, Mn), 2027-2032
Table 54. By Country – Middle East & Africa Bus Line Transceiver Sales, (Million Units), 2021-2026
Table 55. By Country – Middle East & Africa Bus Line Transceiver Sales, (Million Units), 2027-2032
Table 56. Onsemi Company Summary
Table 57. Onsemi Bus Line Transceiver Product Offerings
Table 58. Onsemi Bus Line Transceiver Sales (Million Units), Revenue (US$, Mn) and Average Price (US$/Unit) & (2021-2026)
Table 59. Onsemi Key News & Latest Developments
Table 60. TI Company Summary
Table 61. TI Bus Line Transceiver Product Offerings
Table 62. TI Bus Line Transceiver Sales (Million Units), Revenue (US$, Mn) and Average Price (US$/Unit) & (2021-2026)
Table 63. TI Key News & Latest Developments
Table 64. Vector Informatik Company Summary
Table 65. Vector Informatik Bus Line Transceiver Product Offerings
Table 66. Vector Informatik Bus Line Transceiver Sales (Million Units), Revenue (US$, Mn) and Average Price (US$/Unit) & (2021-2026)
Table 67. Vector Informatik Key News & Latest Developments
Table 68. Toshiba Company Summary
Table 69. Toshiba Bus Line Transceiver Product Offerings
Table 70. Toshiba Bus Line Transceiver Sales (Million Units), Revenue (US$, Mn) and Average Price (US$/Unit) & (2021-2026)
Table 71. Toshiba Key News & Latest Developments
Table 72. Infineon Company Summary
Table 73. Infineon Bus Line Transceiver Product Offerings
Table 74. Infineon Bus Line Transceiver Sales (Million Units), Revenue (US$, Mn) and Average Price (US$/Unit) & (2021-2026)
Table 75. Infineon Key News & Latest Developments
Table 76. Microchip Technology Company Summary
Table 77. Microchip Technology Bus Line Transceiver Product Offerings
Table 78. Microchip Technology Bus Line Transceiver Sales (Million Units), Revenue (US$, Mn) and Average Price (US$/Unit) & (2021-2026)
Table 79. Microchip Technology Key News & Latest Developments
Table 80. Exar Company Summary
Table 81. Exar Bus Line Transceiver Product Offerings
Table 82. Exar Bus Line Transceiver Sales (Million Units), Revenue (US$, Mn) and Average Price (US$/Unit) & (2021-2026)
Table 83. Exar Key News & Latest Developments
Table 84. STMicroelectronics Company Summary
Table 85. STMicroelectronics Bus Line Transceiver Product Offerings
Table 86. STMicroelectronics Bus Line Transceiver Sales (Million Units), Revenue (US$, Mn) and Average Price (US$/Unit) & (2021-2026)
Table 87. STMicroelectronics Key News & Latest Developments
Table 88. SG MICRO Company Summary
Table 89. SG MICRO Bus Line Transceiver Product Offerings
Table 90. SG MICRO Bus Line Transceiver Sales (Million Units), Revenue (US$, Mn) and Average Price (US$/Unit) & (2021-2026)
Table 91. SG MICRO Key News & Latest Developments
Table 92. Nexperia Company Summary
Table 93. Nexperia Bus Line Transceiver Product Offerings
Table 94. Nexperia Bus Line Transceiver Sales (Million Units), Revenue (US$, Mn) and Average Price (US$/Unit) & (2021-2026)
Table 95. Nexperia Key News & Latest Developments
Table 96. Adafruit Company Summary
Table 97. Adafruit Bus Line Transceiver Product Offerings
Table 98. Adafruit Bus Line Transceiver Sales (Million Units), Revenue (US$, Mn) and Average Price (US$/Unit) & (2021-2026)
Table 99. Adafruit Key News & Latest Developments
Table 100. Analog Devices Company Summary
Table 101. Analog Devices Bus Line Transceiver Product Offerings
Table 102. Analog Devices Bus Line Transceiver Sales (Million Units), Revenue (US$, Mn) and Average Price (US$/Unit) & (2021-2026)
Table 103. Analog Devices Key News & Latest Developments
Table 104. NTE Electronics Company Summary
Table 105. NTE Electronics Bus Line Transceiver Product Offerings
Table 106. NTE Electronics Bus Line Transceiver Sales (Million Units), Revenue (US$, Mn) and Average Price (US$/Unit) & (2021-2026)
Table 107. NTE Electronics Key News & Latest Developments
Table 108. Diodes Incorporated Company Summary
Table 109. Diodes Incorporated Bus Line Transceiver Product Offerings
Table 110. Diodes Incorporated Bus Line Transceiver Sales (Million Units), Revenue (US$, Mn) and Average Price (US$/Unit) & (2021-2026)
Table 111. Diodes Incorporated Key News & Latest Developments
Table 112. Renesas Electronics Company Summary
Table 113. Renesas Electronics Bus Line Transceiver Product Offerings
Table 114. Renesas Electronics Bus Line Transceiver Sales (Million Units), Revenue (US$, Mn) and Average Price (US$/Unit) & (2021-2026)
Table 115. Renesas Electronics Key News & Latest Developments
Table 116. Teledyne Company Summary
Table 117. Teledyne Bus Line Transceiver Product Offerings
Table 118. Teledyne Bus Line Transceiver Sales (Million Units), Revenue (US$, Mn) and Average Price (US$/Unit) & (2021-2026)
Table 119. Teledyne Key News & Latest Developments
Table 120. Bus Line Transceiver Capacity of Key Manufacturers in Global Market, 2024-2026 (Million Units)
Table 121. Global Bus Line Transceiver Capacity Market Share of Key Manufacturers, 2024-2026
Table 122. Global Bus Line Transceiver Production by Region, 2021-2026 (Million Units)
Table 123. Global Bus Line Transceiver Production by Region, 2027-2032 (Million Units)
Table 124. Bus Line Transceiver Market Opportunities & Trends in Global Market
Table 125. Bus Line Transceiver Market Drivers in Global Market
Table 126. Bus Line Transceiver Market Restraints in Global Market
Table 127. Bus Line Transceiver Raw Materials
Table 128. Bus Line Transceiver Raw Materials Suppliers in Global Market
Table 129. Typical Bus Line Transceiver Downstream
Table 130. Bus Line Transceiver Downstream Clients in Global Market
Table 131. Bus Line Transceiver Distributors and Sales Agents in Global Market

List of Figures
Figure 1. Bus Line Transceiver Product Picture
Figure 2. Bus Line Transceiver Segment by Voltage in 2025
Figure 3. Bus Line Transceiver Segment by Current Sinking Capability in 2025
Figure 4. Bus Line Transceiver Segment by Packaging Method in 2025
Figure 5. Bus Line Transceiver Segment by Application in 2025
Figure 6. Global Bus Line Transceiver Market Overview: 2025
Figure 7. Key Caveats
Figure 8. Global Bus Line Transceiver Market Size: 2025 VS 2032 (US$, Mn)
Figure 9. Global Bus Line Transceiver Revenue: 2021-2032 (US$, Mn)
Figure 10. Bus Line Transceiver Sales in Global Market: 2021-2032 (Million Units)
Figure 11. The Top 3 and 5 Players Market Share by Bus Line Transceiver Revenue in 2025
Figure 12. Segment by Voltage – Global Bus Line Transceiver Revenue, (US$, Mn), 2025 & 2032
Figure 13. Segment by Voltage – Global Bus Line Transceiver Revenue Market Share, 2021-2032
Figure 14. Segment by Voltage – Global Bus Line Transceiver Sales Market Share, 2021-2032
Figure 15. Segment by Voltage – Global Bus Line Transceiver Price (US$/Unit), 2021-2032
Figure 16. Segment by Current Sinking Capability – Global Bus Line Transceiver Revenue, (US$, Mn), 2025 & 2032
Figure 17. Segment by Current Sinking Capability – Global Bus Line Transceiver Revenue Market Share, 2021-2032
Figure 18. Segment by Current Sinking Capability – Global Bus Line Transceiver Sales Market Share, 2021-2032
Figure 19. Segment by Current Sinking Capability – Global Bus Line Transceiver Price (US$/Unit), 2021-2032
Figure 20. Segment by Packaging Method – Global Bus Line Transceiver Revenue, (US$, Mn), 2025 & 2032
Figure 21. Segment by Packaging Method – Global Bus Line Transceiver Revenue Market Share, 2021-2032
Figure 22. Segment by Packaging Method – Global Bus Line Transceiver Sales Market Share, 2021-2032
Figure 23. Segment by Packaging Method – Global Bus Line Transceiver Price (US$/Unit), 2021-2032
Figure 24. Segment by Application – Global Bus Line Transceiver Revenue, (US$, Mn), 2025 & 2032
Figure 25. Segment by Application – Global Bus Line Transceiver Revenue Market Share, 2021-2032
Figure 26. Segment by Application – Global Bus Line Transceiver Sales Market Share, 2021-2032
Figure 27. Segment by Application -Global Bus Line Transceiver Price (US$/Unit), 2021-2032
Figure 28. By Region – Global Bus Line Transceiver Revenue, (US$, Mn), 2025 & 2032
Figure 29. By Region – Global Bus Line Transceiver Revenue Market Share, 2021 VS 2025 VS 2032
Figure 30. By Region – Global Bus Line Transceiver Revenue Market Share, 2021-2032
Figure 31. By Region – Global Bus Line Transceiver Sales Market Share, 2021-2032
Figure 32. By Country – North America Bus Line Transceiver Revenue Market Share, 2021-2032
Figure 33. By Country – North America Bus Line Transceiver Sales Market Share, 2021-2032
Figure 34. United States Bus Line Transceiver Revenue, (US$, Mn), 2021-2032
Figure 35. Canada Bus Line Transceiver Revenue, (US$, Mn), 2021-2032
Figure 36. Mexico Bus Line Transceiver Revenue, (US$, Mn), 2021-2032
Figure 37. By Country – Europe Bus Line Transceiver Revenue Market Share, 2021-2032
Figure 38. By Country – Europe Bus Line Transceiver Sales Market Share, 2021-2032
Figure 39. Germany Bus Line Transceiver Revenue, (US$, Mn), 2021-2032
Figure 40. France Bus Line Transceiver Revenue, (US$, Mn), 2021-2032
Figure 41. U.K. Bus Line Transceiver Revenue, (US$, Mn), 2021-2032
Figure 42. Italy Bus Line Transceiver Revenue, (US$, Mn), 2021-2032
Figure 43. Russia Bus Line Transceiver Revenue, (US$, Mn), 2021-2032
Figure 44. Nordic Countries Bus Line Transceiver Revenue, (US$, Mn), 2021-2032
Figure 45. Benelux Bus Line Transceiver Revenue, (US$, Mn), 2021-2032
Figure 46. By Region – Asia Bus Line Transceiver Revenue Market Share, 2021-2032
Figure 47. By Region – Asia Bus Line Transceiver Sales Market Share, 2021-2032
Figure 48. China Bus Line Transceiver Revenue, (US$, Mn), 2021-2032
Figure 49. Japan Bus Line Transceiver Revenue, (US$, Mn), 2021-2032
Figure 50. South Korea Bus Line Transceiver Revenue, (US$, Mn), 2021-2032
Figure 51. Southeast Asia Bus Line Transceiver Revenue, (US$, Mn), 2021-2032
Figure 52. India Bus Line Transceiver Revenue, (US$, Mn), 2021-2032
Figure 53. By Country – South America Bus Line Transceiver Revenue Market Share, 2021-2032
Figure 54. By Country – South America Bus Line Transceiver Sales, Market Share, 2021-2032
Figure 55. Brazil Bus Line Transceiver Revenue, (US$, Mn), 2021-2032
Figure 56. Argentina Bus Line Transceiver Revenue, (US$, Mn), 2021-2032
Figure 57. By Country – Middle East & Africa Bus Line Transceiver Revenue, Market Share, 2021-2032
Figure 58. By Country – Middle East & Africa Bus Line Transceiver Sales, Market Share, 2021-2032
Figure 59. Turkey Bus Line Transceiver Revenue, (US$, Mn), 2021-2032
Figure 60. Israel Bus Line Transceiver Revenue, (US$, Mn), 2021-2032
Figure 61. Saudi Arabia Bus Line Transceiver Revenue, (US$, Mn), 2021-2032
Figure 62. UAE Bus Line Transceiver Revenue, (US$, Mn), 2021-2032
Figure 63. Global Bus Line Transceiver Production Capacity (Million Units), 2021-2032
Figure 64. The Percentage of Production Bus Line Transceiver by Region, 2025 VS 2032
Figure 65. Bus Line Transceiver Industry Value Chain
Figure 66. Marketing Channels