
Key Statistics
Key Takeaways
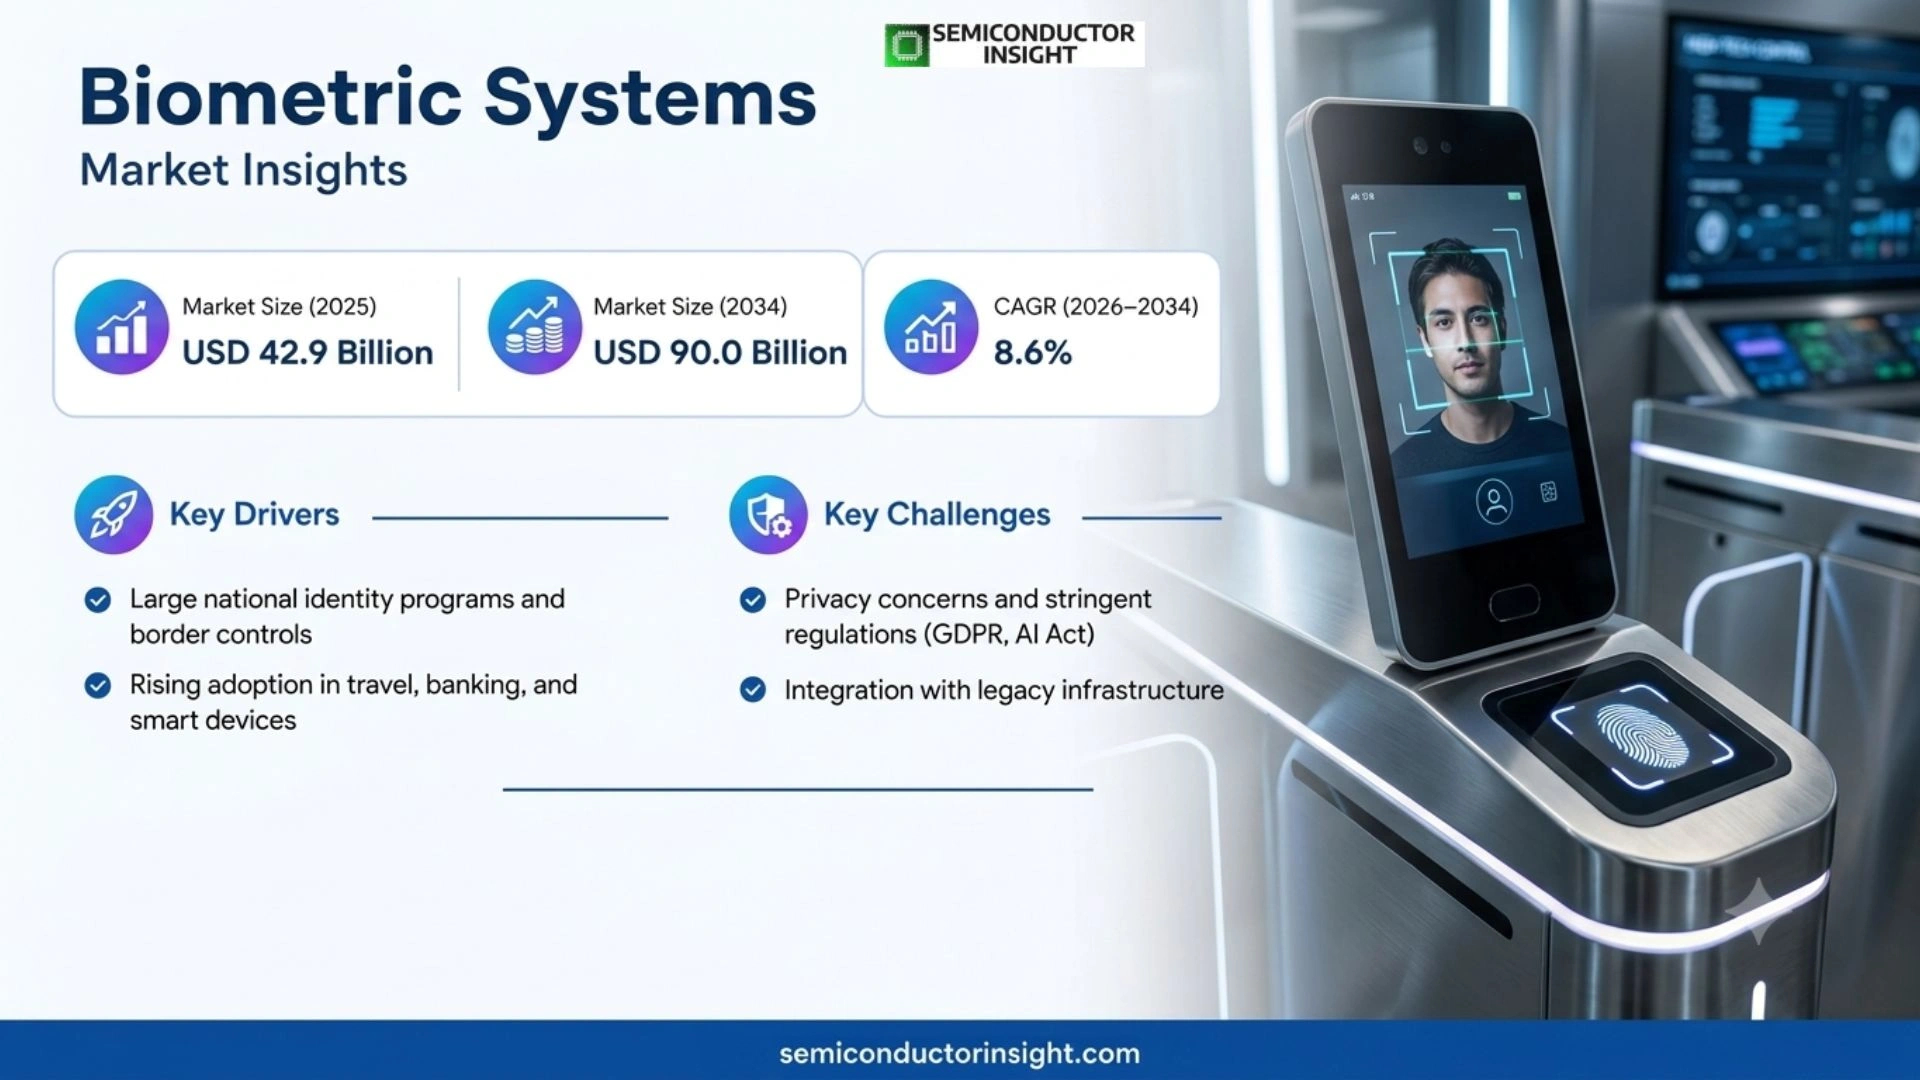
- The market was valued at USD 42.9 billion in 2025 across sensors, devices, software and integration.
- Revenue is forecast to reach USD 90.0 billion by 2034, representing an 8.6% CAGR during 2026–2034.
- North America leads current revenue through mature government, travel, financial-services, device and enterprise deployments.
- Fingerprint remains the largest modality, while facial, iris, behavioral and multimodal systems expand where contactless or higher-assurance identity is required.
Biometric Systems Market Overview
Biometric Systems Market includes hardware, algorithms, identity platforms and integration services that recognize or verify people through fingerprints, face, iris, voice, palm or vein patterns and behavioral signals. Valued at USD 42.9 billion in 2025, it is projected to reach USD 90.0 billion by 2034 at an 8.6% CAGR during 2026–2034. U.S. DHS defines biometrics as automated recognition based on biological and behavioral characteristics, emphasizing that commercial scope extends beyond a sensor to enrollment, template protection, matching, adjudication and identity lifecycle controls.
Performance and governance determine addressable demand. NIST face-recognition evaluation provides independent evidence on algorithm performance, while the Biometrics Institute stresses responsible use and human context. Buyers increasingly test demographic performance, presentation-attack detection, failure-to-enroll rates, privacy, consent, data retention, fallback methods and system cybersecurity before approving high-scale deployments. For commercial planning, this evidence should be read together with qualification requirements, installed-base economics, regional service coverage and the operating consequences of a failed deployment. Decision makers can then distinguish a durable purchasing signal from a short-lived technology announcement while keeping specification, integration and lifecycle risk visible in investment case 40.
Segment Analysis: By Type
Modality selection depends on environment, assurance level, population, user experience and available hardware. Fingerprint is the largest current category because of smartphones and mature access-control infrastructure. Facial and iris recognition benefit from contactless operation, while voice, vein and behavioral modalities solve specialized remote or high-assurance problems. Multimodal systems trade additional cost for resilience.
| Type | Role in the market | Commercial outlook |
|---|---|---|
| Fingerprint Identification | Uses optical, capacitive or ultrasonic capture and minutiae matching for verification or identification. | Largest segment through consumer devices, civil identity and access control; price pressure is balanced by large installed volume. |
| Facial Recognition | Matches facial images from phones, kiosks, cameras or controlled enrollment stations. | Fast growth in travel and digital onboarding, subject to strict accuracy, privacy and use-case governance. |
| Iris, Vein and Palm Recognition | Uses highly distinctive ocular or vascular patterns for contactless or controlled high-assurance applications. | Smaller premium segments in borders, payments, healthcare and secure access where reliability justifies specialized capture. |
| Voice, Behavioral and Multimodal | Analyzes voice or interaction patterns, or combines several biometric and non-biometric factors. | Strong opportunity in remote fraud prevention and step-up authentication, with model monitoring and spoof resistance essential. |
Segment Analysis: By Application
Applications range from mass-market device unlocking to national identity and border systems. Consumer electronics supplies high unit volume; government and defense create large, long-duration programs; banking and finance emphasize remote onboarding and fraud control; healthcare needs accurate patient identity; enterprises use physical and logical access. Each use case has a different error-cost and consent model.
| Application | Purchase logic | Forecast implications |
|---|---|---|
| Consumer Electronics | Biometrics unlock devices, authorize payments and protect local credentials. | Largest volume application, with revenue linked to premium sensor penetration and replacement cycles. |
| Government, Defense and Borders | Systems support civil identity, law enforcement, immigration, travel and secure facilities. | Large program value and long contracts, but procurement requires standards, auditability and legal authority. |
| Banking and Finance | Face, fingerprint, voice and behavior support onboarding, authentication and fraud detection. | Rapid digital growth favors software and liveness detection, balanced by liability and customer-friction concerns. |
| Enterprise and Healthcare | Physical access, workforce identity and patient matching combine devices, platforms and services. | Steady expansion where integration with identity governance and existing workflows is proven. |
Regional Analysis
North America leads current revenue through government, travel, financial, enterprise and device ecosystems. Europe is shaped by GDPR, the AI Act and the Entry/Exit System. Asia Pacific is the fastest-scaling region because of large identity programs and electronics production. South America and Middle East & Africa have substantial civil-ID, banking and border opportunities, usually delivered through national programs.
North America
The United States combines federal biometric programs, large technology platforms, financial-services adoption and extensive airport deployments. TSA’s biometrics program evaluates identity verification for security and passenger experience, while DHS and NIST influence operational and technical requirements. Canada emphasizes privacy-governed travel, banking and enterprise use; Mexico adds border, civil identity and financial inclusion demand.
| Country / market | Commercial role | Evidence-led outlook |
|---|---|---|
| United States | Largest regional revenue base | Government, travel, devices and enterprise authentication sustain broad demand. |
| Canada | Privacy-sensitive adopter | Banking, airports and public services favor controlled deployments. |
| Mexico | Civil identity and banking opportunity | Large population and digital services support enrollment and verification. |
Dated market instances
Europe
Europe combines major border modernization with strict data-protection and AI governance. The European Commission Entry/Exit System records facial images and fingerprints for eligible non-EU travelers and became fully operational in April 2026. Vendors must align accuracy, purpose limitation, security, human oversight and procurement evidence with national and EU requirements. For commercial planning, this evidence should be read together with qualification requirements, installed-base economics, regional service coverage and the operating consequences of a failed deployment. Decision makers can then distinguish a durable purchasing signal from a short-lived technology announcement while keeping specification, integration and lifecycle risk visible in investment case 35.
| Country / market | Commercial role | Evidence-led outlook |
|---|---|---|
| Germany | Identity and enterprise hub | eID, border and industrial access applications require strong governance. |
| France | Major biometric supplier and program base | Travel, government and payments support advanced deployments. |
| United Kingdom | Financial and travel demand | Remote onboarding and border programs drive software-led opportunities. |
Dated market instances
Asia Pacific
Asia Pacific combines the world’s largest civil-identity populations with leading smartphone and sensor manufacturing. India’s UIDAI Aadhaar program supports authentication at national scale. Japan, South Korea, Singapore and Australia deploy biometrics in travel, payments and enterprise security, while rules on data residency and public surveillance create distinct country-level requirements. For commercial planning, this evidence should be read together with qualification requirements, installed-base economics, regional service coverage and the operating consequences of a failed deployment. Decision makers can then distinguish a durable purchasing signal from a short-lived technology announcement while keeping specification, integration and lifecycle risk visible in investment case 36.
| Country / market | Commercial role | Evidence-led outlook |
|---|---|---|
| India | Mass-scale identity ecosystem | Aadhaar-enabled authentication creates hardware, software and service demand. |
| China | Large device and public-sector base | Domestic suppliers and localization shape competition. |
| Japan | High-reliability applications | Payments, enterprise and travel support multimodal solutions. |
Dated market instances
South America
Brazil leads regional demand through electoral identity, banking, payments and public services. Other markets pursue digital identity, border and welfare modernization, frequently using mobile fingerprint or face capture. Procurement depends on local data-protection rules, integration with population registries and the availability of enrollment and exception-handling services outside major cities. For commercial planning, this evidence should be read together with qualification requirements, installed-base economics, regional service coverage and the operating consequences of a failed deployment. Decision makers can then distinguish a durable purchasing signal from a short-lived technology announcement while keeping specification, integration and lifecycle risk visible in investment case 37.
| Country / market | Commercial role | Evidence-led outlook |
|---|---|---|
| Brazil | Largest regional market | Banking, government and electoral uses support diverse demand. |
| Argentina | Digital government and border use | Modernization is selective and budget-dependent. |
| Colombia | Financial inclusion and identity | Mobile onboarding creates software and liveness opportunities. |
Dated market instances
Middle East & Africa
Gulf countries invest in biometric borders, airports, national identity and smart services, while African markets use mobile capture for identity, elections, finance and benefit delivery. Iris and face systems can provide contactless operation, but connectivity, enrollment quality, demographic coverage and sustainable field support are critical. Programs often combine donor, government and prime-contractor procurement.
| Country / market | Commercial role | Evidence-led outlook |
|---|---|---|
| United Arab Emirates | Travel and smart-services hub | Airports and digital government support premium multimodal systems. |
| Saudi Arabia | Large national transformation programs | Identity and access needs grow with new infrastructure. |
| Nigeria | Population-scale inclusion opportunity | Mobile enrollment and financial services create demand with field constraints. |
Dated market instances
Key Biometric System Manufacturers and Competitive Landscape
The market includes consumer-device ecosystem owners, biometric sensor specialists, civil-identity primes, access-control companies and algorithm vendors. Competitive strength depends on modality depth, independent testing, presentation-attack resistance, privacy engineering, global program delivery and integration with identity platforms. The report retains the complete source-page company set, using current corporate identities where consolidation has changed names.
| Competitive tier | Companies | Basis of position |
|---|---|---|
| Platform and device leaders | Apple (AuthenTec); Synaptics; Fingerprint Cards | Scale in consumer hardware, embedded sensors and device authentication. |
| Government and identity primes | IDEMIA (Morpho Safran); NEC; Fujitsu; HID Global | Large programs, multimodal portfolios and global integration capability. |
| Specialists and access vendors | IrisGuard; dormakaba; M2SYS; Precise Biometrics; SecuGen; Suprema; ZKTeco | Focused algorithms, iris or fingerprint products and enterprise channels. |
Companies covered in the report
- Apple (AuthenTec)
- Fingerprint Cards
- Fujitsu
- HID Global Corporation
- IrisGuard
- dormakaba (Kaba Group)
- M2SYS
- IDEMIA (Morpho Safran Group)
- NEC Corporation
- Precise Biometrics
- SecuGen
- Suprema
- Synaptics
- ZKTeco
Apple and Synaptics influence embedded consumer authentication, while Fingerprint Cards and Precise Biometrics supply sensors or algorithms across device categories. IDEMIA, NEC, Fujitsu and HID compete for government, travel and enterprise programs where enrollment, matching at scale and integration matter. Suprema, ZKTeco, SecuGen, M2SYS and IrisGuard address access, development platforms and specialized modalities.
Independent performance evidence is a major differentiator. Algorithm accuracy can vary by image quality, demographic group, aging and operating environment; presentation attacks introduce another failure mode. Suppliers that expose test conditions, support standards and provide template protection, auditability and update governance can win regulated work even when a lower-priced alternative has comparable headline accuracy.
Biometric Accuracy, Liveness and Privacy-by-Design Analysis
Production volume is not the central constraint in biometric systems. Market acceptance depends on enrollment quality, matching performance, resistance to spoofing, privacy controls and fallback processes. This topic-relevant replacement evaluates how systems behave in the real population and operating context, which is more useful than counting factories that assemble cameras, readers or terminals.
| Assurance dimension | Evidence required | Commercial implication |
|---|---|---|
| Accuracy | False match, false non-match and failure-to-enroll by use case and population | Determines risk, throughput and manual review. |
| Presentation-attack detection | Tested resistance to masks, prints, replay, synthetic media and instrument attacks | Controls remote-onboarding and unattended-kiosk exposure. |
| Privacy and security | Template protection, encryption, retention, access and deletion controls | Determines legal approval and breach impact. |
| Human fallback | Accessible alternatives and adjudication for rejected or exceptional users | Protects service continuity and fairness. |
Thresholds must reflect the consequence of error
A threshold suitable for unlocking a personal device may be inappropriate for one-to-many border identification or high-value account recovery. Buyers should quantify false matches, false non-matches and review workload at the intended population scale. Performance must be tested with actual capture hardware, illumination and user behavior rather than inferred only from controlled benchmark rankings.
Liveness is a moving target
Attackers use high-quality photos, masks, replay, injection and synthetic media. Presentation-attack detection should be evaluated independently from recognition accuracy and monitored after software updates. Remote systems also need device integrity and capture-channel controls because a strong liveness model cannot protect a compromised application that injects data after the camera or microphone.
Privacy engineering shapes total market access
Biometric templates cannot be reset like passwords if compromised. Systems should minimize collection, separate identity data from templates, encrypt in transit and at rest, control retention and provide accountable deletion. On-device matching can reduce centralized exposure for some applications, while national systems need stronger governance, logging, access review and documented legal authority.
Biometric Systems Market Dynamics: Drivers, Restraints and Opportunities
Demand grows with digital identity, passwordless user experiences, border modernization, fraud prevention and contactless services. Restraints arise from privacy law, performance disparities, spoofing, high integration cost and public acceptance. The following directional ranges are scenario-planning estimates rather than independent published market forecasts. The analysis therefore connects technical constraints to procurement, qualification, deployment and long-term service economics instead of treating unit shipments as the only indicator of market strength.
MARKET DRIVERS
Estimated impact of primary growth drivers
| Factor | Directional CAGR impact | Most exposed market | Time horizon |
|---|---|---|---|
| Digital identity and remote onboarding | +1.8 to +2.7 points | Banking and government | Immediate to medium |
| Border and travel modernization | +1.2 to +2.0 points | Europe and North America | Medium term |
| Device and payment authentication | +0.9 to +1.5 points | Global consumers | Immediate |
| Multimodal and liveness innovation | +0.7 to +1.3 points | High-risk workflows | Medium term |
Digital services need stronger remote identity
Banks, governments, healthcare providers and marketplaces must establish identity without a branch visit. Face capture, document checks and liveness can reduce friction while improving evidence. Growth depends on fraud outcomes and exception handling, because aggressive rejection or poor accessibility can raise abandonment and service cost even when the matching algorithm is technically accurate.
Border systems create durable program demand
The EU Entry/Exit System records facial images and fingerprints at scale, while TSA and other agencies expand biometric travel. These deployments require kiosks, gates, cameras, matching platforms, integration and ongoing support. Long contracts create revenue, but vendors face demanding interoperability, throughput, privacy and operational-resilience requirements. For commercial planning, this evidence should be read together with qualification requirements, installed-base economics, regional service coverage and the operating consequences of a failed deployment. Decision makers can then distinguish a durable purchasing signal from a short-lived technology announcement while keeping specification, integration and lifecycle risk visible in investment case 47.
Consumer familiarity lowers behavioral barriers
Fingerprint and face unlocking have made biometric authentication routine for billions of device users. That familiarity supports payments and enterprise sign-in, particularly when biometric matching protects a device-held credential rather than exporting raw identity data. Suppliers benefit from replacement cycles and higher sensor integration, though mature smartphone volumes also create price pressure.
MARKET RESTRAINTS
Estimated impact of primary restraints
| Factor | Directional CAGR impact | Most exposed market | Time horizon |
|---|---|---|---|
| Privacy and regulatory constraints | -1.5 to -2.3 points | Public and workforce uses | Immediate |
| Spoofing and synthetic identity attacks | -1.0 to -1.7 points | Remote onboarding | Immediate to medium |
| Bias and field-performance gaps | -0.9 to -1.5 points | Large diverse populations | Medium term |
| Integration and exception cost | -0.7 to -1.2 points | Legacy organizations | Medium term |
Legal authority varies by use case and jurisdiction
Consent that is meaningful in a consumer app may not be available in employment, policing or border contexts. GDPR, U.S. state biometric laws and the EU AI Act create different obligations and restrictions. Global vendors need configurable retention, notice, access and deletion controls, plus country-specific contracts and evidence, which increases product and compliance cost.
Errors are operational and reputational risks
False matches can grant access or wrongly associate a person, while false rejections block legitimate users and create queues. Error rates depend on threshold, sensor, environment and population. Organizations need accessible fallback, human review and incident correction. A system that performs well in a lab can still fail commercially if operational exceptions are poorly designed.
Spoofing evolves faster than static certification
Presentation attacks now include synthetic media and digital injection as well as physical artifacts. Vendors must update detection without silently changing customer risk. Buyers should require layered controls, independent testing, model versioning, telemetry and rapid response. Remote authentication is especially exposed because the organization does not control the capture environment or device integrity.
MARKET OPPORTUNITIES
Privacy-preserving on-device biometrics
Matching on a secure device can keep templates local and use biometrics only to release a cryptographic credential. This architecture supports convenient passwordless authentication while limiting centralized biometric exposure. Opportunities extend to laptops, wearables, payment terminals and enterprise access, provided fallback and device-recovery workflows do not weaken overall assurance. For commercial planning, this evidence should be read together with qualification requirements, installed-base economics, regional service coverage and the operating consequences of a failed deployment. Decision makers can then distinguish a durable purchasing signal from a short-lived technology announcement while keeping specification, integration and lifecycle risk visible in investment case 52.
Multimodal adaptive authentication
Systems can combine face, voice, fingerprint, behavior, device and transaction context, escalating only when risk rises. This improves user experience and makes attacks more difficult. Commercial success depends on transparent decisioning, consent, calibrated thresholds and evidence that added signals reduce fraud rather than merely increasing vendor fees and operational complexity.
Inclusive national digital identity
Mobile enrollment kits, offline verification and multimodal capture can extend identity services to remote or underserved populations. Programs need strong governance, accessibility and grievance mechanisms so exclusion risk does not offset benefits. Vendors can build long-term service businesses around enrollment quality, deduplication, credential lifecycle and interoperable authentication rather than hardware alone.
Digital Identity and Authentication Ecosystem Analysis
A standard hardware supply chain does not capture where biometric-system value and risk reside. The relevant ecosystem links capture devices, algorithms, identity platforms, credentials, relying services and governance. This replacement follows the user from enrollment through authentication, exception handling and deletion, making it more relevant to program buyers and competitive assessment.
Revenue spans hardware, software licenses, cloud transactions, integration and managed services. Consumer platforms may internalize most layers, while national identity and border programs use several primes and subcontractors. Clear interface standards and data ownership are essential because customers need to change components without reenrolling entire populations or losing audit history.
Trust is a continuous operating requirement. Model updates, new attacks, demographic change and sensor aging can shift performance after launch. Leading suppliers provide monitoring, threshold governance, security patches and independent evaluation evidence. Buyers should assign ownership for enrollment quality, false-match review, appeals, breach response and deletion so lifecycle accountability does not disappear between technology and service providers.
Recent Developments in the Biometric Systems Market
Developments tracked to September 2026. Entries are dated to their official announcement or publication period.
- April 2026
Source – The European Commission declared the biometric Entry/Exit System fully operational across external Schengen border crossings. - October 2025
Source – The EU began progressive EES operation, collecting facial images and fingerprints for first registration. - July 2025
Source – The Commission fixed the launch date and six-month progressive rollout for EES. - 2025
Source – NIST published the SP 800-63-4 digital identity guidance suite with updated requirements for identity proofing and authentication. - August 2024
Source – The EU AI Act entered into force, establishing risk-based obligations that affect certain remote biometric uses.
REPORT SCOPE & SEGMENTATION
| Attribute | Details |
|---|---|
| Category | Security and Identity > Biometrics > Identification and Authentication Systems |
| Base Year | 2025 |
| Forecast Period | 2026–2034 |
| Market Size | USD 42.9 billion in 2025; USD 90.0 billion by 2034; 8.6% CAGR during 2026–2034 |
| By Type | Fingerprint Identification; Facial Recognition; Voice Identification; Vein and Palm Recognition; Iris Recognition; Behavioral and Multimodal |
| By Application | Consumer Electronics; Government and Defense; Banking and Finance; Healthcare; Enterprise Access; Travel and Borders |
| By Technology | Contact-based; Contactless; Hybrid / Multimodal |
| By Deployment | Standalone Device; Integrated On-premise System; Cloud or Managed Service; On-device / Edge |
| By End User | Government; Enterprises; Financial Institutions; Healthcare Providers; Consumers |
| Regions | North America; Europe; Asia Pacific; South America; Middle East & Africa |
| Companies | Apple (AuthenTec); Fingerprint Cards; Fujitsu; HID Global Corporation; IrisGuard; dormakaba (Kaba Group); M2SYS; IDEMIA (Morpho Safran Group); NEC Corporation; Precise Biometrics; SecuGen; Suprema; Synaptics; ZKTeco |
Frequently Asked Questions
What is the current size of the biometric systems market?
The global biometric systems market was valued at USD 42.9 billion in 2025. Scope includes capture hardware, embedded sensors, biometric terminals, matching and liveness software, identity platforms and directly associated integration. It covers fingerprint, face, iris, voice, vein, palm, behavioral and multimodal systems used for verification or identification. For commercial planning, this evidence should be read together with qualification requirements, installed-base economics, regional service coverage and the operating consequences of a failed deployment. Decision makers can then distinguish a durable purchasing signal from a short-lived technology announcement while keeping specification, integration and lifecycle risk visible in investment case 57.
What will the market be worth by 2034?
The market is forecast to reach USD 90.0 billion by 2034, representing an 8.6% CAGR during 2026–2034. Digital identity, remote onboarding, biometric travel, device authentication and multimodal fraud controls drive growth. Regulation, spoofing, performance disparities, public acceptance and the cost of integrating exception workflows can change annual adoption. For commercial planning, this evidence should be read together with qualification requirements, installed-base economics, regional service coverage and the operating consequences of a failed deployment. Decision makers can then distinguish a durable purchasing signal from a short-lived technology announcement while keeping specification, integration and lifecycle risk visible in investment case 58.
Which region leads the market?
North America is the largest market because it combines mature government and border programs, a large technology and device ecosystem, financial-services adoption and extensive enterprise identity spending. Europe is a major regulation-led market, highlighted by the EU Entry/Exit System. Asia Pacific is the fastest-scaling opportunity through national identity, mobile devices and digital services.
Which modality is largest?
Fingerprint identification remains the largest modality because it is deeply integrated into smartphones, laptops, access-control terminals and civil identity systems. Facial recognition is growing rapidly through contactless travel and remote onboarding. Iris, vein and palm systems serve higher-assurance niches, while behavioral and multimodal products expand where fraud patterns require continuous or adaptive decisions.
What are the major applications?
Major applications are consumer-device unlocking and payments, national and civil identity, law enforcement and borders, banking onboarding and transaction authentication, enterprise physical and logical access, healthcare patient matching and travel processing. The required architecture changes by use case because one-to-one verification, one-to-many identification and continuous behavioral monitoring have different error and governance profiles.
What drives market growth?
Growth is driven by digital transformation, rising online fraud, passwordless user experience, government identity programs, airport modernization and consumer familiarity with fingerprint and face authentication. Advances in sensors, liveness and edge processing expand feasible uses. Adoption is strongest when biometrics are integrated with a credential and risk workflow instead of being treated as a standalone security control.
What are the principal restraints?
Privacy regulation, public acceptance, demographic performance differences, presentation attacks, synthetic media, integration cost and difficult exception handling restrain adoption. Biometric data is sensitive and cannot simply be reissued after compromise. Buyers require purpose limitation, template protection, retention controls, accessible alternatives, audit trails and independent evidence that performance is suitable for the actual population.
Which companies are covered?
The report covers Apple (AuthenTec), Fingerprint Cards, Fujitsu, HID Global Corporation, IrisGuard, dormakaba (Kaba Group), M2SYS, IDEMIA (Morpho Safran Group), NEC Corporation, Precise Biometrics, SecuGen, Suprema, Synaptics and ZKTeco. Profiles compare modalities, independent testing, presentation-attack defenses, software platforms, program delivery, geographic reach and target applications. For commercial planning, this evidence should be read together with qualification requirements, installed-base economics, regional service coverage and the operating consequences of a failed deployment. Decision makers can then distinguish a durable purchasing signal from a short-lived technology announcement while keeping specification, integration and lifecycle risk visible in investment case 64.
Why was production-capacity analysis replaced?
Hardware assembly capacity is not the defining bottleneck for biometric systems. Accuracy, liveness, privacy architecture, enrollment quality and exception workflows determine whether a system can be legally and operationally deployed. The report therefore uses Biometric Accuracy, Liveness and Privacy-by-Design Analysis, providing a more relevant assessment for customers, regulators and investors.
Where are the strongest opportunities?
The strongest opportunities are privacy-preserving on-device authentication, multimodal adaptive fraud controls, biometric border and travel processing, inclusive national digital identity and managed assurance services. Vendors can differentiate through independent performance evidence, transparent thresholds, secure templates and strong lifecycle governance. Growth is particularly attractive where digital services need remote identity without adding excessive user friction.

Get Sample Report PDF for Exclusive Insights
Report Sample Includes
- Table of Contents
- List of Tables & Figures
- Charts, Research Methodology, and more...
 Download Sample Report PDF


