ASE (Amplified Spontaneous Emission) Source Market Overview
ASE sources, also known as superluminescent sources, are broadband light sources based on amplified spontaneous emission (ASE). These sources are widely used in fiber-optic communications, medical imaging, and sensing applications due to their high power, low coherence, and wide spectral range. This report provides a deep insight into the global ASE Source market covering all its essential aspects, ranging from a macro overview of the market to micro details of the market size, competitive landscape, development trends, niche markets, key market drivers, and challenges, SWOT analysis, value chain analysis, etc.
The analysis helps readers shape the competitive environment and strategies to enhance potential profits. Furthermore, the report provides a structured framework for evaluating and assessing the market position of various business organizations. The report also focuses on the competitive landscape of the Global ASE Source Market, introducing details on market share, market performance, product status, and operational performance of key players. This helps industry participants identify major competitors and understand the competitive structure of the market.
In summary, this report is essential for industry players, investors, researchers, consultants, business strategists, and stakeholders planning to enter the ASE Source market.
ASE Source Market Analysis
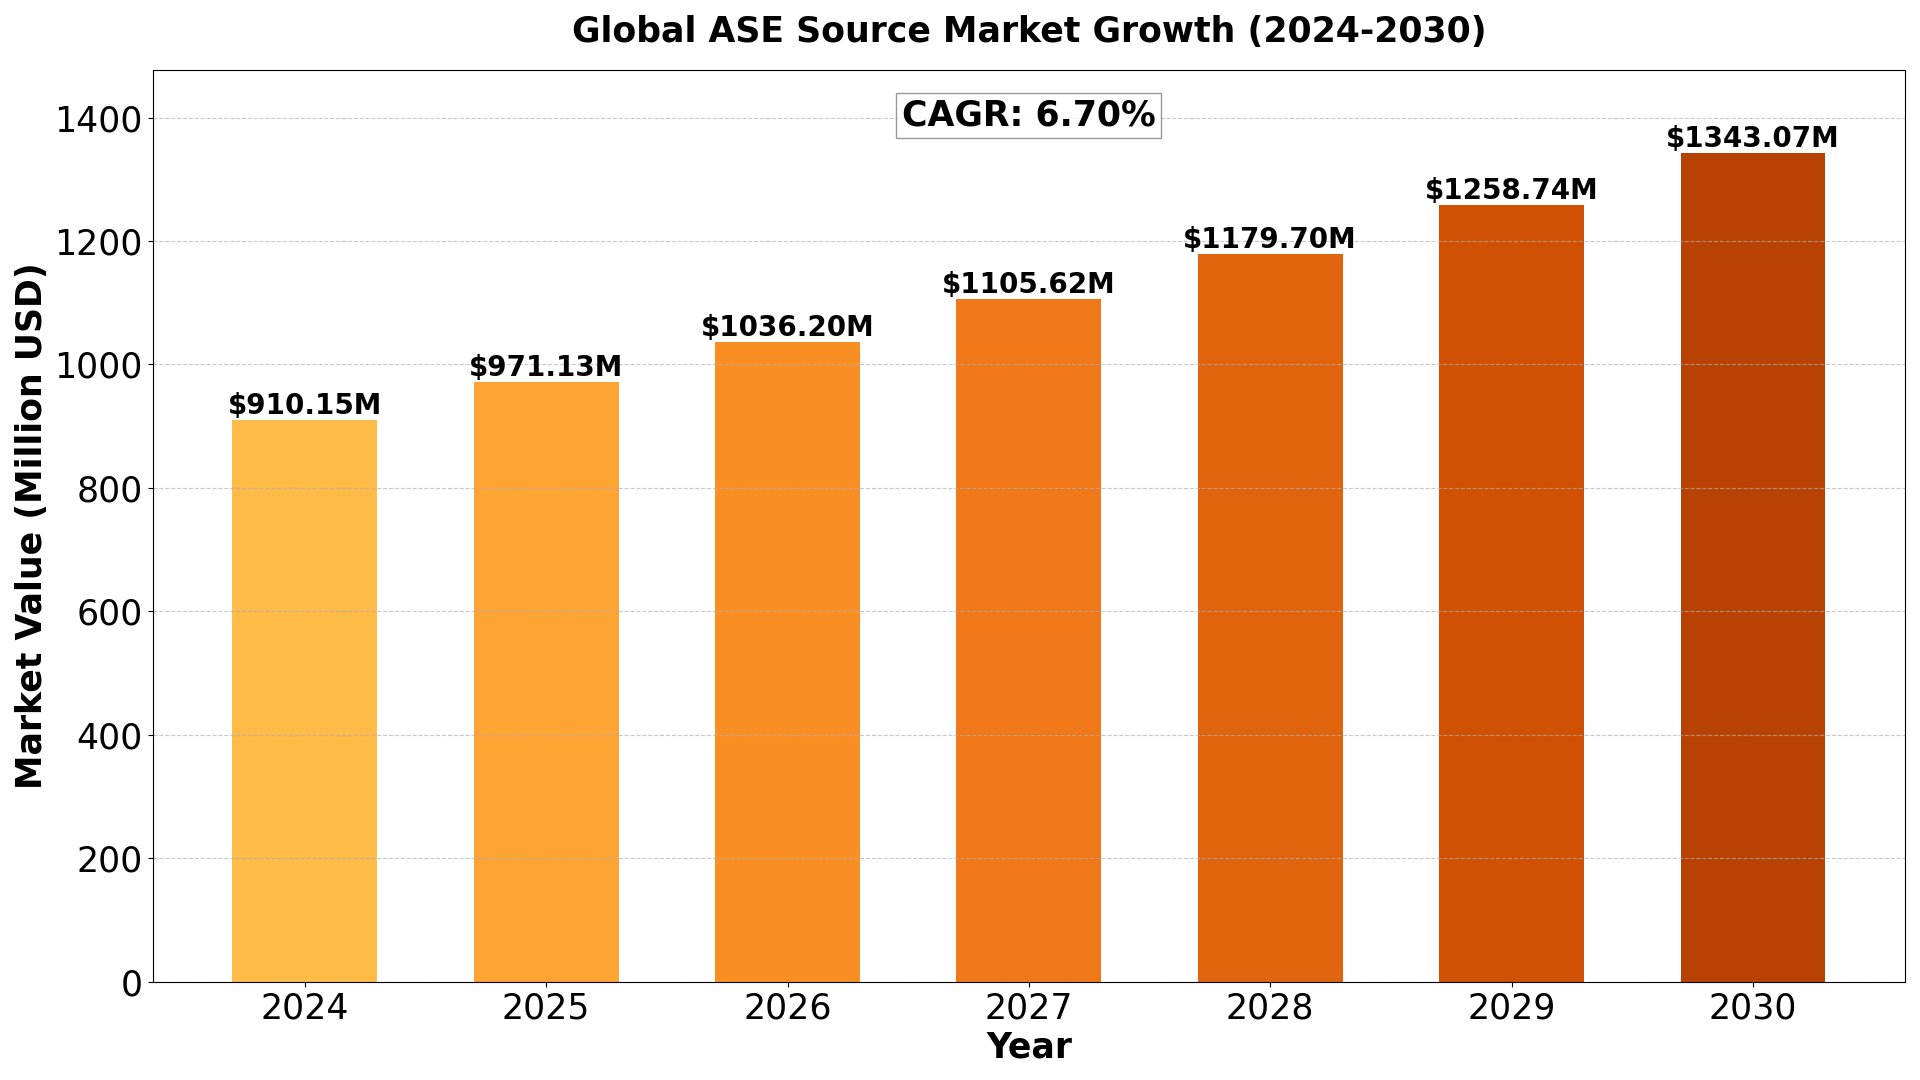
The global ASE (Amplified Spontaneous Emission) Source market size was estimated at USD 853 million in 2023 and is projected to reach USD 1343.07 million by 2030, exhibiting a CAGR of 6.70% during the forecast period.
North America ASE (Amplified Spontaneous Emission) Source market size was USD 222.27 million in 2023, at a CAGR of 5.74% during the forecast period of 2024 through 2030.
ASE Source Key Market Trends
- Rising Demand in Fiber Optic Sensing Applications – ASE sources are increasingly used in fiber optic sensors for industrial, defense, and medical applications due to their superior coherence properties and broadband emission.
- Advancements in Superluminescent Diodes (SLDs) – Continuous R&D efforts are improving SLDs, enhancing efficiency, reliability, and spectral performance, expanding their adoption in high-precision applications.
- Integration with Photonic Integrated Circuits (PICs) – ASE sources are being integrated into PICs, enabling compact, power-efficient, and high-performance optical systems for next-generation communications and sensing applications.
- Growing Adoption in Medical Imaging – The use of ASE sources in optical coherence tomography (OCT) and other medical imaging techniques is increasing, driven by demand for non-invasive, high-resolution diagnostic solutions.
- Expanding Application in Navigation and Aerospace – ASE sources are gaining traction in fiber optic gyroscopes (FOGs) for aerospace and defense applications, ensuring precise navigation and positioning capabilities.
ASE Source Market Regional Analysis :

- North America:Strong demand driven by EVs, 5G infrastructure, and renewable energy, with the U.S. leading the market.
- Europe:Growth fueled by automotive electrification, renewable energy, and strong regulatory support, with Germany as a key player.
- Asia-Pacific:Dominates the market due to large-scale manufacturing in China and Japan, with growing demand from EVs, 5G, and semiconductors.
- South America:Emerging market, driven by renewable energy and EV adoption, with Brazil leading growth.
- Middle East & Africa:Gradual growth, mainly due to investments in renewable energy and EV infrastructure, with Saudi Arabia and UAE as key contributors
ASE Source Market Segmentation
The research report includes specific segments by region (country), manufacturers, Type, and Application. Market segmentation creates subsets of a market based on product type, end-user or application, Geographic, and other factors. By understanding the market segments, the decision-maker can leverage this targeting in the product, sales, and marketing strategies. Market segments can power your product development cycles by informing how you create product offerings for different segments.
Key Companies
- AdValue Photonics
- DK Photonics
- Frankfurt Laser Company
- Alxenses
- GEHT International
- Opto-Link
- Zewda Technology
- Allwave Lasers Devices
- Beijing Keyuan Photonics
- FiberLabs
- FIBERPRO
- GIP Technology
Market Segmentation (by Type)
- Superluminescent Diodes (SLDs)
- Fiber Amplifiers
- Others
Market Segmentation (by Application)
- Medical
- Fiber Communications
- Gyroscopes
- Fiber-Optic Sensors
- Others
Drivers:
- Rising Adoption of IoT and Consumer Electronics: The growing demand for smart devices, IoT applications, and advanced consumer electronics is driving the need for Silicon-on-Sapphire wafers. Their superior performance makes them a preferred choice for high-performance chips in these devices.
- Technological Advancements in Semiconductor Industry: Continued technological advancements in the semiconductor industry are pushing for better-performing wafers. Silicon-on-Sapphire wafers offer high reliability, thermal stability, and efficient integration, which fuels their adoption in semiconductor manufacturing.
- Growth in Automotive Sector: The automotive industry’s shift towards electric vehicles (EVs) and autonomous driving technologies is creating new opportunities for Silicon-on-Sapphire wafers. These wafers are increasingly being used in automotive sensors and ICs.
Restraints:
- High Production Costs: Silicon-on-Sapphire wafers are expensive to produce compared to other semiconductor materials. The high manufacturing costs can limit their widespread adoption, particularly in cost-sensitive applications.
- Complex Manufacturing Processes: The hetero-epitaxial process involved in Silicon-on-Sapphire wafer production is complex and requires specialized equipment, which can be a barrier to entry for new manufacturers and increase the overall cost of production.
- Limited Awareness in Emerging Markets: In some emerging markets, awareness regarding the benefits of Silicon-on-Sapphire wafers remains limited. This lack of awareness could restrict the growth potential in these regions.
Opportunities:
- Expansion in Asia-Pacific: The Asia-Pacific region, particularly China, Japan, and South Korea, is witnessing rapid growth in semiconductor applications. This offers immense opportunities for the Silicon-on-Sapphire wafers market as companies seek to leverage regional growth.
- Integration in Advanced Medical Devices: Silicon-on-Sapphire wafers are increasingly being used in medical devices, particularly in pressure sensors and imaging systems. The rising demand for high-precision devices in healthcare presents an opportunity for market expansion.
- Emergence of Smart Cities and Smart Infrastructure: The growth of smart cities and infrastructures presents opportunities for the Silicon-on-Sapphire wafers market, especially in applications such as IoT sensors and smart grids, which require high-quality wafers for seamless performance.
Challenges:
- Competition from Alternative Materials: The presence of alternative materials, such as Silicon-on-Insulator (SOI) and other advanced semiconductors, presents a challenge to the widespread adoption of Silicon-on-Sapphire wafers in the market.
- Volatility in Raw Material Prices: Fluctuations in the prices of raw materials, particularly sapphire, can negatively affect the cost structure of Silicon-on-Sapphire wafer production, posing challenges to maintaining competitive pricing.
- Technological Obsolescence: The rapid pace of technological innovation in semiconductor manufacturing means that Silicon-on-Sapphire wafers could face obsolescence if new materials or processes emerge that provide better performance at a lower cost.
Key Benefits of This Market Research:
- Industry drivers, restraints, and opportunities covered in the study
- Neutral perspective on the market performance
- Recent industry trends and developments
- Competitive landscape & strategies of key players
- Potential & niche segments and regions exhibiting promising growth covered
- Historical, current, and projected market size, in terms of value
- In-depth analysis of the Silicon-on-Sapphire Wafers Market
- Overview of the regional outlook of the Silicon-on-Sapphire Wafers Market:
Key Reasons to Buy this Report:
- Access to date statistics compiled by our researchers. These provide you with historical and forecast data, which is analyzed to tell you why your market is set to change
- This enables you to anticipate market changes to remain ahead of your competitors
- You will be able to copy data from the Excel spreadsheet straight into your marketing plans, business presentations, or other strategic documents
- The concise analysis, clear graph, and table format will enable you to pinpoint the information you require quickly
- Provision of market value (USD Billion) data for each segment and sub-segment
- Indicates the region and segment that is expected to witness the fastest growth as well as to dominate the market
- The current as well as the future market outlook of the industry concerning recent developments which involve growth opportunities and drivers as well as challenges and restraints of both emerging as well as developed regions
- Includes in-depth analysis of the market from various perspectives through Porters five forces analysis
- Provides insight into the market through Value Chain
- Market dynamics scenario, along with growth opportunities of the market in the years to come
- 6-month post-sales analyst support
Customization of the Report In case of any queries or customization requirements, please connect with our sales team, who will ensure that your requirements are met.
FAQs
Q1: What are the key driving factors and opportunities in the ASE (Amplified Spontaneous Emission) Source Market?
A1: Key drivers include the increasing demand for high-speed fiber optic networks, advancements in photonic technologies, and growing applications in medical imaging. Opportunities lie in emerging quantum computing applications and the expansion of photonics in next-generation optical networks.
Q2: Which region is projected to have the largest market share?
A2: North America and Asia-Pacific are expected to dominate the market, with Asia-Pacific experiencing the fastest growth due to strong fiber-optic communication infrastructure and rising investments in photonics research.
Q3: Who are the top players in the global ASE (Amplified Spontaneous Emission) Source Market?
A3: Leading companies include AdValue Photonics, DK Photonics, Frankfurt Laser Company, Alxenses, GEHT International, Opto-Link, Zewda Technology, and FiberLabs.
Q4: What are the latest technological advancements in the industry?
A4: Key advancements include the development of photonic integrated circuits, improved ASE light source efficiency, miniaturization of optical components, and enhanced wavelength stability in optical systems.
Q5: What is the current size of the global ASE (Amplified Spontaneous Emission) Source Market?
A5: The market size was estimated at USD 853 million in 2023 and is projected to reach USD 1343.07 million by 2030, with a CAGR of 6.70% during the forecast period.
Get Sample Report PDF for Exclusive Insights
Report Sample Includes
- Table of Contents
- List of Tables & Figures
- Charts, Research Methodology, and more...

