Armored Fiber Patch Cables Market, Emerging Trends, Technological Advancements, and Business Strategies 2025-2032

Armored Fiber Patch Cables Market size was valued at US$ 578 million in 2024 and is projected to reach US$ 834 million by 2032, at a CAGR of 5.3% during the forecast period 2025-2032

PDF Icon Download Sample Report PDF
  • Quick Dispatch

    All Orders

  • Secure Payment

    100% Secure Payment

Compare

$1,500.00$4,250.00

Clear

MARKET INSIGHTS

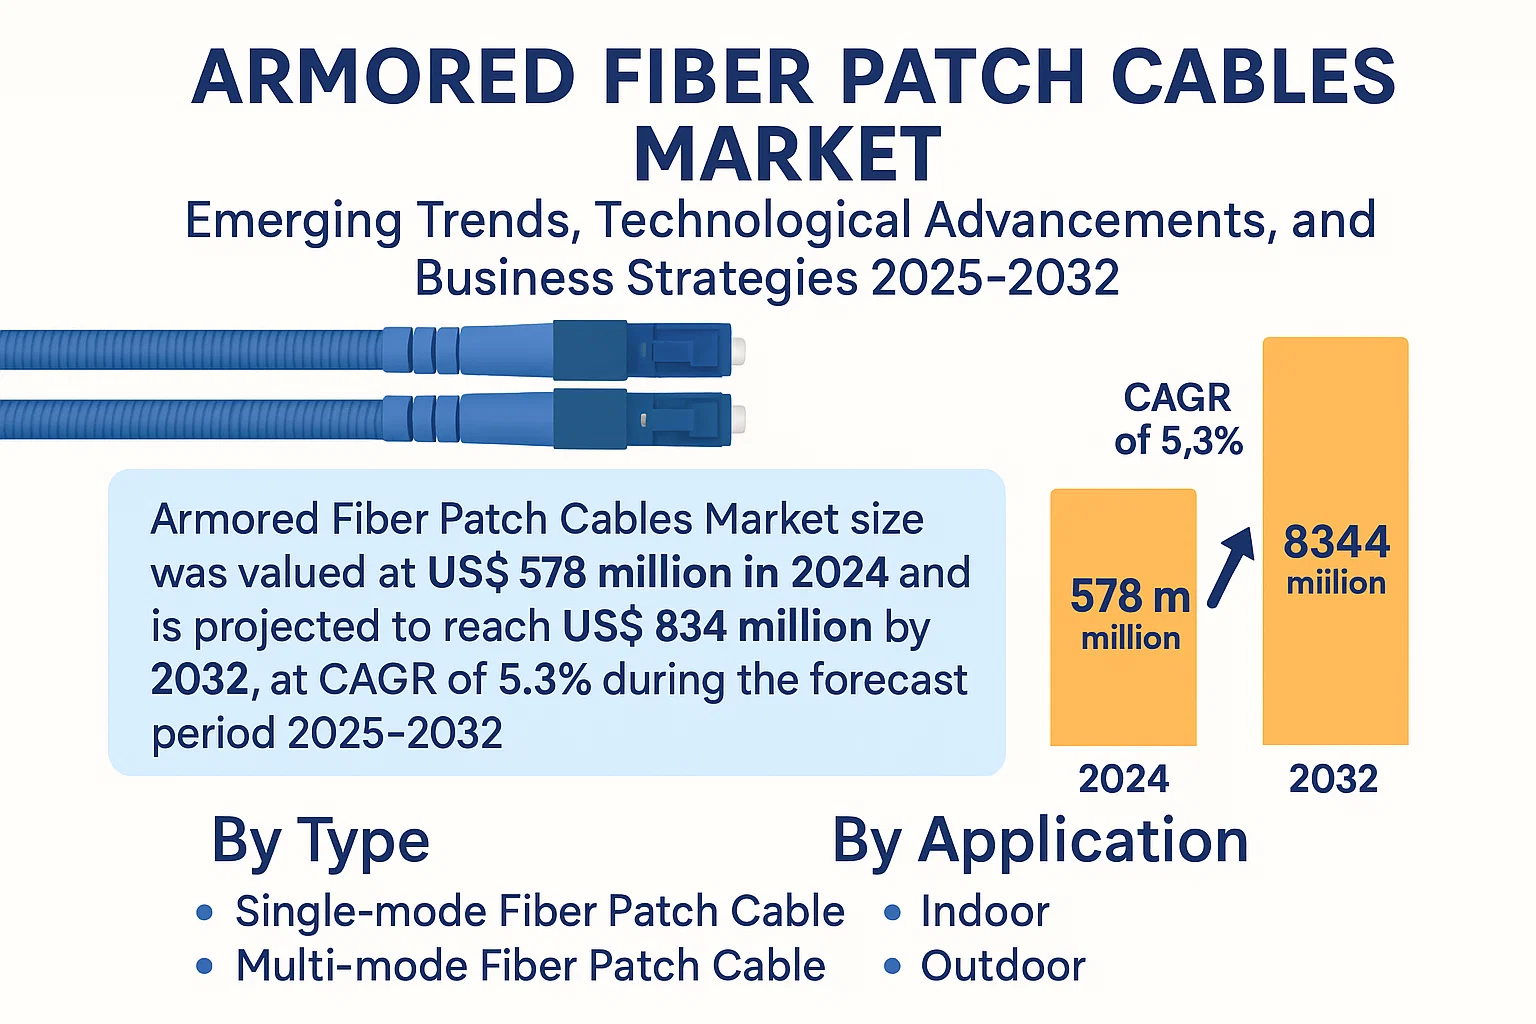
The global Armored Fiber Patch Cables Market size was valued at US$ 578 million in 2024 and is projected to reach US$ 834 million by 2032, at a CAGR of 5.3% during the forecast period 2025-2032.

Armored fiber patch cables are reinforced optical fiber cables featuring a protective steel or aluminum jacket covered with polyethylene for enhanced durability. These specialized cables eliminate the need for additional protective sleeving while providing superior resistance to moisture, abrasion, and physical damage in harsh environments. Their robust construction makes them ideal for direct installation in data centers, industrial settings, and outdoor applications where standard fiber cables would be vulnerable.

The market growth is driven by increasing demand for high-speed data transmission and the expansion of 5G networks, which require more resilient connectivity solutions. Furthermore, the rising adoption of IoT devices and cloud computing services necessitates reliable network infrastructure with enhanced physical protection. While North America currently dominates the market with a 38% revenue share, Asia-Pacific is expected to witness the fastest growth due to rapid digital transformation initiatives in China, India, and Southeast Asian countries.

Armored Fiber Patch Cables Market

MARKET DYNAMICS

MARKET DRIVERS

Growing Demand for High-Speed Data Transmission to Accelerate Market Growth

The exponential rise in data consumption across industries is driving significant demand for robust fiber optic solutions. Armored fiber patch cables, with their reinforced durability and superior signal integrity, are becoming indispensable in high-bandwidth applications. Recent estimates indicate that global IP traffic will surpass 400 exabytes per month by 2025, creating unprecedented pressure on network infrastructure. The armored variants provide critical protection against physical damage and electromagnetic interference, ensuring uninterrupted data flow in mission-critical environments.

Expansion of 5G Infrastructure Creating Sustainable Demand

Global 5G network deployments are progressing at a CAGR exceeding 40%, necessitating resilient connectivity solutions. Armored fiber patch cables offer the perfect balance of flexibility and protection for dense 5G base station configurations. Their ability to withstand harsh outdoor conditions while maintaining signal purity makes them preferred choices for telecom operators. Recent infrastructure projects in Asia Pacific and North America have allocated over 30% of their cabling budgets specifically to armored solutions, reflecting this paradigm shift.

The steel-jacketed variant alone accounts for nearly 65% of 5G-related fiber optic deployments due to its superior tensile strength and rodent resistance.

Furthermore, the gradual phase-out of copper-based networks in developed economies is creating additional opportunities. Regulatory mandates for future-proof infrastructure are compelling service providers to adopt armored fiber solutions as long-term investments.

MARKET RESTRAINTS

Higher Costs Compared to Conventional Cables Limiting Widespread Adoption

While offering superior protection, armored fiber patch cables command a significant price premium – typically 35-50% higher than standard fiber optic cables. This cost differential becomes particularly impactful in large-scale deployments where kilometer-long runs are required. Emerging markets with constrained budgets often opt for cheaper alternatives despite the long-term maintenance advantages of armored solutions.

Other Constraints

Installation Complexity
The additional weight and rigidity of armored cables require specialized handling equipment and trained technicians. This increases deployment timelines by approximately 20-25% compared to standard installations, creating logistical challenges for time-sensitive projects.

Flexibility Trade-offs
While newer designs have improved bend radius, many armored variants still face limitations in tight spaces. Data center applications requiring high-density patching sometimes prefer unarmored cables for their greater maneuverability.

MARKET CHALLENGES

Emerging Wireless Technologies Potentially Disrupting Market Trajectory

The rapid advancement of millimeter-wave and LiFi technologies presents disruptive potential for physical fiber networks. While fiber will remain critical for backbone infrastructure, certain last-mile applications might migrate to wireless alternatives. Recent trials have demonstrated wireless backhaul solutions achieving speeds comparable to fiber in specific use cases.

Material Innovation Challenges
Developing armor materials that balance protection with weight reduction continues to be an engineering challenge. The industry is actively researching composite materials that can maintain durability while reducing cable mass by 15-20%.

MARKET OPPORTUNITIES

Industrial IoT Expansion Creating New Application Horizons

The proliferation of Industry 4.0 technologies is generating robust demand for factory-hardened connectivity solutions. Manufacturing facilities require cabling that can withstand extreme temperatures, chemical exposure, and mechanical stress while delivering real-time data transmission. The industrial segment is projected to account for over 25% of armored fiber patch cable sales by 2026.

Emerging Markets Presenting Untapped Potential

Developing nations undergoing digital transformation are investing heavily in resilient network infrastructure. Government initiatives like India’s BharatNet project and Brazil’s National Broadband Plan are incorporating armored fiber solutions for rural connectivity. These programs collectively represent installation pipelines exceeding 500,000 kilometers in the coming years.

Customized solutions for extreme environments (submarine, mining, oil/gas) command premium pricing with gross margins 40-50% higher than standard offerings.

Furthermore, the anticipated transition to 800G and 1.6T data center architectures will require upgraded connectivity solutions. Armored cables with enhanced shielding will be critical for maintaining signal integrity at these ultra-high speeds.

ARMORED FIBER PATCH CABLES MARKET TRENDS

Growing Demand for Robust Network Infrastructure Drives Market Expansion

The global armored fiber patch cables market is experiencing significant growth, driven by the increasing need for durable and reliable network solutions in harsh environments. With the rise of Industry 4.0 and smart manufacturing, there is a heightened demand for fiber optic cables that can withstand extreme conditions while maintaining high-speed data transmission. The market, valued at $220 million in 2024, is projected to grow at a CAGR of 8.5% over the next six years, reaching approximately $360 million by 2032. This growth is primarily attributed to the advantages of armored cables—eliminating the need for additional protective sleeving, reducing installation costs, and enhancing maintenance efficiency in data centers, telecom networks, and industrial applications.

Other Trends

5G Deployment Accelerates Adoption of Armored Fiber Solutions

The global rollout of 5G networks is significantly boosting demand for armored fiber patch cables due to their ability to protect sensitive fiber connections in outdoor and high-interference environments. Telecommunications providers are increasingly adopting these cables for backhaul and fronthaul applications where physical durability and signal integrity are critical. Moreover, the expansion of fiber-to-the-home (FTTH) initiatives worldwide is creating additional demand for reliable, long-lasting fiber optic connections in residential and commercial settings.

Technological Advancements in Cable Design

Recent innovations in armored cable technology are enhancing product performance and market adoption. Manufacturers are developing lighter-weight armored solutions using advanced materials like stainless steel micro-armor and aluminum interlock designs that maintain durability while improving flexibility. There is also growing adoption of hybrid armored cables that combine both copper and fiber elements, catering to the evolving needs of modern network infrastructures. These technological improvements are helping armored fiber patch cables penetrate new application areas such as military communications, offshore oil installations, and renewable energy plants where rugged connectivity solutions are essential.

COMPETITIVE LANDSCAPE

Key Industry Players

Manufacturers Focus on Durable Solutions to Capture Growing Demand for Rugged Connectivity

The global armored fiber patch cables market features a competitive yet fragmented landscape, with established players and emerging specialists vying for market share. FS Tech has emerged as a market leader, leveraging its extensive manufacturing capabilities and comprehensive product portfolio spanning both single-mode and multi-mode armored solutions. The company’s strong presence across North America and Asia-Pacific contributes significantly to its dominant position.

Meanwhile, Thorlabs and Fibermart have carved substantial niches by specializing in high-performance armored cables tailored for industrial and laboratory applications. Both companies benefit from robust R&D investments that enable rapid adaptation to evolving industry standards, particularly in 5G infrastructure deployments.

The competitive landscape is further shaped by regional specialists like Jilin Fiber Cable Group in China and Eurotech in Europe, who are expanding globally through strategic partnerships. Notably, the top five players collectively accounted for approximately 35% of total market revenue in 2024, indicating significant growth opportunities for mid-sized competitors.

Market participants are increasingly differentiating themselves through vertical integration strategies. Companies such as Fibertronics are securing supply chains by acquiring component manufacturers, while others like OptoSpan are focusing on proprietary connector technologies to enhance cable durability and ease of installation.

List of Key Armored Fiber Patch Cable Manufacturers

Segment Analysis:

By Type

Single-mode Fiber Patch Cable Segment Leads Due to High Demand in Long-Distance Data Transmission

The market is segmented based on type into:

  • Single-mode Fiber Patch Cable
  • Multi-mode Fiber Patch Cable

By Application

Outdoor Segment Dominates Owing to Increased Deployment in Harsh Environments

The market is segmented based on application into:

  • Indoor
  • Outdoor

By End User

Telecommunication Sector Holds Largest Share Due to 5G Infrastructure Expansion

The market is segmented based on end user into:

  • Telecommunications
  • Data Centers
  • Military & Aerospace
  • Industrial
  • Others

By Armor Material

Steel-based Armored Cables Preferred for Superior Durability in Critical Applications

The market is segmented based on armor material into:

  • Steel Armored
  • Aluminum Armored
  • Others

Regional Analysis: Armored Fiber Patch Cables Market

North America
The North American armored fiber patch cables market is driven by robust demand from data centers, telecommunications, and industrial applications, where reliability and durability are critical. The U.S. accounts for the largest market share in the region, fueled by extensive 5G deployments and hyperscale data center expansions. Key players such as FS Tech and Fibertronics are actively innovating to meet stringent performance standards. However, high production costs and competition from non-armored alternatives remain challenges, particularly in price-sensitive segments. The region’s focus on cybersecurity and critical infrastructure protection further boosts demand for armored solutions.

Europe
Europe’s market benefits from stringent quality standards and growing investments in fiber-to-the-home (FTTH) deployments. Countries like Germany and the U.K. lead in adopting armored patch cables for both indoor and outdoor applications, particularly in smart city projects. The EU’s Digital Decade 2030 initiative, which emphasizes fiber-optic connectivity, supports long-term growth. However, environmental regulations on cable materials add complexity to product development. Local manufacturers, including Eurotech and Fibermart, are prioritizing sustainable designs while maintaining mechanical robustness to cater to diverse industrial needs.

Asia-Pacific
Asia-Pacific dominates global consumption, with China, Japan, and India driving demand due to rapid urbanization and massive data center construction. China’s “Broadband China” strategy accelerates fiber optic deployments, while India’s 5G rollout creates opportunities for armored cable suppliers. The region’s cost-competitive manufacturing ecosystem, led by companies like Huihong Technologies, supports high-volume production. Nevertheless, price sensitivity in emerging markets slows the adoption of premium armored solutions, favoring standardized products. Japan and South Korea, with their advanced IT infrastructure, remain exceptions, prioritizing high-performance armored cables for mission-critical applications.

South America
South America’s market is nascent but growing, with Brazil and Argentina investing in telecom infrastructure modernization. The lack of standardized regulations and economic instability, however, limits large-scale deployments. Armored cables are primarily used in industrial settings where harsh environments necessitate enhanced protection. Local players such as Jilin Fiber Cable Group are expanding distribution networks, but reliance on imports for advanced solutions persists. The gradual shift toward fiber-based networks in urban centers indicates long-term potential, though adoption rates lag behind other regions.

Middle East & Africa
The Middle East’s market is propelled by smart city initiatives (e.g., Saudi Arabia’s NEOM) and data center investments in the UAE. Armored cables are favored for their resilience in extreme climates, particularly in outdoor applications. Africa’s growth is uneven, with South Africa and Egypt spearheading fiber expansions, while broader adoption is hindered by limited infrastructure funding. Regional suppliers face challenges in balancing affordability with performance, though partnerships with global manufacturers like Thorlabs are helping bridge technology gaps. The lack of localized production remains a bottleneck for cost-sensitive markets.

Report Scope

This market research report provides a comprehensive analysis of the global and regional Armored Fiber Patch Cables markets, covering the forecast period 2024–2032. It offers detailed insights into market dynamics, technological advancements, competitive landscape, and key trends shaping the industry.

Key focus areas of the report include:

  • Market Size & Forecast: Historical data and future projections for revenue, unit shipments, and market value across major regions and segments. The global Armored Fiber Patch Cables market was valued at USD 1.2 billion in 2024 and is projected to reach USD 2.5 billion by 2032, growing at a CAGR of 8.7% during the forecast period.
  • Segmentation Analysis: Detailed breakdown by product type (single-mode and multi-mode fiber patch cables), application (indoor and outdoor), and end-user industries to identify high-growth segments and investment opportunities.
  • Regional Outlook: Insights into market performance across North America, Europe, Asia-Pacific, Latin America, and the Middle East & Africa, including country-level analysis. The U.S. market is estimated at USD 350 million in 2024, while China is projected to reach USD 580 million by 2032.
  • Competitive Landscape: Profiles of leading market participants including FS Tech, OptoSpan, Thorlabs, Fibermart, and Fibertronics, including their product portfolios, R&D investments, and strategic initiatives.
  • Technology Trends & Innovation: Assessment of emerging cable designs, materials innovation, and integration with next-generation networking technologies.
  • Market Drivers & Restraints: Evaluation of factors driving market growth such as 5G deployment and data center expansion, along with challenges including raw material price volatility.
  • Stakeholder Analysis: Insights for telecom operators, data center operators, system integrators, and investors regarding market opportunities and strategic positioning.

Primary and secondary research methods are employed, including interviews with industry experts, analysis of company financials, and validation through multiple data sources to ensure accuracy and reliability.

FREQUENTLY ASKED QUESTIONS:

What is the current market size of Global Armored Fiber Patch Cables Market?

-> Armored Fiber Patch Cables Market size was valued at US$ 578 million in 2024 and is projected to reach US$ 834 million by 2032, at a CAGR of 5.3% during the forecast period 2025-2032.

Which key companies operate in Global Armored Fiber Patch Cables Market?

-> Key players include FS Tech, OptoSpan, Thorlabs, Fibermart, Fibertronics, FiberTek, Eurotech, and Qualinet Technology, among others.

What are the key growth drivers?

-> Key growth drivers include 5G network deployments, data center expansion, and increasing demand for robust network infrastructure in harsh environments.

Which region dominates the market?

-> North America currently leads the market, while Asia-Pacific is projected to grow at the fastest CAGR of 10.2% during 2024-2032.

What are the emerging trends?

-> Emerging trends include development of ultra-thin armored cables, adoption of bend-insensitive fibers, and integration with high-density connectivity solutions.

Armored Fiber Patch Cables Market, Emerging Trends, Technological Advancements, and Business Strategies 2025-2032

Get Sample Report PDF for Exclusive Insights

Report Sample Includes

  • Table of Contents
  • List of Tables & Figures
  • Charts, Research Methodology, and more...
PDF Icon Download Sample Report PDF

Download Sample Report

Table of Content

1 Introduction to Research & Analysis Reports
1.1 Armored Fiber Patch Cables Market Definition
1.2 Market Segments
1.2.1 Segment by Type
1.2.2 Segment by Application
1.3 Global Armored Fiber Patch Cables Market Overview
1.4 Features & Benefits of This Report
1.5 Methodology & Sources of Information
1.5.1 Research Methodology
1.5.2 Research Process
1.5.3 Base Year
1.5.4 Report Assumptions & Caveats
2 Global Armored Fiber Patch Cables Overall Market Size
2.1 Global Armored Fiber Patch Cables Market Size: 2024 VS 2032
2.2 Global Armored Fiber Patch Cables Market Size, Prospects & Forecasts: 2020-2032
2.3 Global Armored Fiber Patch Cables Sales: 2020-2032
3 Company Landscape
3.1 Top Armored Fiber Patch Cables Players in Global Market
3.2 Top Global Armored Fiber Patch Cables Companies Ranked by Revenue
3.3 Global Armored Fiber Patch Cables Revenue by Companies
3.4 Global Armored Fiber Patch Cables Sales by Companies
3.5 Global Armored Fiber Patch Cables Price by Manufacturer (2020-2025)
3.6 Top 3 and Top 5 Armored Fiber Patch Cables Companies in Global Market, by Revenue in 2024
3.7 Global Manufacturers Armored Fiber Patch Cables Product Type
3.8 Tier 1, Tier 2, and Tier 3 Armored Fiber Patch Cables Players in Global Market
3.8.1 List of Global Tier 1 Armored Fiber Patch Cables Companies
3.8.2 List of Global Tier 2 and Tier 3 Armored Fiber Patch Cables Companies
4 Sights by Product
4.1 Overview
4.1.1 Segment by Type – Global Armored Fiber Patch Cables Market Size Markets, 2024 & 2032
4.1.2 Single-mode Fiber Patch Cable
4.1.3 Multi-mode Fiber Patch Cable
4.2 Segment by Type – Global Armored Fiber Patch Cables Revenue & Forecasts
4.2.1 Segment by Type – Global Armored Fiber Patch Cables Revenue, 2020-2025
4.2.2 Segment by Type – Global Armored Fiber Patch Cables Revenue, 2026-2032
4.2.3 Segment by Type – Global Armored Fiber Patch Cables Revenue Market Share, 2020-2032
4.3 Segment by Type – Global Armored Fiber Patch Cables Sales & Forecasts
4.3.1 Segment by Type – Global Armored Fiber Patch Cables Sales, 2020-2025
4.3.2 Segment by Type – Global Armored Fiber Patch Cables Sales, 2026-2032
4.3.3 Segment by Type – Global Armored Fiber Patch Cables Sales Market Share, 2020-2032
4.4 Segment by Type – Global Armored Fiber Patch Cables Price (Manufacturers Selling Prices), 2020-2032
5 Sights by Application
5.1 Overview
5.1.1 Segment by Application – Global Armored Fiber Patch Cables Market Size, 2024 & 2032
5.1.2 Indoor
5.1.3 Outdoor
5.2 Segment by Application – Global Armored Fiber Patch Cables Revenue & Forecasts
5.2.1 Segment by Application – Global Armored Fiber Patch Cables Revenue, 2020-2025
5.2.2 Segment by Application – Global Armored Fiber Patch Cables Revenue, 2026-2032
5.2.3 Segment by Application – Global Armored Fiber Patch Cables Revenue Market Share, 2020-2032
5.3 Segment by Application – Global Armored Fiber Patch Cables Sales & Forecasts
5.3.1 Segment by Application – Global Armored Fiber Patch Cables Sales, 2020-2025
5.3.2 Segment by Application – Global Armored Fiber Patch Cables Sales, 2026-2032
5.3.3 Segment by Application – Global Armored Fiber Patch Cables Sales Market Share, 2020-2032
5.4 Segment by Application – Global Armored Fiber Patch Cables Price (Manufacturers Selling Prices), 2020-2032
6 Sights by Region
6.1 By Region – Global Armored Fiber Patch Cables Market Size, 2024 & 2032
6.2 By Region – Global Armored Fiber Patch Cables Revenue & Forecasts
6.2.1 By Region – Global Armored Fiber Patch Cables Revenue, 2020-2025
6.2.2 By Region – Global Armored Fiber Patch Cables Revenue, 2026-2032
6.2.3 By Region – Global Armored Fiber Patch Cables Revenue Market Share, 2020-2032
6.3 By Region – Global Armored Fiber Patch Cables Sales & Forecasts
6.3.1 By Region – Global Armored Fiber Patch Cables Sales, 2020-2025
6.3.2 By Region – Global Armored Fiber Patch Cables Sales, 2026-2032
6.3.3 By Region – Global Armored Fiber Patch Cables Sales Market Share, 2020-2032
6.4 North America
6.4.1 By Country – North America Armored Fiber Patch Cables Revenue, 2020-2032
6.4.2 By Country – North America Armored Fiber Patch Cables Sales, 2020-2032
6.4.3 United States Armored Fiber Patch Cables Market Size, 2020-2032
6.4.4 Canada Armored Fiber Patch Cables Market Size, 2020-2032
6.4.5 Mexico Armored Fiber Patch Cables Market Size, 2020-2032
6.5 Europe
6.5.1 By Country – Europe Armored Fiber Patch Cables Revenue, 2020-2032
6.5.2 By Country – Europe Armored Fiber Patch Cables Sales, 2020-2032
6.5.3 Germany Armored Fiber Patch Cables Market Size, 2020-2032
6.5.4 France Armored Fiber Patch Cables Market Size, 2020-2032
6.5.5 U.K. Armored Fiber Patch Cables Market Size, 2020-2032
6.5.6 Italy Armored Fiber Patch Cables Market Size, 2020-2032
6.5.7 Russia Armored Fiber Patch Cables Market Size, 2020-2032
6.5.8 Nordic Countries Armored Fiber Patch Cables Market Size, 2020-2032
6.5.9 Benelux Armored Fiber Patch Cables Market Size, 2020-2032
6.6 Asia
6.6.1 By Region – Asia Armored Fiber Patch Cables Revenue, 2020-2032
6.6.2 By Region – Asia Armored Fiber Patch Cables Sales, 2020-2032
6.6.3 China Armored Fiber Patch Cables Market Size, 2020-2032
6.6.4 Japan Armored Fiber Patch Cables Market Size, 2020-2032
6.6.5 South Korea Armored Fiber Patch Cables Market Size, 2020-2032
6.6.6 Southeast Asia Armored Fiber Patch Cables Market Size, 2020-2032
6.6.7 India Armored Fiber Patch Cables Market Size, 2020-2032
6.7 South America
6.7.1 By Country – South America Armored Fiber Patch Cables Revenue, 2020-2032
6.7.2 By Country – South America Armored Fiber Patch Cables Sales, 2020-2032
6.7.3 Brazil Armored Fiber Patch Cables Market Size, 2020-2032
6.7.4 Argentina Armored Fiber Patch Cables Market Size, 2020-2032
6.8 Middle East & Africa
6.8.1 By Country – Middle East & Africa Armored Fiber Patch Cables Revenue, 2020-2032
6.8.2 By Country – Middle East & Africa Armored Fiber Patch Cables Sales, 2020-2032
6.8.3 Turkey Armored Fiber Patch Cables Market Size, 2020-2032
6.8.4 Israel Armored Fiber Patch Cables Market Size, 2020-2032
6.8.5 Saudi Arabia Armored Fiber Patch Cables Market Size, 2020-2032
6.8.6 UAE Armored Fiber Patch Cables Market Size, 2020-2032
7 Manufacturers & Brands Profiles
7.1 FS Tech
7.1.1 FS Tech Company Summary
7.1.2 FS Tech Business Overview
7.1.3 FS Tech Armored Fiber Patch Cables Major Product Offerings
7.1.4 FS Tech Armored Fiber Patch Cables Sales and Revenue in Global (2020-2025)
7.1.5 FS Tech Key News & Latest Developments
7.2 OptoSpan
7.2.1 OptoSpan Company Summary
7.2.2 OptoSpan Business Overview
7.2.3 OptoSpan Armored Fiber Patch Cables Major Product Offerings
7.2.4 OptoSpan Armored Fiber Patch Cables Sales and Revenue in Global (2020-2025)
7.2.5 OptoSpan Key News & Latest Developments
7.3 Thorlabs
7.3.1 Thorlabs Company Summary
7.3.2 Thorlabs Business Overview
7.3.3 Thorlabs Armored Fiber Patch Cables Major Product Offerings
7.3.4 Thorlabs Armored Fiber Patch Cables Sales and Revenue in Global (2020-2025)
7.3.5 Thorlabs Key News & Latest Developments
7.4 Fibermart
7.4.1 Fibermart Company Summary
7.4.2 Fibermart Business Overview
7.4.3 Fibermart Armored Fiber Patch Cables Major Product Offerings
7.4.4 Fibermart Armored Fiber Patch Cables Sales and Revenue in Global (2020-2025)
7.4.5 Fibermart Key News & Latest Developments
7.5 Fibertronics
7.5.1 Fibertronics Company Summary
7.5.2 Fibertronics Business Overview
7.5.3 Fibertronics Armored Fiber Patch Cables Major Product Offerings
7.5.4 Fibertronics Armored Fiber Patch Cables Sales and Revenue in Global (2020-2025)
7.5.5 Fibertronics Key News & Latest Developments
7.6 FiberTek
7.6.1 FiberTek Company Summary
7.6.2 FiberTek Business Overview
7.6.3 FiberTek Armored Fiber Patch Cables Major Product Offerings
7.6.4 FiberTek Armored Fiber Patch Cables Sales and Revenue in Global (2020-2025)
7.6.5 FiberTek Key News & Latest Developments
7.7 Eurotech
7.7.1 Eurotech Company Summary
7.7.2 Eurotech Business Overview
7.7.3 Eurotech Armored Fiber Patch Cables Major Product Offerings
7.7.4 Eurotech Armored Fiber Patch Cables Sales and Revenue in Global (2020-2025)
7.7.5 Eurotech Key News & Latest Developments
7.8 Qualinet Technology
7.8.1 Qualinet Technology Company Summary
7.8.2 Qualinet Technology Business Overview
7.8.3 Qualinet Technology Armored Fiber Patch Cables Major Product Offerings
7.8.4 Qualinet Technology Armored Fiber Patch Cables Sales and Revenue in Global (2020-2025)
7.8.5 Qualinet Technology Key News & Latest Developments
7.9 Jilin Fiber Cable Group
7.9.1 Jilin Fiber Cable Group Company Summary
7.9.2 Jilin Fiber Cable Group Business Overview
7.9.3 Jilin Fiber Cable Group Armored Fiber Patch Cables Major Product Offerings
7.9.4 Jilin Fiber Cable Group Armored Fiber Patch Cables Sales and Revenue in Global (2020-2025)
7.9.5 Jilin Fiber Cable Group Key News & Latest Developments
7.10 Huihong Technologies
7.10.1 Huihong Technologies Company Summary
7.10.2 Huihong Technologies Business Overview
7.10.3 Huihong Technologies Armored Fiber Patch Cables Major Product Offerings
7.10.4 Huihong Technologies Armored Fiber Patch Cables Sales and Revenue in Global (2020-2025)
7.10.5 Huihong Technologies Key News & Latest Developments
8 Global Armored Fiber Patch Cables Production Capacity, Analysis
8.1 Global Armored Fiber Patch Cables Production Capacity, 2020-2032
8.2 Armored Fiber Patch Cables Production Capacity of Key Manufacturers in Global Market
8.3 Global Armored Fiber Patch Cables Production by Region
9 Key Market Trends, Opportunity, Drivers and Restraints
9.1 Market Opportunities & Trends
9.2 Market Drivers
9.3 Market Restraints
10 Armored Fiber Patch Cables Supply Chain Analysis
10.1 Armored Fiber Patch Cables Industry Value Chain
10.2 Armored Fiber Patch Cables Upstream Market
10.3 Armored Fiber Patch Cables Downstream and Clients
10.4 Marketing Channels Analysis
10.4.1 Marketing Channels
10.4.2 Armored Fiber Patch Cables Distributors and Sales Agents in Global
11 Conclusion
12 Appendix
12.1 Note
12.2 Examples of Clients
12.3 DisclaimerList of Tables
Table 1. Key Players of Armored Fiber Patch Cables in Global Market
Table 2. Top Armored Fiber Patch Cables Players in Global Market, Ranking by Revenue (2024)
Table 3. Global Armored Fiber Patch Cables Revenue by Companies, (US$, Mn), 2020-2025
Table 4. Global Armored Fiber Patch Cables Revenue Share by Companies, 2020-2025
Table 5. Global Armored Fiber Patch Cables Sales by Companies, (KM), 2020-2025
Table 6. Global Armored Fiber Patch Cables Sales Share by Companies, 2020-2025
Table 7. Key Manufacturers Armored Fiber Patch Cables Price (2020-2025) & (US$/M)
Table 8. Global Manufacturers Armored Fiber Patch Cables Product Type
Table 9. List of Global Tier 1 Armored Fiber Patch Cables Companies, Revenue (US$, Mn) in 2024 and Market Share
Table 10. List of Global Tier 2 and Tier 3 Armored Fiber Patch Cables Companies, Revenue (US$, Mn) in 2024 and Market Share
Table 11. Segment by Type – Global Armored Fiber Patch Cables Revenue, (US$, Mn), 2024 & 2032
Table 12. Segment by Type – Global Armored Fiber Patch Cables Revenue (US$, Mn), 2020-2025
Table 13. Segment by Type – Global Armored Fiber Patch Cables Revenue (US$, Mn), 2026-2032
Table 14. Segment by Type – Global Armored Fiber Patch Cables Sales (KM), 2020-2025
Table 15. Segment by Type – Global Armored Fiber Patch Cables Sales (KM), 2026-2032
Table 16. Segment by Application – Global Armored Fiber Patch Cables Revenue, (US$, Mn), 2024 & 2032
Table 17. Segment by Application – Global Armored Fiber Patch Cables Revenue, (US$, Mn), 2020-2025
Table 18. Segment by Application – Global Armored Fiber Patch Cables Revenue, (US$, Mn), 2026-2032
Table 19. Segment by Application – Global Armored Fiber Patch Cables Sales, (KM), 2020-2025
Table 20. Segment by Application – Global Armored Fiber Patch Cables Sales, (KM), 2026-2032
Table 21. By Region – Global Armored Fiber Patch Cables Revenue, (US$, Mn), 2025-2032
Table 22. By Region – Global Armored Fiber Patch Cables Revenue, (US$, Mn), 2020-2025
Table 23. By Region – Global Armored Fiber Patch Cables Revenue, (US$, Mn), 2026-2032
Table 24. By Region – Global Armored Fiber Patch Cables Sales, (KM), 2020-2025
Table 25. By Region – Global Armored Fiber Patch Cables Sales, (KM), 2026-2032
Table 26. By Country – North America Armored Fiber Patch Cables Revenue, (US$, Mn), 2020-2025
Table 27. By Country – North America Armored Fiber Patch Cables Revenue, (US$, Mn), 2026-2032
Table 28. By Country – North America Armored Fiber Patch Cables Sales, (KM), 2020-2025
Table 29. By Country – North America Armored Fiber Patch Cables Sales, (KM), 2026-2032
Table 30. By Country – Europe Armored Fiber Patch Cables Revenue, (US$, Mn), 2020-2025
Table 31. By Country – Europe Armored Fiber Patch Cables Revenue, (US$, Mn), 2026-2032
Table 32. By Country – Europe Armored Fiber Patch Cables Sales, (KM), 2020-2025
Table 33. By Country – Europe Armored Fiber Patch Cables Sales, (KM), 2026-2032
Table 34. By Region – Asia Armored Fiber Patch Cables Revenue, (US$, Mn), 2020-2025
Table 35. By Region – Asia Armored Fiber Patch Cables Revenue, (US$, Mn), 2026-2032
Table 36. By Region – Asia Armored Fiber Patch Cables Sales, (KM), 2020-2025
Table 37. By Region – Asia Armored Fiber Patch Cables Sales, (KM), 2026-2032
Table 38. By Country – South America Armored Fiber Patch Cables Revenue, (US$, Mn), 2020-2025
Table 39. By Country – South America Armored Fiber Patch Cables Revenue, (US$, Mn), 2026-2032
Table 40. By Country – South America Armored Fiber Patch Cables Sales, (KM), 2020-2025
Table 41. By Country – South America Armored Fiber Patch Cables Sales, (KM), 2026-2032
Table 42. By Country – Middle East & Africa Armored Fiber Patch Cables Revenue, (US$, Mn), 2020-2025
Table 43. By Country – Middle East & Africa Armored Fiber Patch Cables Revenue, (US$, Mn), 2026-2032
Table 44. By Country – Middle East & Africa Armored Fiber Patch Cables Sales, (KM), 2020-2025
Table 45. By Country – Middle East & Africa Armored Fiber Patch Cables Sales, (KM), 2026-2032
Table 46. FS Tech Company Summary
Table 47. FS Tech Armored Fiber Patch Cables Product Offerings
Table 48. FS Tech Armored Fiber Patch Cables Sales (KM), Revenue (US$, Mn) and Average Price (US$/M) & (2020-2025)
Table 49. FS Tech Key News & Latest Developments
Table 50. OptoSpan Company Summary
Table 51. OptoSpan Armored Fiber Patch Cables Product Offerings
Table 52. OptoSpan Armored Fiber Patch Cables Sales (KM), Revenue (US$, Mn) and Average Price (US$/M) & (2020-2025)
Table 53. OptoSpan Key News & Latest Developments
Table 54. Thorlabs Company Summary
Table 55. Thorlabs Armored Fiber Patch Cables Product Offerings
Table 56. Thorlabs Armored Fiber Patch Cables Sales (KM), Revenue (US$, Mn) and Average Price (US$/M) & (2020-2025)
Table 57. Thorlabs Key News & Latest Developments
Table 58. Fibermart Company Summary
Table 59. Fibermart Armored Fiber Patch Cables Product Offerings
Table 60. Fibermart Armored Fiber Patch Cables Sales (KM), Revenue (US$, Mn) and Average Price (US$/M) & (2020-2025)
Table 61. Fibermart Key News & Latest Developments
Table 62. Fibertronics Company Summary
Table 63. Fibertronics Armored Fiber Patch Cables Product Offerings
Table 64. Fibertronics Armored Fiber Patch Cables Sales (KM), Revenue (US$, Mn) and Average Price (US$/M) & (2020-2025)
Table 65. Fibertronics Key News & Latest Developments
Table 66. FiberTek Company Summary
Table 67. FiberTek Armored Fiber Patch Cables Product Offerings
Table 68. FiberTek Armored Fiber Patch Cables Sales (KM), Revenue (US$, Mn) and Average Price (US$/M) & (2020-2025)
Table 69. FiberTek Key News & Latest Developments
Table 70. Eurotech Company Summary
Table 71. Eurotech Armored Fiber Patch Cables Product Offerings
Table 72. Eurotech Armored Fiber Patch Cables Sales (KM), Revenue (US$, Mn) and Average Price (US$/M) & (2020-2025)
Table 73. Eurotech Key News & Latest Developments
Table 74. Qualinet Technology Company Summary
Table 75. Qualinet Technology Armored Fiber Patch Cables Product Offerings
Table 76. Qualinet Technology Armored Fiber Patch Cables Sales (KM), Revenue (US$, Mn) and Average Price (US$/M) & (2020-2025)
Table 77. Qualinet Technology Key News & Latest Developments
Table 78. Jilin Fiber Cable Group Company Summary
Table 79. Jilin Fiber Cable Group Armored Fiber Patch Cables Product Offerings
Table 80. Jilin Fiber Cable Group Armored Fiber Patch Cables Sales (KM), Revenue (US$, Mn) and Average Price (US$/M) & (2020-2025)
Table 81. Jilin Fiber Cable Group Key News & Latest Developments
Table 82. Huihong Technologies Company Summary
Table 83. Huihong Technologies Armored Fiber Patch Cables Product Offerings
Table 84. Huihong Technologies Armored Fiber Patch Cables Sales (KM), Revenue (US$, Mn) and Average Price (US$/M) & (2020-2025)
Table 85. Huihong Technologies Key News & Latest Developments
Table 86. Armored Fiber Patch Cables Capacity of Key Manufacturers in Global Market, 2023-2025 (KM)
Table 87. Global Armored Fiber Patch Cables Capacity Market Share of Key Manufacturers, 2023-2025
Table 88. Global Armored Fiber Patch Cables Production by Region, 2020-2025 (KM)
Table 89. Global Armored Fiber Patch Cables Production by Region, 2026-2032 (KM)
Table 90. Armored Fiber Patch Cables Market Opportunities & Trends in Global Market
Table 91. Armored Fiber Patch Cables Market Drivers in Global Market
Table 92. Armored Fiber Patch Cables Market Restraints in Global Market
Table 93. Armored Fiber Patch Cables Raw Materials
Table 94. Armored Fiber Patch Cables Raw Materials Suppliers in Global Market
Table 95. Typical Armored Fiber Patch Cables Downstream
Table 96. Armored Fiber Patch Cables Downstream Clients in Global Market
Table 97. Armored Fiber Patch Cables Distributors and Sales Agents in Global Market

List of Figures
Figure 1. Armored Fiber Patch Cables Product Picture
Figure 2. Armored Fiber Patch Cables Segment by Type in 2024
Figure 3. Armored Fiber Patch Cables Segment by Application in 2024
Figure 4. Global Armored Fiber Patch Cables Market Overview: 2024
Figure 5. Key Caveats
Figure 6. Global Armored Fiber Patch Cables Market Size: 2024 VS 2032 (US$, Mn)
Figure 7. Global Armored Fiber Patch Cables Revenue: 2020-2032 (US$, Mn)
Figure 8. Armored Fiber Patch Cables Sales in Global Market: 2020-2032 (KM)
Figure 9. The Top 3 and 5 Players Market Share by Armored Fiber Patch Cables Revenue in 2024
Figure 10. Segment by Type – Global Armored Fiber Patch Cables Revenue, (US$, Mn), 2024 & 2032
Figure 11. Segment by Type – Global Armored Fiber Patch Cables Revenue Market Share, 2020-2032
Figure 12. Segment by Type – Global Armored Fiber Patch Cables Sales Market Share, 2020-2032
Figure 13. Segment by Type – Global Armored Fiber Patch Cables Price (US$/M), 2020-2032
Figure 14. Segment by Application – Global Armored Fiber Patch Cables Revenue, (US$, Mn), 2024 & 2032
Figure 15. Segment by Application – Global Armored Fiber Patch Cables Revenue Market Share, 2020-2032
Figure 16. Segment by Application – Global Armored Fiber Patch Cables Sales Market Share, 2020-2032
Figure 17. Segment by Application -Global Armored Fiber Patch Cables Price (US$/M), 2020-2032
Figure 18. By Region – Global Armored Fiber Patch Cables Revenue, (US$, Mn), 2025 & 2032
Figure 19. By Region – Global Armored Fiber Patch Cables Revenue Market Share, 2020 VS 2024 VS 2032
Figure 20. By Region – Global Armored Fiber Patch Cables Revenue Market Share, 2020-2032
Figure 21. By Region – Global Armored Fiber Patch Cables Sales Market Share, 2020-2032
Figure 22. By Country – North America Armored Fiber Patch Cables Revenue Market Share, 2020-2032
Figure 23. By Country – North America Armored Fiber Patch Cables Sales Market Share, 2020-2032
Figure 24. United States Armored Fiber Patch Cables Revenue, (US$, Mn), 2020-2032
Figure 25. Canada Armored Fiber Patch Cables Revenue, (US$, Mn), 2020-2032
Figure 26. Mexico Armored Fiber Patch Cables Revenue, (US$, Mn), 2020-2032
Figure 27. By Country – Europe Armored Fiber Patch Cables Revenue Market Share, 2020-2032
Figure 28. By Country – Europe Armored Fiber Patch Cables Sales Market Share, 2020-2032
Figure 29. Germany Armored Fiber Patch Cables Revenue, (US$, Mn), 2020-2032
Figure 30. France Armored Fiber Patch Cables Revenue, (US$, Mn), 2020-2032
Figure 31. U.K. Armored Fiber Patch Cables Revenue, (US$, Mn), 2020-2032
Figure 32. Italy Armored Fiber Patch Cables Revenue, (US$, Mn), 2020-2032
Figure 33. Russia Armored Fiber Patch Cables Revenue, (US$, Mn), 2020-2032
Figure 34. Nordic Countries Armored Fiber Patch Cables Revenue, (US$, Mn), 2020-2032
Figure 35. Benelux Armored Fiber Patch Cables Revenue, (US$, Mn), 2020-2032
Figure 36. By Region – Asia Armored Fiber Patch Cables Revenue Market Share, 2020-2032
Figure 37. By Region – Asia Armored Fiber Patch Cables Sales Market Share, 2020-2032
Figure 38. China Armored Fiber Patch Cables Revenue, (US$, Mn), 2020-2032
Figure 39. Japan Armored Fiber Patch Cables Revenue, (US$, Mn), 2020-2032
Figure 40. South Korea Armored Fiber Patch Cables Revenue, (US$, Mn), 2020-2032
Figure 41. Southeast Asia Armored Fiber Patch Cables Revenue, (US$, Mn), 2020-2032
Figure 42. India Armored Fiber Patch Cables Revenue, (US$, Mn), 2020-2032
Figure 43. By Country – South America Armored Fiber Patch Cables Revenue Market Share, 2020-2032
Figure 44. By Country – South America Armored Fiber Patch Cables Sales, Market Share, 2020-2032
Figure 45. Brazil Armored Fiber Patch Cables Revenue, (US$, Mn), 2020-2032
Figure 46. Argentina Armored Fiber Patch Cables Revenue, (US$, Mn), 2020-2032
Figure 47. By Country – Middle East & Africa Armored Fiber Patch Cables Revenue, Market Share, 2020-2032
Figure 48. By Country – Middle East & Africa Armored Fiber Patch Cables Sales, Market Share, 2020-2032
Figure 49. Turkey Armored Fiber Patch Cables Revenue, (US$, Mn), 2020-2032
Figure 50. Israel Armored Fiber Patch Cables Revenue, (US$, Mn), 2020-2032
Figure 51. Saudi Arabia Armored Fiber Patch Cables Revenue, (US$, Mn), 2020-2032
Figure 52. UAE Armored Fiber Patch Cables Revenue, (US$, Mn), 2020-2032
Figure 53. Global Armored Fiber Patch Cables Production Capacity (KM), 2020-2032
Figure 54. The Percentage of Production Armored Fiber Patch Cables by Region, 2024 VS 2032
Figure 55. Armored Fiber Patch Cables Industry Value Chain
Figure 56. Marketing Channels