1 Introduction to Research & Analysis Reports
1.1 AI Edge Inference Boxes Market Definition
1.2 Market Segments
1.2.1 Segment by Type
1.2.2 Segment by Scenario
1.2.3 Segment by Application
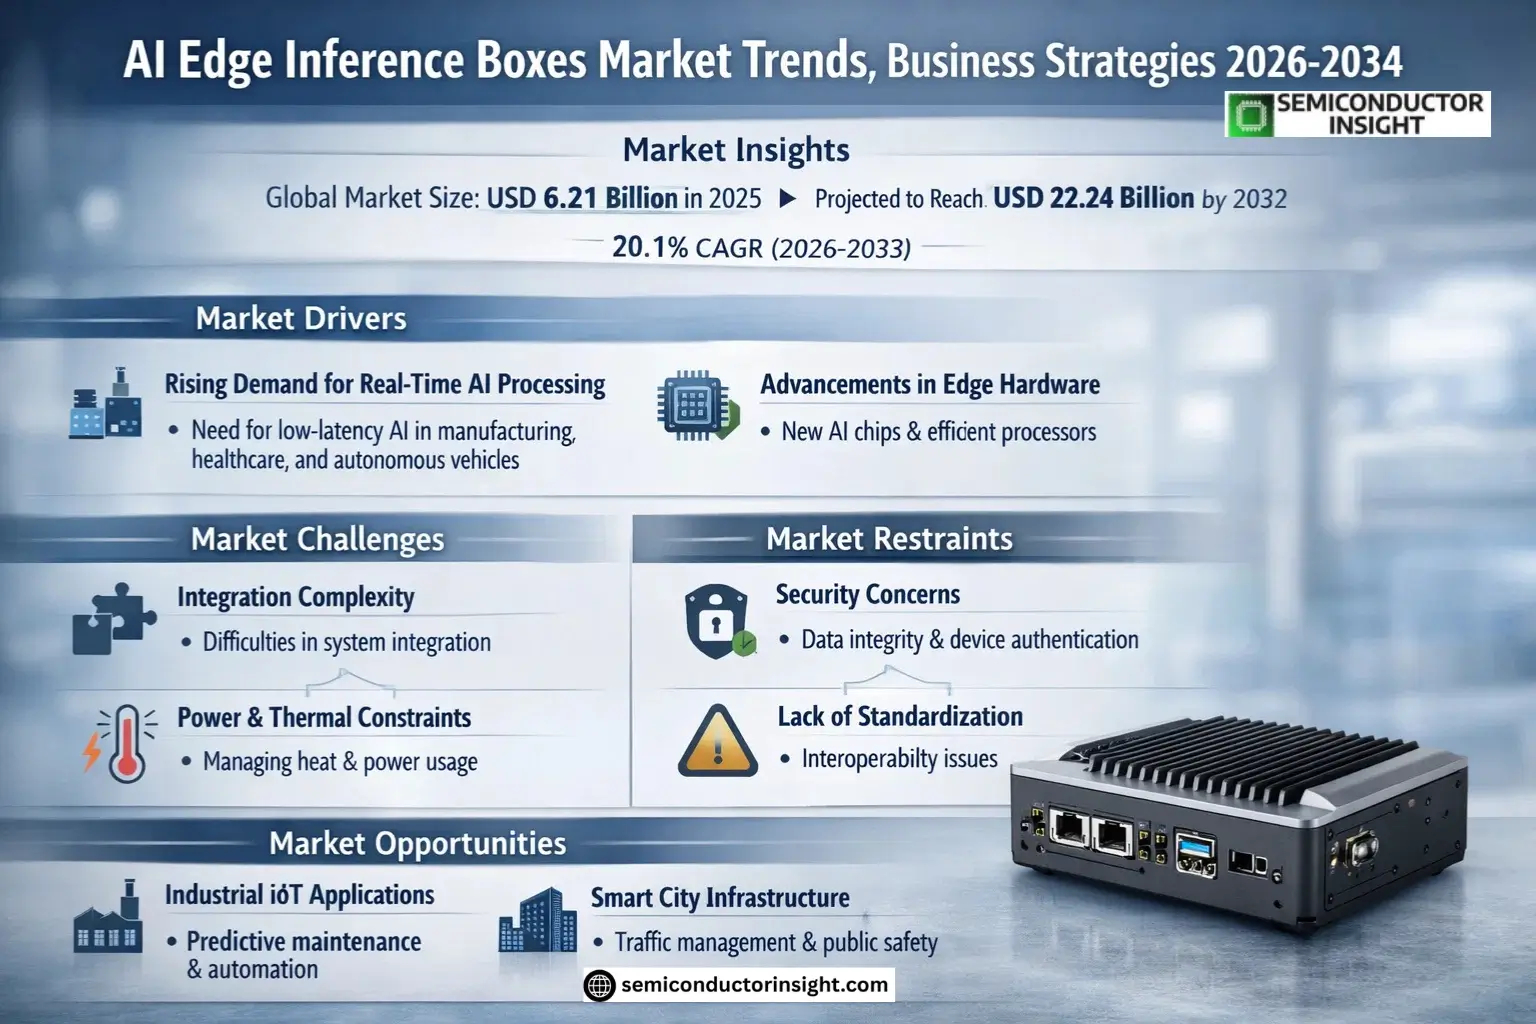
1.3 Global AI Edge Inference Boxes Market Overview
1.4 Features & Benefits of This Report
1.5 Methodology & Sources of Information
1.5.1 Research Methodology
1.5.2 Research Process
1.5.3 Base Year
1.5.4 Report Assumptions & Caveats
2 Global AI Edge Inference Boxes Overall Market Size
2.1 Global AI Edge Inference Boxes Market Size: 2025 VS 2032
2.2 Global AI Edge Inference Boxes Market Size, Prospects & Forecasts: 2021-2032
2.3 Global AI Edge Inference Boxes Sales: 2021-2032
3 Company Landscape
3.1 Top AI Edge Inference Boxes Players in Global Market
3.2 Top Global AI Edge Inference Boxes Companies Ranked by Revenue
3.3 Global AI Edge Inference Boxes Revenue by Companies
3.4 Global AI Edge Inference Boxes Sales by Companies
3.5 Global AI Edge Inference Boxes Price by Manufacturer (2021-2026)
3.6 Top 3 and Top 5 AI Edge Inference Boxes Companies in Global Market, by Revenue in 2025
3.7 Global Manufacturers AI Edge Inference Boxes Product Type
3.8 Tier 1, Tier 2, and Tier 3 AI Edge Inference Boxes Players in Global Market
3.8.1 List of Global Tier 1 AI Edge Inference Boxes Companies
3.8.2 List of Global Tier 2 and Tier 3 AI Edge Inference Boxes Companies
4 Sights by Type
4.1 Overview
4.1.1 Segment by Type – Global AI Edge Inference Boxes Market Size Markets, 2025 & 2032
4.1.2 CPU-based
4.1.3 GPU-based
4.1.4 NPU/TPU/VPU-based
4.1.5 FPGA-based
4.1.6 Others
4.2 Segment by Type – Global AI Edge Inference Boxes Revenue & Forecasts
4.2.1 Segment by Type – Global AI Edge Inference Boxes Revenue, 2021-2026
4.2.2 Segment by Type – Global AI Edge Inference Boxes Revenue, 2027-2032
4.2.3 Segment by Type – Global AI Edge Inference Boxes Revenue Market Share, 2021-2032
4.3 Segment by Type – Global AI Edge Inference Boxes Sales & Forecasts
4.3.1 Segment by Type – Global AI Edge Inference Boxes Sales, 2021-2026
4.3.2 Segment by Type – Global AI Edge Inference Boxes Sales, 2027-2032
4.3.3 Segment by Type – Global AI Edge Inference Boxes Sales Market Share, 2021-2032
4.4 Segment by Type – Global AI Edge Inference Boxes Price (Manufacturers Selling Prices), 2021-2032
5 Sights by Scenario
5.1 Overview
5.1.1 Segment by Scenario – Global AI Edge Inference Boxes Market Size Markets, 2025 & 2032
5.1.2 Video Analytics
5.1.3 Industrial/Automation
5.1.4 Robotics/Autonomous Systems
5.1.5 Smart Retail
5.1.6 Others
5.2 Segment by Scenario – Global AI Edge Inference Boxes Revenue & Forecasts
5.2.1 Segment by Scenario – Global AI Edge Inference Boxes Revenue, 2021-2026
5.2.2 Segment by Scenario – Global AI Edge Inference Boxes Revenue, 2027-2032
5.2.3 Segment by Scenario – Global AI Edge Inference Boxes Revenue Market Share, 2021-2032
5.3 Segment by Scenario – Global AI Edge Inference Boxes Sales & Forecasts
5.3.1 Segment by Scenario – Global AI Edge Inference Boxes Sales, 2021-2026
5.3.2 Segment by Scenario – Global AI Edge Inference Boxes Sales, 2027-2032
5.3.3 Segment by Scenario – Global AI Edge Inference Boxes Sales Market Share, 2021-2032
5.4 Segment by Scenario – Global AI Edge Inference Boxes Price (Manufacturers Selling Prices), 2021-2032
6 Sights by Application
6.1 Overview
6.1.1 Segment by Application – Global AI Edge Inference Boxes Market Size, 2025 & 2032
6.1.2 Video Surveillance Analytics
6.1.3 Industrial Defect Detection
6.1.4 Traffic and License-plate Recognition
6.1.5 Retail Customer and Shelf Analytics
6.1.6 Robotics Vision and Navigation
6.2 Segment by Application – Global AI Edge Inference Boxes Revenue & Forecasts
6.2.1 Segment by Application – Global AI Edge Inference Boxes Revenue, 2021-2026
6.2.2 Segment by Application – Global AI Edge Inference Boxes Revenue, 2027-2032
6.2.3 Segment by Application – Global AI Edge Inference Boxes Revenue Market Share, 2021-2032
6.3 Segment by Application – Global AI Edge Inference Boxes Sales & Forecasts
6.3.1 Segment by Application – Global AI Edge Inference Boxes Sales, 2021-2026
6.3.2 Segment by Application – Global AI Edge Inference Boxes Sales, 2027-2032
6.3.3 Segment by Application – Global AI Edge Inference Boxes Sales Market Share, 2021-2032
6.4 Segment by Application – Global AI Edge Inference Boxes Price (Manufacturers Selling Prices), 2021-2032
7 Sights Region
7.1 By Region – Global AI Edge Inference Boxes Market Size, 2025 & 2032
7.2 By Region – Global AI Edge Inference Boxes Revenue & Forecasts
7.2.1 By Region – Global AI Edge Inference Boxes Revenue, 2021-2026
7.2.2 By Region – Global AI Edge Inference Boxes Revenue, 2027-2032
7.2.3 By Region – Global AI Edge Inference Boxes Revenue Market Share, 2021-2032
7.3 By Region – Global AI Edge Inference Boxes Sales & Forecasts
7.3.1 By Region – Global AI Edge Inference Boxes Sales, 2021-2026
7.3.2 By Region – Global AI Edge Inference Boxes Sales, 2027-2032
7.3.3 By Region – Global AI Edge Inference Boxes Sales Market Share, 2021-2032
7.4 North America
7.4.1 By Country – North America AI Edge Inference Boxes Revenue, 2021-2032
7.4.2 By Country – North America AI Edge Inference Boxes Sales, 2021-2032
7.4.3 United States AI Edge Inference Boxes Market Size, 2021-2032
7.4.4 Canada AI Edge Inference Boxes Market Size, 2021-2032
7.4.5 Mexico AI Edge Inference Boxes Market Size, 2021-2032
7.5 Europe
7.5.1 By Country – Europe AI Edge Inference Boxes Revenue, 2021-2032
7.5.2 By Country – Europe AI Edge Inference Boxes Sales, 2021-2032
7.5.3 Germany AI Edge Inference Boxes Market Size, 2021-2032
7.5.4 France AI Edge Inference Boxes Market Size, 2021-2032
7.5.5 U.K. AI Edge Inference Boxes Market Size, 2021-2032
7.5.6 Italy AI Edge Inference Boxes Market Size, 2021-2032
7.5.7 Russia AI Edge Inference Boxes Market Size, 2021-2032
7.5.8 Nordic Countries AI Edge Inference Boxes Market Size, 2021-2032
7.5.9 Benelux AI Edge Inference Boxes Market Size, 2021-2032
7.6 Asia
7.6.1 By Region – Asia AI Edge Inference Boxes Revenue, 2021-2032
7.6.2 By Region – Asia AI Edge Inference Boxes Sales, 2021-2032
7.6.3 China AI Edge Inference Boxes Market Size, 2021-2032
7.6.4 Japan AI Edge Inference Boxes Market Size, 2021-2032
7.6.5 South Korea AI Edge Inference Boxes Market Size, 2021-2032
7.6.6 Southeast Asia AI Edge Inference Boxes Market Size, 2021-2032
7.6.7 India AI Edge Inference Boxes Market Size, 2021-2032
7.7 South America
7.7.1 By Country – South America AI Edge Inference Boxes Revenue, 2021-2032
7.7.2 By Country – South America AI Edge Inference Boxes Sales, 2021-2032
7.7.3 Brazil AI Edge Inference Boxes Market Size, 2021-2032
7.7.4 Argentina AI Edge Inference Boxes Market Size, 2021-2032
7.8 Middle East & Africa
7.8.1 By Country – Middle East & Africa AI Edge Inference Boxes Revenue, 2021-2032
7.8.2 By Country – Middle East & Africa AI Edge Inference Boxes Sales, 2021-2032
7.8.3 Turkey AI Edge Inference Boxes Market Size, 2021-2032
7.8.4 Israel AI Edge Inference Boxes Market Size, 2021-2032
7.8.5 Saudi Arabia AI Edge Inference Boxes Market Size, 2021-2032
7.8.6 UAE AI Edge Inference Boxes Market Size, 2021-2032
8 Manufacturers & Brands Profiles
8.1 NVIDIA
8.1.1 NVIDIA Company Summary
8.1.2 NVIDIA Business Overview
8.1.3 NVIDIA AI Edge Inference Boxes Major Product Offerings
8.1.4 NVIDIA AI Edge Inference Boxes Sales and Revenue in Global (2021-2026)
8.1.5 NVIDIA Key News & Latest Developments
8.2 Intel
8.2.1 Intel Company Summary
8.2.2 Intel Business Overview
8.2.3 Intel AI Edge Inference Boxes Major Product Offerings
8.2.4 Intel AI Edge Inference Boxes Sales and Revenue in Global (2021-2026)
8.2.5 Intel Key News & Latest Developments
8.3 Qualcomm
8.3.1 Qualcomm Company Summary
8.3.2 Qualcomm Business Overview
8.3.3 Qualcomm AI Edge Inference Boxes Major Product Offerings
8.3.4 Qualcomm AI Edge Inference Boxes Sales and Revenue in Global (2021-2026)
8.3.5 Qualcomm Key News & Latest Developments
8.4 AMD
8.4.1 AMD Company Summary
8.4.2 AMD Business Overview
8.4.3 AMD AI Edge Inference Boxes Major Product Offerings
8.4.4 AMD AI Edge Inference Boxes Sales and Revenue in Global (2021-2026)
8.4.5 AMD Key News & Latest Developments
8.5 Google (Coral)
8.5.1 Google (Coral) Company Summary
8.5.2 Google (Coral) Business Overview
8.5.3 Google (Coral) AI Edge Inference Boxes Major Product Offerings
8.5.4 Google (Coral) AI Edge Inference Boxes Sales and Revenue in Global (2021-2026)
8.5.5 Google (Coral) Key News & Latest Developments
8.6 Huawei
8.6.1 Huawei Company Summary
8.6.2 Huawei Business Overview
8.6.3 Huawei AI Edge Inference Boxes Major Product Offerings
8.6.4 Huawei AI Edge Inference Boxes Sales and Revenue in Global (2021-2026)
8.6.5 Huawei Key News & Latest Developments
8.7 MediaTek
8.7.1 MediaTek Company Summary
8.7.2 MediaTek Business Overview
8.7.3 MediaTek AI Edge Inference Boxes Major Product Offerings
8.7.4 MediaTek AI Edge Inference Boxes Sales and Revenue in Global (2021-2026)
8.7.5 MediaTek Key News & Latest Developments
8.8 Hailo
8.8.1 Hailo Company Summary
8.8.2 Hailo Business Overview
8.8.3 Hailo AI Edge Inference Boxes Major Product Offerings
8.8.4 Hailo AI Edge Inference Boxes Sales and Revenue in Global (2021-2026)
8.8.5 Hailo Key News & Latest Developments
8.9 SiMa.ai
8.9.1 SiMa.ai Company Summary
8.9.2 SiMa.ai Business Overview
8.9.3 SiMa.ai AI Edge Inference Boxes Major Product Offerings
8.9.4 SiMa.ai AI Edge Inference Boxes Sales and Revenue in Global (2021-2026)
8.9.5 SiMa.ai Key News & Latest Developments
8.10 Kneron
8.10.1 Kneron Company Summary
8.10.2 Kneron Business Overview
8.10.3 Kneron AI Edge Inference Boxes Major Product Offerings
8.10.4 Kneron AI Edge Inference Boxes Sales and Revenue in Global (2021-2026)
8.10.5 Kneron Key News & Latest Developments
8.11 Syntiant
8.11.1 Syntiant Company Summary
8.11.2 Syntiant Business Overview
8.11.3 Syntiant AI Edge Inference Boxes Major Product Offerings
8.11.4 Syntiant AI Edge Inference Boxes Sales and Revenue in Global (2021-2026)
8.11.5 Syntiant Key News & Latest Developments
8.12 BrainChip
8.12.1 BrainChip Company Summary
8.12.2 BrainChip Business Overview
8.12.3 BrainChip AI Edge Inference Boxes Major Product Offerings
8.12.4 BrainChip AI Edge Inference Boxes Sales and Revenue in Global (2021-2026)
8.12.5 BrainChip Key News & Latest Developments
8.13 SynSense
8.13.1 SynSense Company Summary
8.13.2 SynSense Business Overview
8.13.3 SynSense AI Edge Inference Boxes Major Product Offerings
8.13.4 SynSense AI Edge Inference Boxes Sales and Revenue in Global (2021-2026)
8.13.5 SynSense Key News & Latest Developments
8.14 GreenWaves
8.14.1 GreenWaves Company Summary
8.14.2 GreenWaves Business Overview
8.14.3 GreenWaves AI Edge Inference Boxes Major Product Offerings
8.14.4 GreenWaves AI Edge Inference Boxes Sales and Revenue in Global (2021-2026)
8.14.5 GreenWaves Key News & Latest Developments
8.15 Ambarella
8.15.1 Ambarella Company Summary
8.15.2 Ambarella Business Overview
8.15.3 Ambarella AI Edge Inference Boxes Major Product Offerings
8.15.4 Ambarella AI Edge Inference Boxes Sales and Revenue in Global (2021-2026)
8.15.5 Ambarella Key News & Latest Developments
8.16 NXP
8.16.1 NXP Company Summary
8.16.2 NXP Business Overview
8.16.3 NXP AI Edge Inference Boxes Major Product Offerings
8.16.4 NXP AI Edge Inference Boxes Sales and Revenue in Global (2021-2026)
8.16.5 NXP Key News & Latest Developments
8.17 Renesas
8.17.1 Renesas Company Summary
8.17.2 Renesas Business Overview
8.17.3 Renesas AI Edge Inference Boxes Major Product Offerings
8.17.4 Renesas AI Edge Inference Boxes Sales and Revenue in Global (2021-2026)
8.17.5 Renesas Key News & Latest Developments
8.18 Rockchip
8.18.1 Rockchip Company Summary
8.18.2 Rockchip Business Overview
8.18.3 Rockchip AI Edge Inference Boxes Major Product Offerings
8.18.4 Rockchip AI Edge Inference Boxes Sales and Revenue in Global (2021-2026)
8.18.5 Rockchip Key News & Latest Developments
8.19 Axiomtek
8.19.1 Axiomtek Company Summary
8.19.2 Axiomtek Business Overview
8.19.3 Axiomtek AI Edge Inference Boxes Major Product Offerings
8.19.4 Axiomtek AI Edge Inference Boxes Sales and Revenue in Global (2021-2026)
8.19.5 Axiomtek Key News & Latest Developments
8.20 Advantech
8.20.1 Advantech Company Summary
8.20.2 Advantech Business Overview
8.20.3 Advantech AI Edge Inference Boxes Major Product Offerings
8.20.4 Advantech AI Edge Inference Boxes Sales and Revenue in Global (2021-2026)
8.20.5 Advantech Key News & Latest Developments
9 Global AI Edge Inference Boxes Production Capacity, Analysis
9.1 Global AI Edge Inference Boxes Production Capacity, 2021-2032
9.2 AI Edge Inference Boxes Production Capacity of Key Manufacturers in Global Market
9.3 Global AI Edge Inference Boxes Production by Region
10 Key Market Trends, Opportunity, Drivers and Restraints
10.1 Market Opportunities & Trends
10.2 Market Drivers
10.3 Market Restraints
11 AI Edge Inference Boxes Supply Chain Analysis
11.1 AI Edge Inference Boxes Industry Value Chain
11.2 AI Edge Inference Boxes Upstream Market
11.3 AI Edge Inference Boxes Downstream and Clients
11.4 Marketing Channels Analysis
11.4.1 Marketing Channels
11.4.2 AI Edge Inference Boxes Distributors and Sales Agents in Global
12 Conclusion
13 Appendix
13.1 Note
13.2 Examples of Clients
13.3 DisclaimerList of Tables
Table 1. Key Players of AI Edge Inference Boxes in Global Market
Table 2. Top AI Edge Inference Boxes Players in Global Market, Ranking by Revenue (2025)
Table 3. Global AI Edge Inference Boxes Revenue by Companies, (US$, Mn), 2021-2026
Table 4. Global AI Edge Inference Boxes Revenue Share by Companies, 2021-2026
Table 5. Global AI Edge Inference Boxes Sales by Companies, (K Units), 2021-2026
Table 6. Global AI Edge Inference Boxes Sales Share by Companies, 2021-2026
Table 7. Key Manufacturers AI Edge Inference Boxes Price (2021-2026) & (US$/Unit)
Table 8. Global Manufacturers AI Edge Inference Boxes Product Type
Table 9. List of Global Tier 1 AI Edge Inference Boxes Companies, Revenue (US$, Mn) in 2025 and Market Share
Table 10. List of Global Tier 2 and Tier 3 AI Edge Inference Boxes Companies, Revenue (US$, Mn) in 2025 and Market Share
Table 11. Segment by Type Global AI Edge Inference Boxes Revenue, (US$, Mn), 2025 & 2032
Table 12. Segment by Type – Global AI Edge Inference Boxes Revenue (US$, Mn), 2021-2026
Table 13. Segment by Type – Global AI Edge Inference Boxes Revenue (US$, Mn), 2027-2032
Table 14. Segment by Type – Global AI Edge Inference Boxes Sales (K Units), 2021-2026
Table 15. Segment by Type – Global AI Edge Inference Boxes Sales (K Units), 2027-2032
Table 16. Segment by Scenario Global AI Edge Inference Boxes Revenue, (US$, Mn), 2025 & 2032
Table 17. Segment by Scenario – Global AI Edge Inference Boxes Revenue (US$, Mn), 2021-2026
Table 18. Segment by Scenario – Global AI Edge Inference Boxes Revenue (US$, Mn), 2027-2032
Table 19. Segment by Scenario – Global AI Edge Inference Boxes Sales (K Units), 2021-2026
Table 20. Segment by Scenario – Global AI Edge Inference Boxes Sales (K Units), 2027-2032
Table 21. Segment by Application Global AI Edge Inference Boxes Revenue, (US$, Mn), 2025 & 2032
Table 22. Segment by Application – Global AI Edge Inference Boxes Revenue, (US$, Mn), 2021-2026
Table 23. Segment by Application – Global AI Edge Inference Boxes Revenue, (US$, Mn), 2027-2032
Table 24. Segment by Application – Global AI Edge Inference Boxes Sales, (K Units), 2021-2026
Table 25. Segment by Application – Global AI Edge Inference Boxes Sales, (K Units), 2027-2032
Table 26. By Region Global AI Edge Inference Boxes Revenue, (US$, Mn), 2025 & 2032
Table 27. By Region – Global AI Edge Inference Boxes Revenue, (US$, Mn), 2021-2026
Table 28. By Region – Global AI Edge Inference Boxes Revenue, (US$, Mn), 2027-2032
Table 29. By Region – Global AI Edge Inference Boxes Sales, (K Units), 2021-2026
Table 30. By Region – Global AI Edge Inference Boxes Sales, (K Units), 2027-2032
Table 31. By Country – North America AI Edge Inference Boxes Revenue, (US$, Mn), 2021-2026
Table 32. By Country – North America AI Edge Inference Boxes Revenue, (US$, Mn), 2027-2032
Table 33. By Country – North America AI Edge Inference Boxes Sales, (K Units), 2021-2026
Table 34. By Country – North America AI Edge Inference Boxes Sales, (K Units), 2027-2032
Table 35. By Country – Europe AI Edge Inference Boxes Revenue, (US$, Mn), 2021-2026
Table 36. By Country – Europe AI Edge Inference Boxes Revenue, (US$, Mn), 2027-2032
Table 37. By Country – Europe AI Edge Inference Boxes Sales, (K Units), 2021-2026
Table 38. By Country – Europe AI Edge Inference Boxes Sales, (K Units), 2027-2032
Table 39. By Region – Asia AI Edge Inference Boxes Revenue, (US$, Mn), 2021-2026
Table 40. By Region – Asia AI Edge Inference Boxes Revenue, (US$, Mn), 2027-2032
Table 41. By Region – Asia AI Edge Inference Boxes Sales, (K Units), 2021-2026
Table 42. By Region – Asia AI Edge Inference Boxes Sales, (K Units), 2027-2032
Table 43. By Country – South America AI Edge Inference Boxes Revenue, (US$, Mn), 2021-2026
Table 44. By Country – South America AI Edge Inference Boxes Revenue, (US$, Mn), 2027-2032
Table 45. By Country – South America AI Edge Inference Boxes Sales, (K Units), 2021-2026
Table 46. By Country – South America AI Edge Inference Boxes Sales, (K Units), 2027-2032
Table 47. By Country – Middle East & Africa AI Edge Inference Boxes Revenue, (US$, Mn), 2021-2026
Table 48. By Country – Middle East & Africa AI Edge Inference Boxes Revenue, (US$, Mn), 2027-2032
Table 49. By Country – Middle East & Africa AI Edge Inference Boxes Sales, (K Units), 2021-2026
Table 50. By Country – Middle East & Africa AI Edge Inference Boxes Sales, (K Units), 2027-2032
Table 51. NVIDIA Company Summary
Table 52. NVIDIA AI Edge Inference Boxes Product Offerings
Table 53. NVIDIA AI Edge Inference Boxes Sales (K Units), Revenue (US$, Mn) and Average Price (US$/Unit) & (2021-2026)
Table 54. NVIDIA Key News & Latest Developments
Table 55. Intel Company Summary
Table 56. Intel AI Edge Inference Boxes Product Offerings
Table 57. Intel AI Edge Inference Boxes Sales (K Units), Revenue (US$, Mn) and Average Price (US$/Unit) & (2021-2026)
Table 58. Intel Key News & Latest Developments
Table 59. Qualcomm Company Summary
Table 60. Qualcomm AI Edge Inference Boxes Product Offerings
Table 61. Qualcomm AI Edge Inference Boxes Sales (K Units), Revenue (US$, Mn) and Average Price (US$/Unit) & (2021-2026)
Table 62. Qualcomm Key News & Latest Developments
Table 63. AMD Company Summary
Table 64. AMD AI Edge Inference Boxes Product Offerings
Table 65. AMD AI Edge Inference Boxes Sales (K Units), Revenue (US$, Mn) and Average Price (US$/Unit) & (2021-2026)
Table 66. AMD Key News & Latest Developments
Table 67. Google (Coral) Company Summary
Table 68. Google (Coral) AI Edge Inference Boxes Product Offerings
Table 69. Google (Coral) AI Edge Inference Boxes Sales (K Units), Revenue (US$, Mn) and Average Price (US$/Unit) & (2021-2026)
Table 70. Google (Coral) Key News & Latest Developments
Table 71. Huawei Company Summary
Table 72. Huawei AI Edge Inference Boxes Product Offerings
Table 73. Huawei AI Edge Inference Boxes Sales (K Units), Revenue (US$, Mn) and Average Price (US$/Unit) & (2021-2026)
Table 74. Huawei Key News & Latest Developments
Table 75. MediaTek Company Summary
Table 76. MediaTek AI Edge Inference Boxes Product Offerings
Table 77. MediaTek AI Edge Inference Boxes Sales (K Units), Revenue (US$, Mn) and Average Price (US$/Unit) & (2021-2026)
Table 78. MediaTek Key News & Latest Developments
Table 79. Hailo Company Summary
Table 80. Hailo AI Edge Inference Boxes Product Offerings
Table 81. Hailo AI Edge Inference Boxes Sales (K Units), Revenue (US$, Mn) and Average Price (US$/Unit) & (2021-2026)
Table 82. Hailo Key News & Latest Developments
Table 83. SiMa.ai Company Summary
Table 84. SiMa.ai AI Edge Inference Boxes Product Offerings
Table 85. SiMa.ai AI Edge Inference Boxes Sales (K Units), Revenue (US$, Mn) and Average Price (US$/Unit) & (2021-2026)
Table 86. SiMa.ai Key News & Latest Developments
Table 87. Kneron Company Summary
Table 88. Kneron AI Edge Inference Boxes Product Offerings
Table 89. Kneron AI Edge Inference Boxes Sales (K Units), Revenue (US$, Mn) and Average Price (US$/Unit) & (2021-2026)
Table 90. Kneron Key News & Latest Developments
Table 91. Syntiant Company Summary
Table 92. Syntiant AI Edge Inference Boxes Product Offerings
Table 93. Syntiant AI Edge Inference Boxes Sales (K Units), Revenue (US$, Mn) and Average Price (US$/Unit) & (2021-2026)
Table 94. Syntiant Key News & Latest Developments
Table 95. BrainChip Company Summary
Table 96. BrainChip AI Edge Inference Boxes Product Offerings
Table 97. BrainChip AI Edge Inference Boxes Sales (K Units), Revenue (US$, Mn) and Average Price (US$/Unit) & (2021-2026)
Table 98. BrainChip Key News & Latest Developments
Table 99. SynSense Company Summary
Table 100. SynSense AI Edge Inference Boxes Product Offerings
Table 101. SynSense AI Edge Inference Boxes Sales (K Units), Revenue (US$, Mn) and Average Price (US$/Unit) & (2021-2026)
Table 102. SynSense Key News & Latest Developments
Table 103. GreenWaves Company Summary
Table 104. GreenWaves AI Edge Inference Boxes Product Offerings
Table 105. GreenWaves AI Edge Inference Boxes Sales (K Units), Revenue (US$, Mn) and Average Price (US$/Unit) & (2021-2026)
Table 106. GreenWaves Key News & Latest Developments
Table 107. Ambarella Company Summary
Table 108. Ambarella AI Edge Inference Boxes Product Offerings
Table 109. Ambarella AI Edge Inference Boxes Sales (K Units), Revenue (US$, Mn) and Average Price (US$/Unit) & (2021-2026)
Table 110. Ambarella Key News & Latest Developments
Table 111. NXP Company Summary
Table 112. NXP AI Edge Inference Boxes Product Offerings
Table 113. NXP AI Edge Inference Boxes Sales (K Units), Revenue (US$, Mn) and Average Price (US$/Unit) & (2021-2026)
Table 114. NXP Key News & Latest Developments
Table 115. Renesas Company Summary
Table 116. Renesas AI Edge Inference Boxes Product Offerings
Table 117. Renesas AI Edge Inference Boxes Sales (K Units), Revenue (US$, Mn) and Average Price (US$/Unit) & (2021-2026)
Table 118. Renesas Key News & Latest Developments
Table 119. Rockchip Company Summary
Table 120. Rockchip AI Edge Inference Boxes Product Offerings
Table 121. Rockchip AI Edge Inference Boxes Sales (K Units), Revenue (US$, Mn) and Average Price (US$/Unit) & (2021-2026)
Table 122. Rockchip Key News & Latest Developments
Table 123. Axiomtek Company Summary
Table 124. Axiomtek AI Edge Inference Boxes Product Offerings
Table 125. Axiomtek AI Edge Inference Boxes Sales (K Units), Revenue (US$, Mn) and Average Price (US$/Unit) & (2021-2026)
Table 126. Axiomtek Key News & Latest Developments
Table 127. Advantech Company Summary
Table 128. Advantech AI Edge Inference Boxes Product Offerings
Table 129. Advantech AI Edge Inference Boxes Sales (K Units), Revenue (US$, Mn) and Average Price (US$/Unit) & (2021-2026)
Table 130. Advantech Key News & Latest Developments
Table 131. AI Edge Inference Boxes Capacity of Key Manufacturers in Global Market, 2024-2026 (K Units)
Table 132. Global AI Edge Inference Boxes Capacity Market Share of Key Manufacturers, 2024-2026
Table 133. Global AI Edge Inference Boxes Production by Region, 2021-2026 (K Units)
Table 134. Global AI Edge Inference Boxes Production by Region, 2027-2032 (K Units)
Table 135. AI Edge Inference Boxes Market Opportunities & Trends in Global Market
Table 136. AI Edge Inference Boxes Market Drivers in Global Market
Table 137. AI Edge Inference Boxes Market Restraints in Global Market
Table 138. AI Edge Inference Boxes Raw Materials
Table 139. AI Edge Inference Boxes Raw Materials Suppliers in Global Market
Table 140. Typical AI Edge Inference Boxes Downstream
Table 141. AI Edge Inference Boxes Downstream Clients in Global Market
Table 142. AI Edge Inference Boxes Distributors and Sales Agents in Global Market
List of Figures
Figure 1. AI Edge Inference Boxes Product Picture
Figure 2. AI Edge Inference Boxes Segment by Type in 2025
Figure 3. AI Edge Inference Boxes Segment by Scenario in 2025
Figure 4. AI Edge Inference Boxes Segment by Application in 2025
Figure 5. Global AI Edge Inference Boxes Market Overview: 2025
Figure 6. Key Caveats
Figure 7. Global AI Edge Inference Boxes Market Size: 2025 VS 2032 (US$, Mn)
Figure 8. Global AI Edge Inference Boxes Revenue: 2021-2032 (US$, Mn)
Figure 9. AI Edge Inference Boxes Sales in Global Market: 2021-2032 (K Units)
Figure 10. The Top 3 and 5 Players Market Share by AI Edge Inference Boxes Revenue in 2025
Figure 11. Segment by Type Global AI Edge Inference Boxes Revenue, (US$, Mn), 2025 & 2032
Figure 12. Segment by Type – Global AI Edge Inference Boxes Revenue Market Share, 2021-2032
Figure 13. Segment by Type – Global AI Edge Inference Boxes Sales Market Share, 2021-2032
Figure 14. Segment by Type – Global AI Edge Inference Boxes Price (US$/Unit), 2021-2032
Figure 15. Segment by Scenario Global AI Edge Inference Boxes Revenue, (US$, Mn), 2025 & 2032
Figure 16. Segment by Scenario – Global AI Edge Inference Boxes Revenue Market Share, 2021-2032
Figure 17. Segment by Scenario – Global AI Edge Inference Boxes Sales Market Share, 2021-2032
Figure 18. Segment by Scenario – Global AI Edge Inference Boxes Price (US$/Unit), 2021-2032
Figure 19. Segment by Application Global AI Edge Inference Boxes Revenue, (US$, Mn), 2025 & 2032
Figure 20. Segment by Application – Global AI Edge Inference Boxes Revenue Market Share, 2021-2032
Figure 21. Segment by Application – Global AI Edge Inference Boxes Sales Market Share, 2021-2032
Figure 22. Segment by Application -Global AI Edge Inference Boxes Price (US$/Unit), 2021-2032
Figure 23. By Region Global AI Edge Inference Boxes Revenue, (US$, Mn), 2025 & 2032
Figure 24. By Region – Global AI Edge Inference Boxes Revenue Market Share, 2021 VS 2025 VS 2032
Figure 25. By Region – Global AI Edge Inference Boxes Revenue Market Share, 2021-2032
Figure 26. By Region – Global AI Edge Inference Boxes Sales Market Share, 2021-2032
Figure 27. By Country – North America AI Edge Inference Boxes Revenue Market Share, 2021-2032
Figure 28. By Country – North America AI Edge Inference Boxes Sales Market Share, 2021-2032
Figure 29. United States AI Edge Inference Boxes Revenue, (US$, Mn), 2021-2032
Figure 30. Canada AI Edge Inference Boxes Revenue, (US$, Mn), 2021-2032
Figure 31. Mexico AI Edge Inference Boxes Revenue, (US$, Mn), 2021-2032
Figure 32. By Country – Europe AI Edge Inference Boxes Revenue Market Share, 2021-2032
Figure 33. By Country – Europe AI Edge Inference Boxes Sales Market Share, 2021-2032
Figure 34. Germany AI Edge Inference Boxes Revenue, (US$, Mn), 2021-2032
Figure 35. France AI Edge Inference Boxes Revenue, (US$, Mn), 2021-2032
Figure 36. U.K. AI Edge Inference Boxes Revenue, (US$, Mn), 2021-2032
Figure 37. Italy AI Edge Inference Boxes Revenue, (US$, Mn), 2021-2032
Figure 38. Russia AI Edge Inference Boxes Revenue, (US$, Mn), 2021-2032
Figure 39. Nordic Countries AI Edge Inference Boxes Revenue, (US$, Mn), 2021-2032
Figure 40. Benelux AI Edge Inference Boxes Revenue, (US$, Mn), 2021-2032
Figure 41. By Region – Asia AI Edge Inference Boxes Revenue Market Share, 2021-2032
Figure 42. By Region – Asia AI Edge Inference Boxes Sales Market Share, 2021-2032
Figure 43. China AI Edge Inference Boxes Revenue, (US$, Mn), 2021-2032
Figure 44. Japan AI Edge Inference Boxes Revenue, (US$, Mn), 2021-2032
Figure 45. South Korea AI Edge Inference Boxes Revenue, (US$, Mn), 2021-2032
Figure 46. Southeast Asia AI Edge Inference Boxes Revenue, (US$, Mn), 2021-2032
Figure 47. India AI Edge Inference Boxes Revenue, (US$, Mn), 2021-2032
Figure 48. By Country – South America AI Edge Inference Boxes Revenue Market Share, 2021-2032
Figure 49. By Country – South America AI Edge Inference Boxes Sales, Market Share, 2021-2032
Figure 50. Brazil AI Edge Inference Boxes Revenue, (US$, Mn), 2021-2032
Figure 51. Argentina AI Edge Inference Boxes Revenue, (US$, Mn), 2021-2032
Figure 52. By Country – Middle East & Africa AI Edge Inference Boxes Revenue, Market Share, 2021-2032
Figure 53. By Country – Middle East & Africa AI Edge Inference Boxes Sales, Market Share, 2021-2032
Figure 54. Turkey AI Edge Inference Boxes Revenue, (US$, Mn), 2021-2032
Figure 55. Israel AI Edge Inference Boxes Revenue, (US$, Mn), 2021-2032
Figure 56. Saudi Arabia AI Edge Inference Boxes Revenue, (US$, Mn), 2021-2032
Figure 57. UAE AI Edge Inference Boxes Revenue, (US$, Mn), 2021-2032
Figure 58. Global AI Edge Inference Boxes Production Capacity (K Units), 2021-2032
Figure 59. The Percentage of Production AI Edge Inference Boxes by Region, 2025 VS 2032
Figure 60. AI Edge Inference Boxes Industry Value Chain
Figure 61. Marketing Channels