Active Optical Module Market, Trends, Business Strategies 2025-2032

Active Optical Module Market was valued at 5916 million in 2024 and is projected to reach US$ 15140 million by 2032, at a CAGR of 14.7% during the forecast period

PDF Icon Download Sample Report PDF
  • Quick Dispatch

    All Orders

  • Secure Payment

    100% Secure Payment

Price range: $1,500.00 through $4,250.00

Clear

MARKET INSIGHTS

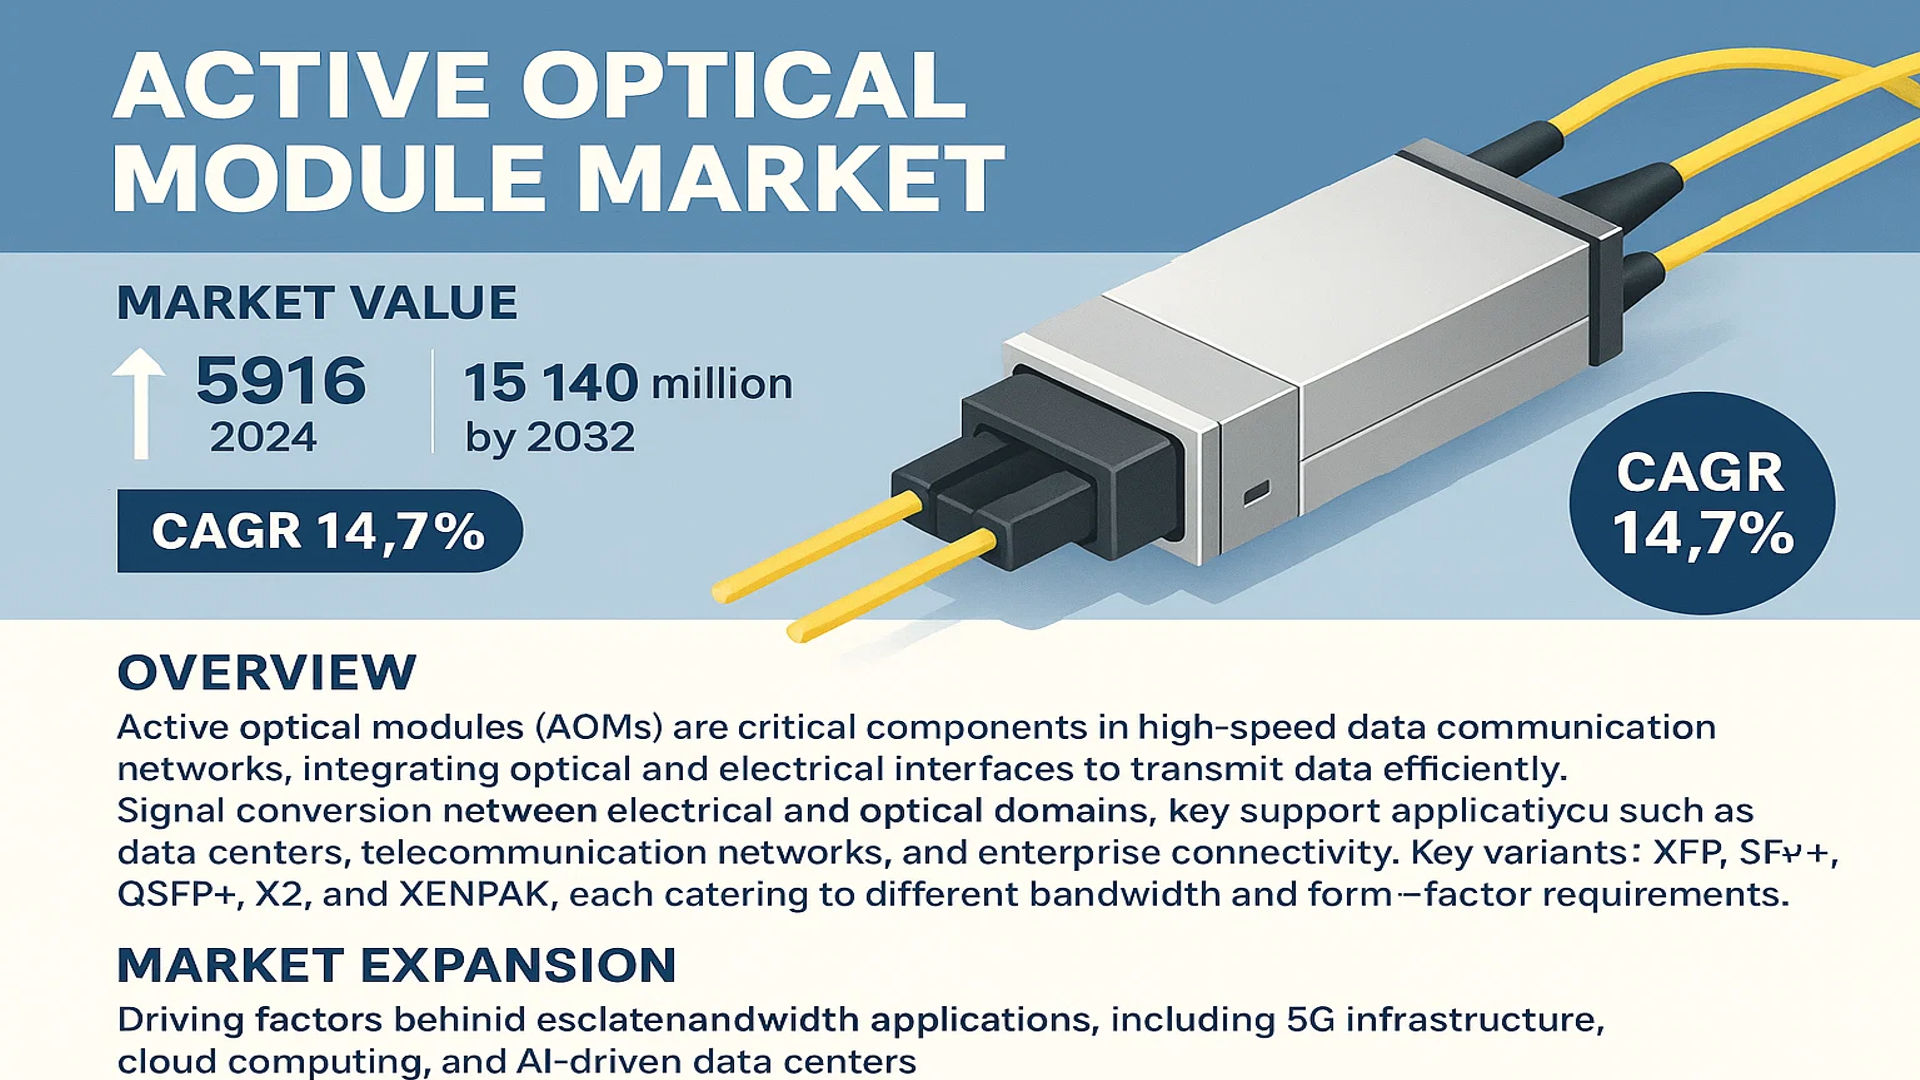
The global Active Optical Module Market was valued at 5916 million in 2024 and is projected to reach US$ 15140 million by 2032, at a CAGR of 14.7% during the forecast period.

Active optical modules (AOMs) are critical components in high-speed data communication networks, integrating optical and electrical interfaces to transmit data efficiently. These modules facilitate signal conversion between electrical and optical domains, supporting applications such as data centers, telecommunication networks, and enterprise connectivity. Key variants include XFP, SFP+, QSFP+, X2, and XENPAK, each catering to different bandwidth and form factor requirements.

The market expansion is driven by escalating demand for high-bandwidth applications, including 5G infrastructure, cloud computing, and AI-driven data centers. However, challenges such as high manufacturing costs and technical complexities in thermal management persist. Leading players like Hisilicon, Amphenol, and Eoptolink dominate the competitive landscape, with the top five companies holding a significant revenue share in 2024. Recent advancements in silicon photonics and coherent optics are further propelling innovation, ensuring long-term market sustainability.

Active Optical Module Market

MARKET DYNAMICS

MARKET DRIVERS

Exponential Growth in Data Center Deployments to Drive Active Optical Module Demand

The staggering expansion of hyperscale data centers globally is creating unprecedented demand for high-speed optical connectivity solutions. With data traffic projected to grow at a compound annual rate of over 25% through 2030, data center operators are increasingly adopting active optical modules (AOMs) to support 400G and 800G Ethernet standards. These modules enable higher bandwidth density while reducing power consumption – a critical factor as energy costs continue rising. Recent technological breakthroughs in silicon photonics have further enhanced AOM performance, making them indispensable for modern data center architectures.

5G Network Rollouts Accelerating Adoption of High-Speed Optical Solutions

The global transition to 5G networks represents a fundamental driver for the AOM market, requiring substantial upgrades to fronthaul and backhaul infrastructure. Mobile operators worldwide are investing heavily in fiber-based solutions to support the low-latency, high-bandwidth requirements of 5G services. Active optical modules play a pivotal role in these deployments, with the front-haul segment alone expected to account for over 30% of total market demand by 2026. The integration of AOMs in small cell deployments and centralized radio access networks (C-RAN) is proving particularly transformative for mobile network architectures.

Furthermore, government initiatives accelerating digital infrastructure development are providing additional momentum:

Multiple national broadband plans now mandate fiber-optic backbones, creating sustained demand for high-performance optical modules in telecommunications applications.

The combination of private sector investment and public infrastructure programs is creating a robust growth environment for AOM manufacturers across both developed and emerging markets.

Emergence of AI and Machine Learning Workloads Fueling Advanced Optical Needs

Artificial intelligence and machine learning applications are driving revolutionary changes in data center architectures, particularly in interconnect requirements between GPUs and accelerators. The bandwidth demands of AI clusters – often requiring petabits per second of internal connectivity – are pushing AOM technology to new performance thresholds. Leading cloud providers are now deploying optical modules capable of 1.6Tbps speeds to support distributed AI training workloads, creating a premium segment within the market. This trend is expected to intensify as AI model complexity continues growing exponentially, with neural networks doubling in size approximately every 3-6 months.

MARKET RESTRAINTS

Supply Chain Vulnerabilities and Component Shortages Constraining Market Growth

The active optical module industry faces significant challenges from ongoing supply chain disruptions, particularly for critical photonic components. The concentrated nature of semiconductor manufacturing has created bottlenecks, with lead times for certain optoelectronic chips extending beyond 52 weeks in some cases. These constraints are exacerbated by the complex multi-country supply chains typical in AOM production, where a single module might incorporate components from a dozen different specialized suppliers. While capacity expansions are underway, the capital-intensive nature of photonics fabrication means supply-demand imbalances may persist through 2025.

High Development Costs Creating Barriers for Market Entrants

The significant R&D expenditures required for next-generation AOM development present another key market restraint. Designing optical modules for 800G and beyond often requires investments exceeding $50 million per product family, creating substantial barriers for smaller players. Additionally, the rapid pace of technology obsolescence in this sector means manufacturers must continually reinvest in new designs to remain competitive. This dynamic favors established players with deep financial resources, potentially limiting innovation from emerging competitors and consolidating market share among a handful of dominant suppliers.

The combination of technical complexity and financial requirements has created a challenging environment:

Recent industry analysis suggests development cycles for new AOM products have extended by 30-40% compared to pre-pandemic timelines due to increased design complexity and testing requirements.

These factors are slowing the overall pace of innovation while increasing the cost structure across the value chain.

MARKET CHALLENGES

Power Consumption and Thermal Management Issues in High-Density Deployments

As data rates continue climbing to 800G and 1.6T, active optical modules face escalating thermal management challenges. Power densities in modern switch racks now exceed 40kW in many deployments, with optical modules contributing significantly to the thermal load. This creates difficult engineering tradeoffs between performance, power efficiency, and reliability – particularly in hyperscale environments where equipment operates continuously at peak capacity. Module manufacturers are investing heavily in advanced cooling solutions and lower-power designs, but fundamental physics limitations make this an ongoing battle as speeds increase.

Additional Technical Challenges

Signal Integrity at Higher Frequencies
Maintaining signal integrity becomes increasingly difficult as data rates push into terabit territories, requiring more sophisticated DSP techniques and higher-quality optical components. This adds both cost and complexity to module designs.

Interoperability Concerns
The proliferation of proprietary implementations among different switch vendors creates interoperability challenges, forcing module makers to maintain multiple product variants and increasing inventory complexity.

MARKET OPPORTUNITIES

Co-Packaged Optics Emergence Creating New Product Development Pathways

The transition toward co-packaged optics (CPO) architectures represents one of the most significant opportunities in the optical components market. By integrating optical engines directly with switch ASICs, CPO solutions promise substantial power savings and density improvements for next-generation data centers. Early implementations suggest potential power reductions of 30-50% compared to discrete pluggable modules, making this technology particularly attractive for sustainability-focused cloud operators. While technical hurdles remain, lead customers are already working closely with suppliers on pilot deployments, with commercial availability expected to ramp significantly after 2025.

Edge Computing Expansion Driving Demand for Ruggedized Optical Solutions

The rapid growth of edge computing infrastructure is creating new opportunities for specialized AOM products designed for harsh environments. Unlike temperature-controlled data centers, edge locations often confront wide thermal variations, vibration, and limited maintenance access – demanding more robust optical solutions. Module suppliers developing products specifically for these challenging deployments can command premium pricing while establishing early positions in a market segment projected to grow at nearly 30% annually through 2030. This includes applications in industrial settings, telecom edge nodes, and outdoor wireless infrastructure.

Technological convergence is creating additional avenues for innovation:

Emerging silicon photonics platforms are enabling new levels of integration between optical and electronic components, potentially revolutionizing module form factors and performance characteristics in coming years.

Companies successfully navigating these transitions will be well-positioned to capitalize on the next phase of optical networking evolution.

ACTIVE OPTICAL MODULE MARKET TRENDS

5G Network Expansion Driving Demand for High-Speed Optical Modules

The global rollout of 5G networks is significantly increasing the adoption of active optical modules (AOMs) due to their ability to handle high-speed data transmission with low latency. These modules play a crucial role in enabling fiber-optic communication infrastructures that support 5G backhaul and fronthaul networks. With major telecom operators investing heavily in next-generation network deployments, the market for AOMs is expected to grow at a CAGR of 14.7%, reaching $15.14 billion by 2032. The RF-over-fiber (RFoF) technology used in 5G small cells further amplifies the demand for advanced AOMs capable of supporting ultra-high frequencies.

Other Trends

Data Center Modernization

Increasing data traffic from cloud computing and AI workloads is compelling data center operators to upgrade their infrastructure with high-capacity AOMs. The shift toward 400G and 800G optical transceivers is accelerating, with hyperscale data centers being early adopters. In 2024, the QSFP+ and SFP+ segments collectively accounted for over 60% of the market share, while emerging demand for co-packaged optics (CPO) technology is reshaping future deployment strategies. This transition is driven by the need for energy-efficient solutions that reduce power consumption per bit of data transmitted.

Technological Advancements in Optical Networking

Innovations in silicon photonics and pluggable optics are enabling manufacturers to develop compact, high-performance AOMs at competitive price points. Recent breakthroughs include 800G DR8 modules that support terabit-scale connectivity while maintaining backward compatibility with existing infrastructure. Leading players like Hilink Technology and Amphenol are investing heavily in R&D to improve thermal management and signal integrity. These advancements are particularly crucial for emerging applications in edge computing and AI-driven network optimization, where low-latency data transfer is paramount. However, supply chain challenges for semiconductor components continue to pose constraints on production scalability.

COMPETITIVE LANDSCAPE

Key Industry Players

Market Leaders Forge Ahead with Innovations to Secure Market Dominance

The global active optical module market exhibits a semi-consolidated competitive structure, with a mix of established multinational corporations and emerging regional players vying for market share. Daiichiseiko and Hisense Broadband currently lead the market, owing to their comprehensive product portfolios spanning multiple form factors including XFP, SFP+, and QSFP+ modules. These companies benefit from vertical integration capabilities and strong distribution networks across key regions.

Silicon Line and Accelink have emerged as significant challengers, particularly in the Asia-Pacific region where demand for high-speed data transmission continues to surge. Their competitive advantage stems from cost-effective production capabilities and rapid adoption of emerging technologies like 400G optical modules.

The market has witnessed increased strategic movements in 2024, with key players focusing on R&D investments to develop energy-efficient modules and improved thermal management solutions. This technological arms race is particularly evident in data center applications, where power consumption remains a critical concern for operators.

Meanwhile, Amphenol and Eoptolink are expanding their market presence through strategic collaborations with network equipment manufacturers. Their approach combines technical expertise with scalable manufacturing, allowing them to cater to both hyperscale data center operators and telecommunications service providers.

List of Key Active Optical Module Manufacturers

The industry’s competitive intensity continues to rise as companies pursue technological differentiation through advanced modulation techniques and improved signal integrity. While Chinese manufacturers dominate volume production, their American and European counterparts maintain leadership in specialized high-performance modules for mission-critical applications.

Active Optical Module Market

By Type

QSFP+ Segment Leads Due to High-Density Data Transmission in Data Centers

The market is segmented based on type into:

  • XFP
  • SFP+
  • QSFP+
  • X2
  • XENPAK
  • Others

By Application

Optical Fiber Communication Dominates Due to Rising Demand for High-Speed Network Infrastructure

The market is segmented based on application into:

  • Optical Fiber Communication
  • Bandwidth
  • Others

By End-User

Telecommunications Sector Accounts for Major Share Due to 5G Deployment Requirements

The market is segmented based on end-user into:

  • Telecommunications
  • Data Centers
  • Enterprise Networks
  • Consumer Electronics

By Technology

Wavelength Division Multiplexing Gains Traction for Enhanced Bandwidth Utilization

The market is segmented based on technology into:

  • Wavelength Division Multiplexing (WDM)
  • Coherent Optical Communication
  • Short-Reach Communication

Regional Analysis: Active Optical Module Market

Asia-Pacific
The Asia-Pacific region dominates the Active Optical Module market, driven by massive demand from China, Japan, and India. China, in particular, is the largest consumer and producer, with its telecommunications and data center sectors expanding rapidly due to government-led initiatives like “Digital China” and 5G network deployments. The region benefits from a robust supply chain ecosystem, including key players such as Hisilicon and Accelink, which contribute significantly to global production. While cost competitiveness remains a key advantage, the push for higher-speed modules, such as QSFP+ and SFP+, is accelerating market growth. Rising data traffic from urbanization and digital transformation initiatives further fuels adoption.

North America
North America is a high-growth market, propelled by the United States’ advanced IT infrastructure and data center investments. The demand for high-speed optical modules, particularly in hyperscale data centers and cloud computing, is surging. Innovations in fiber-optic communication standards and increasing bandwidth requirements from enterprises contribute to market expansion. Leading companies like Amphenol and Silicon Line are actively developing energy-efficient and compact AOM solutions to meet regulatory and environmental standards. Despite strong demand, supply chain constraints and fluctuating component costs present challenges.

Europe
Europe’s market is characterized by stringent quality norms and a focus on sustainable, high-performance optical modules. Countries like Germany and the U.K. lead in fiber-optic adoption, backed by government funding for broadband expansion and smart city projects. The EU’s emphasis on reducing carbon footprints encourages manufacturers to develop low-power consumption modules. However, dependency on imports for critical components and slower infrastructure upgrades compared to Asia-Pacific limit faster market penetration. Companies are investing in R&D to enhance compatibility with next-gen network architectures.

South America
The market in South America is at a nascent stage but holds potential due to gradual digitalization efforts, particularly in Brazil and Argentina. Telecom operators are upgrading networks to support increasing internet penetration, which drives demand for cost-effective optical modules. However, economic instability and limited local manufacturing result in reliance on imports, affecting pricing and delivery timelines. While the market is still emerging, investments in data centers and broadband projects signal long-term opportunities.

Middle East & Africa
The Middle East & Africa region shows steady growth, with countries like Saudi Arabia and the UAE investing in smart infrastructure and 5G rollouts. Data localization policies and expanding IT hubs in Dubai and Riyadh are boosting demand for high-speed optical modules. However, infrastructure limitations in many African nations hinder widespread adoption. Market development is also constrained by funding gaps and a lack of local expertise, though partnerships with global suppliers are gradually addressing these challenges.

Report Scope

This market research report provides a comprehensive analysis of the global Active Optical Module market, covering the forecast period 2024–2032. It offers detailed insights into market dynamics, technological advancements, competitive landscape, and key trends shaping the industry.

Key focus areas of the report include:

  • Market Size & Forecast: Historical data and future projections for revenue, unit shipments, and market value across major regions and segments. The global Active Optical Module market was valued at USD 5,916 million in 2024 and is projected to reach USD 15,140 million by 2032, growing at a CAGR of 14.7%.
  • Segmentation Analysis: Detailed breakdown by product type (XFP, SFP+, QSFP+, X2, XENPAK, Others), application (Optical Fiber Communication, Bandwidth, Others), and end-user industry to identify high-growth segments.
  • Regional Outlook: Insights into market performance across North America, Europe, Asia-Pacific, Latin America, and Middle East & Africa, with country-level analysis for key markets including the U.S., China, Japan, Germany, and others.
  • Competitive Landscape: Profiles of leading market participants including Daiichiseiko, Silicon Line, Hisilicon, Hisense Broadband, Accelink, Eoptolink, Amphenol, and others, covering their market share, product portfolios, and strategic initiatives.
  • Technology Trends & Innovation: Assessment of emerging optical communication technologies, integration with 5G networks, and advancements in high-speed data transmission modules.
  • Market Drivers & Restraints: Evaluation of factors including growing data center demand, 5G network deployment, and bandwidth requirements versus supply chain constraints and high development costs.
  • Stakeholder Analysis: Strategic insights for component manufacturers, telecom operators, data center operators, and investors regarding market opportunities and challenges.

The research methodology combines primary interviews with industry experts and analysis of verified market data from multiple authoritative sources to ensure accuracy and reliability.

FREQUENTLY ASKED QUESTIONS:

What is the current market size of Global Active Optical Module Market?

-> Active Optical Module Market was valued at 5916 million in 2024 and is projected to reach US$ 15140 million by 2032, at a CAGR of 14.7% during the forecast period.

Which key companies operate in Global Active Optical Module Market?

-> Key players include Daiichiseiko, Silicon Line, Hisilicon, Hisense Broadband, Accelink, Eoptolink, Amphenol, Hilink Technology, Gearlink, and T&S Communication.

What are the key growth drivers?

-> Key growth drivers include rising data center investments, 5G network expansion, increasing bandwidth requirements, and cloud computing adoption.

Which region dominates the market?

-> Asia-Pacific dominates the market, driven by China’s rapid telecom infrastructure development, while North America remains a significant market due to advanced data center infrastructure.

What are the emerging trends?

-> Emerging trends include development of 800G modules, silicon photonics integration, and demand for energy-efficient optical solutions in data centers and telecom networks.

Active Optical Module Market, Trends, Business Strategies 2025-2032

Get Sample Report PDF for Exclusive Insights

Report Sample Includes

  • Table of Contents
  • List of Tables & Figures
  • Charts, Research Methodology, and more...
PDF Icon Download Sample Report PDF

Download Sample Report

Table of Content

1 Introduction to Research & Analysis Reports
1.1 Active Optical Module Market Definition
1.2 Market Segments
1.2.1 Segment by Type
1.2.2 Segment by Application
1.3 Global Active Optical Module Market Overview
1.4 Features & Benefits of This Report
1.5 Methodology & Sources of Information
1.5.1 Research Methodology
1.5.2 Research Process
1.5.3 Base Year
1.5.4 Report Assumptions & Caveats
2 Global Active Optical Module Overall Market Size
2.1 Global Active Optical Module Market Size: 2024 VS 2032
2.2 Global Active Optical Module Market Size, Prospects & Forecasts: 2020-2032
2.3 Global Active Optical Module Sales: 2020-2032
3 Company Landscape
3.1 Top Active Optical Module Players in Global Market
3.2 Top Global Active Optical Module Companies Ranked by Revenue
3.3 Global Active Optical Module Revenue by Companies
3.4 Global Active Optical Module Sales by Companies
3.5 Global Active Optical Module Price by Manufacturer (2020-2025)
3.6 Top 3 and Top 5 Active Optical Module Companies in Global Market, by Revenue in 2024
3.7 Global Manufacturers Active Optical Module Product Type
3.8 Tier 1, Tier 2, and Tier 3 Active Optical Module Players in Global Market
3.8.1 List of Global Tier 1 Active Optical Module Companies
3.8.2 List of Global Tier 2 and Tier 3 Active Optical Module Companies
4 Sights by Product
4.1 Overview
4.1.1 Segment by Type – Global Active Optical Module Market Size Markets, 2024 & 2032
4.1.2 XFP
4.1.3 SFP+
4.1.4 QSFP+
4.1.5 X2
4.1.6 XENPAK
4.1.7 Others
4.2 Segment by Type – Global Active Optical Module Revenue & Forecasts
4.2.1 Segment by Type – Global Active Optical Module Revenue, 2020-2025
4.2.2 Segment by Type – Global Active Optical Module Revenue, 2026-2032
4.2.3 Segment by Type – Global Active Optical Module Revenue Market Share, 2020-2032
4.3 Segment by Type – Global Active Optical Module Sales & Forecasts
4.3.1 Segment by Type – Global Active Optical Module Sales, 2020-2025
4.3.2 Segment by Type – Global Active Optical Module Sales, 2026-2032
4.3.3 Segment by Type – Global Active Optical Module Sales Market Share, 2020-2032
4.4 Segment by Type – Global Active Optical Module Price (Manufacturers Selling Prices), 2020-2032
5 Sights by Application
5.1 Overview
5.1.1 Segment by Application – Global Active Optical Module Market Size, 2024 & 2032
5.1.2 Optical Fiber Communication
5.1.3 Bandwidth
5.1.4 Others
5.2 Segment by Application – Global Active Optical Module Revenue & Forecasts
5.2.1 Segment by Application – Global Active Optical Module Revenue, 2020-2025
5.2.2 Segment by Application – Global Active Optical Module Revenue, 2026-2032
5.2.3 Segment by Application – Global Active Optical Module Revenue Market Share, 2020-2032
5.3 Segment by Application – Global Active Optical Module Sales & Forecasts
5.3.1 Segment by Application – Global Active Optical Module Sales, 2020-2025
5.3.2 Segment by Application – Global Active Optical Module Sales, 2026-2032
5.3.3 Segment by Application – Global Active Optical Module Sales Market Share, 2020-2032
5.4 Segment by Application – Global Active Optical Module Price (Manufacturers Selling Prices), 2020-2032
6 Sights by Region
6.1 By Region – Global Active Optical Module Market Size, 2024 & 2032
6.2 By Region – Global Active Optical Module Revenue & Forecasts
6.2.1 By Region – Global Active Optical Module Revenue, 2020-2025
6.2.2 By Region – Global Active Optical Module Revenue, 2026-2032
6.2.3 By Region – Global Active Optical Module Revenue Market Share, 2020-2032
6.3 By Region – Global Active Optical Module Sales & Forecasts
6.3.1 By Region – Global Active Optical Module Sales, 2020-2025
6.3.2 By Region – Global Active Optical Module Sales, 2026-2032
6.3.3 By Region – Global Active Optical Module Sales Market Share, 2020-2032
6.4 North America
6.4.1 By Country – North America Active Optical Module Revenue, 2020-2032
6.4.2 By Country – North America Active Optical Module Sales, 2020-2032
6.4.3 United States Active Optical Module Market Size, 2020-2032
6.4.4 Canada Active Optical Module Market Size, 2020-2032
6.4.5 Mexico Active Optical Module Market Size, 2020-2032
6.5 Europe
6.5.1 By Country – Europe Active Optical Module Revenue, 2020-2032
6.5.2 By Country – Europe Active Optical Module Sales, 2020-2032
6.5.3 Germany Active Optical Module Market Size, 2020-2032
6.5.4 France Active Optical Module Market Size, 2020-2032
6.5.5 U.K. Active Optical Module Market Size, 2020-2032
6.5.6 Italy Active Optical Module Market Size, 2020-2032
6.5.7 Russia Active Optical Module Market Size, 2020-2032
6.5.8 Nordic Countries Active Optical Module Market Size, 2020-2032
6.5.9 Benelux Active Optical Module Market Size, 2020-2032
6.6 Asia
6.6.1 By Region – Asia Active Optical Module Revenue, 2020-2032
6.6.2 By Region – Asia Active Optical Module Sales, 2020-2032
6.6.3 China Active Optical Module Market Size, 2020-2032
6.6.4 Japan Active Optical Module Market Size, 2020-2032
6.6.5 South Korea Active Optical Module Market Size, 2020-2032
6.6.6 Southeast Asia Active Optical Module Market Size, 2020-2032
6.6.7 India Active Optical Module Market Size, 2020-2032
6.7 South America
6.7.1 By Country – South America Active Optical Module Revenue, 2020-2032
6.7.2 By Country – South America Active Optical Module Sales, 2020-2032
6.7.3 Brazil Active Optical Module Market Size, 2020-2032
6.7.4 Argentina Active Optical Module Market Size, 2020-2032
6.8 Middle East & Africa
6.8.1 By Country – Middle East & Africa Active Optical Module Revenue, 2020-2032
6.8.2 By Country – Middle East & Africa Active Optical Module Sales, 2020-2032
6.8.3 Turkey Active Optical Module Market Size, 2020-2032
6.8.4 Israel Active Optical Module Market Size, 2020-2032
6.8.5 Saudi Arabia Active Optical Module Market Size, 2020-2032
6.8.6 UAE Active Optical Module Market Size, 2020-2032
7 Manufacturers & Brands Profiles
7.1 Daiichiseiko
7.1.1 Daiichiseiko Company Summary
7.1.2 Daiichiseiko Business Overview
7.1.3 Daiichiseiko Active Optical Module Major Product Offerings
7.1.4 Daiichiseiko Active Optical Module Sales and Revenue in Global (2020-2025)
7.1.5 Daiichiseiko Key News & Latest Developments
7.2 Silicon Line
7.2.1 Silicon Line Company Summary
7.2.2 Silicon Line Business Overview
7.2.3 Silicon Line Active Optical Module Major Product Offerings
7.2.4 Silicon Line Active Optical Module Sales and Revenue in Global (2020-2025)
7.2.5 Silicon Line Key News & Latest Developments
7.3 Hisilicon
7.3.1 Hisilicon Company Summary
7.3.2 Hisilicon Business Overview
7.3.3 Hisilicon Active Optical Module Major Product Offerings
7.3.4 Hisilicon Active Optical Module Sales and Revenue in Global (2020-2025)
7.3.5 Hisilicon Key News & Latest Developments
7.4 Hisense Broadband
7.4.1 Hisense Broadband Company Summary
7.4.2 Hisense Broadband Business Overview
7.4.3 Hisense Broadband Active Optical Module Major Product Offerings
7.4.4 Hisense Broadband Active Optical Module Sales and Revenue in Global (2020-2025)
7.4.5 Hisense Broadband Key News & Latest Developments
7.5 Accelink
7.5.1 Accelink Company Summary
7.5.2 Accelink Business Overview
7.5.3 Accelink Active Optical Module Major Product Offerings
7.5.4 Accelink Active Optical Module Sales and Revenue in Global (2020-2025)
7.5.5 Accelink Key News & Latest Developments
7.6 Eoptolink
7.6.1 Eoptolink Company Summary
7.6.2 Eoptolink Business Overview
7.6.3 Eoptolink Active Optical Module Major Product Offerings
7.6.4 Eoptolink Active Optical Module Sales and Revenue in Global (2020-2025)
7.6.5 Eoptolink Key News & Latest Developments
7.7 Amphenol
7.7.1 Amphenol Company Summary
7.7.2 Amphenol Business Overview
7.7.3 Amphenol Active Optical Module Major Product Offerings
7.7.4 Amphenol Active Optical Module Sales and Revenue in Global (2020-2025)
7.7.5 Amphenol Key News & Latest Developments
7.8 Hilink Technology
7.8.1 Hilink Technology Company Summary
7.8.2 Hilink Technology Business Overview
7.8.3 Hilink Technology Active Optical Module Major Product Offerings
7.8.4 Hilink Technology Active Optical Module Sales and Revenue in Global (2020-2025)
7.8.5 Hilink Technology Key News & Latest Developments
7.9 Gearlink
7.9.1 Gearlink Company Summary
7.9.2 Gearlink Business Overview
7.9.3 Gearlink Active Optical Module Major Product Offerings
7.9.4 Gearlink Active Optical Module Sales and Revenue in Global (2020-2025)
7.9.5 Gearlink Key News & Latest Developments
7.10 T&S Communication
7.10.1 T&S Communication Company Summary
7.10.2 T&S Communication Business Overview
7.10.3 T&S Communication Active Optical Module Major Product Offerings
7.10.4 T&S Communication Active Optical Module Sales and Revenue in Global (2020-2025)
7.10.5 T&S Communication Key News & Latest Developments
7.11 GrenTech
7.11.1 GrenTech Company Summary
7.11.2 GrenTech Business Overview
7.11.3 GrenTech Active Optical Module Major Product Offerings
7.11.4 GrenTech Active Optical Module Sales and Revenue in Global (2020-2025)
7.11.5 GrenTech Key News & Latest Developments
8 Global Active Optical Module Production Capacity, Analysis
8.1 Global Active Optical Module Production Capacity, 2020-2032
8.2 Active Optical Module Production Capacity of Key Manufacturers in Global Market
8.3 Global Active Optical Module Production by Region
9 Key Market Trends, Opportunity, Drivers and Restraints
9.1 Market Opportunities & Trends
9.2 Market Drivers
9.3 Market Restraints
10 Active Optical Module Supply Chain Analysis
10.1 Active Optical Module Industry Value Chain
10.2 Active Optical Module Upstream Market
10.3 Active Optical Module Downstream and Clients
10.4 Marketing Channels Analysis
10.4.1 Marketing Channels
10.4.2 Active Optical Module Distributors and Sales Agents in Global
11 Conclusion
12 Appendix
12.1 Note
12.2 Examples of Clients
12.3 DisclaimerList of Tables
Table 1. Key Players of Active Optical Module in Global Market
Table 2. Top Active Optical Module Players in Global Market, Ranking by Revenue (2024)
Table 3. Global Active Optical Module Revenue by Companies, (US$, Mn), 2020-2025
Table 4. Global Active Optical Module Revenue Share by Companies, 2020-2025
Table 5. Global Active Optical Module Sales by Companies, (K Units), 2020-2025
Table 6. Global Active Optical Module Sales Share by Companies, 2020-2025
Table 7. Key Manufacturers Active Optical Module Price (2020-2025) & (US$/Unit)
Table 8. Global Manufacturers Active Optical Module Product Type
Table 9. List of Global Tier 1 Active Optical Module Companies, Revenue (US$, Mn) in 2024 and Market Share
Table 10. List of Global Tier 2 and Tier 3 Active Optical Module Companies, Revenue (US$, Mn) in 2024 and Market Share
Table 11. Segment by Type – Global Active Optical Module Revenue, (US$, Mn), 2024 & 2032
Table 12. Segment by Type – Global Active Optical Module Revenue (US$, Mn), 2020-2025
Table 13. Segment by Type – Global Active Optical Module Revenue (US$, Mn), 2026-2032
Table 14. Segment by Type – Global Active Optical Module Sales (K Units), 2020-2025
Table 15. Segment by Type – Global Active Optical Module Sales (K Units), 2026-2032
Table 16. Segment by Application – Global Active Optical Module Revenue, (US$, Mn), 2024 & 2032
Table 17. Segment by Application – Global Active Optical Module Revenue, (US$, Mn), 2020-2025
Table 18. Segment by Application – Global Active Optical Module Revenue, (US$, Mn), 2026-2032
Table 19. Segment by Application – Global Active Optical Module Sales, (K Units), 2020-2025
Table 20. Segment by Application – Global Active Optical Module Sales, (K Units), 2026-2032
Table 21. By Region – Global Active Optical Module Revenue, (US$, Mn), 2025-2032
Table 22. By Region – Global Active Optical Module Revenue, (US$, Mn), 2020-2025
Table 23. By Region – Global Active Optical Module Revenue, (US$, Mn), 2026-2032
Table 24. By Region – Global Active Optical Module Sales, (K Units), 2020-2025
Table 25. By Region – Global Active Optical Module Sales, (K Units), 2026-2032
Table 26. By Country – North America Active Optical Module Revenue, (US$, Mn), 2020-2025
Table 27. By Country – North America Active Optical Module Revenue, (US$, Mn), 2026-2032
Table 28. By Country – North America Active Optical Module Sales, (K Units), 2020-2025
Table 29. By Country – North America Active Optical Module Sales, (K Units), 2026-2032
Table 30. By Country – Europe Active Optical Module Revenue, (US$, Mn), 2020-2025
Table 31. By Country – Europe Active Optical Module Revenue, (US$, Mn), 2026-2032
Table 32. By Country – Europe Active Optical Module Sales, (K Units), 2020-2025
Table 33. By Country – Europe Active Optical Module Sales, (K Units), 2026-2032
Table 34. By Region – Asia Active Optical Module Revenue, (US$, Mn), 2020-2025
Table 35. By Region – Asia Active Optical Module Revenue, (US$, Mn), 2026-2032
Table 36. By Region – Asia Active Optical Module Sales, (K Units), 2020-2025
Table 37. By Region – Asia Active Optical Module Sales, (K Units), 2026-2032
Table 38. By Country – South America Active Optical Module Revenue, (US$, Mn), 2020-2025
Table 39. By Country – South America Active Optical Module Revenue, (US$, Mn), 2026-2032
Table 40. By Country – South America Active Optical Module Sales, (K Units), 2020-2025
Table 41. By Country – South America Active Optical Module Sales, (K Units), 2026-2032
Table 42. By Country – Middle East & Africa Active Optical Module Revenue, (US$, Mn), 2020-2025
Table 43. By Country – Middle East & Africa Active Optical Module Revenue, (US$, Mn), 2026-2032
Table 44. By Country – Middle East & Africa Active Optical Module Sales, (K Units), 2020-2025
Table 45. By Country – Middle East & Africa Active Optical Module Sales, (K Units), 2026-2032
Table 46. Daiichiseiko Company Summary
Table 47. Daiichiseiko Active Optical Module Product Offerings
Table 48. Daiichiseiko Active Optical Module Sales (K Units), Revenue (US$, Mn) and Average Price (US$/Unit) & (2020-2025)
Table 49. Daiichiseiko Key News & Latest Developments
Table 50. Silicon Line Company Summary
Table 51. Silicon Line Active Optical Module Product Offerings
Table 52. Silicon Line Active Optical Module Sales (K Units), Revenue (US$, Mn) and Average Price (US$/Unit) & (2020-2025)
Table 53. Silicon Line Key News & Latest Developments
Table 54. Hisilicon Company Summary
Table 55. Hisilicon Active Optical Module Product Offerings
Table 56. Hisilicon Active Optical Module Sales (K Units), Revenue (US$, Mn) and Average Price (US$/Unit) & (2020-2025)
Table 57. Hisilicon Key News & Latest Developments
Table 58. Hisense Broadband Company Summary
Table 59. Hisense Broadband Active Optical Module Product Offerings
Table 60. Hisense Broadband Active Optical Module Sales (K Units), Revenue (US$, Mn) and Average Price (US$/Unit) & (2020-2025)
Table 61. Hisense Broadband Key News & Latest Developments
Table 62. Accelink Company Summary
Table 63. Accelink Active Optical Module Product Offerings
Table 64. Accelink Active Optical Module Sales (K Units), Revenue (US$, Mn) and Average Price (US$/Unit) & (2020-2025)
Table 65. Accelink Key News & Latest Developments
Table 66. Eoptolink Company Summary
Table 67. Eoptolink Active Optical Module Product Offerings
Table 68. Eoptolink Active Optical Module Sales (K Units), Revenue (US$, Mn) and Average Price (US$/Unit) & (2020-2025)
Table 69. Eoptolink Key News & Latest Developments
Table 70. Amphenol Company Summary
Table 71. Amphenol Active Optical Module Product Offerings
Table 72. Amphenol Active Optical Module Sales (K Units), Revenue (US$, Mn) and Average Price (US$/Unit) & (2020-2025)
Table 73. Amphenol Key News & Latest Developments
Table 74. Hilink Technology Company Summary
Table 75. Hilink Technology Active Optical Module Product Offerings
Table 76. Hilink Technology Active Optical Module Sales (K Units), Revenue (US$, Mn) and Average Price (US$/Unit) & (2020-2025)
Table 77. Hilink Technology Key News & Latest Developments
Table 78. Gearlink Company Summary
Table 79. Gearlink Active Optical Module Product Offerings
Table 80. Gearlink Active Optical Module Sales (K Units), Revenue (US$, Mn) and Average Price (US$/Unit) & (2020-2025)
Table 81. Gearlink Key News & Latest Developments
Table 82. T&S Communication Company Summary
Table 83. T&S Communication Active Optical Module Product Offerings
Table 84. T&S Communication Active Optical Module Sales (K Units), Revenue (US$, Mn) and Average Price (US$/Unit) & (2020-2025)
Table 85. T&S Communication Key News & Latest Developments
Table 86. GrenTech Company Summary
Table 87. GrenTech Active Optical Module Product Offerings
Table 88. GrenTech Active Optical Module Sales (K Units), Revenue (US$, Mn) and Average Price (US$/Unit) & (2020-2025)
Table 89. GrenTech Key News & Latest Developments
Table 90. Active Optical Module Capacity of Key Manufacturers in Global Market, 2023-2025 (K Units)
Table 91. Global Active Optical Module Capacity Market Share of Key Manufacturers, 2023-2025
Table 92. Global Active Optical Module Production by Region, 2020-2025 (K Units)
Table 93. Global Active Optical Module Production by Region, 2026-2032 (K Units)
Table 94. Active Optical Module Market Opportunities & Trends in Global Market
Table 95. Active Optical Module Market Drivers in Global Market
Table 96. Active Optical Module Market Restraints in Global Market
Table 97. Active Optical Module Raw Materials
Table 98. Active Optical Module Raw Materials Suppliers in Global Market
Table 99. Typical Active Optical Module Downstream
Table 100. Active Optical Module Downstream Clients in Global Market
Table 101. Active Optical Module Distributors and Sales Agents in Global Market

List of Figures
Figure 1. Active Optical Module Product Picture
Figure 2. Active Optical Module Segment by Type in 2024
Figure 3. Active Optical Module Segment by Application in 2024
Figure 4. Global Active Optical Module Market Overview: 2024
Figure 5. Key Caveats
Figure 6. Global Active Optical Module Market Size: 2024 VS 2032 (US$, Mn)
Figure 7. Global Active Optical Module Revenue: 2020-2032 (US$, Mn)
Figure 8. Active Optical Module Sales in Global Market: 2020-2032 (K Units)
Figure 9. The Top 3 and 5 Players Market Share by Active Optical Module Revenue in 2024
Figure 10. Segment by Type – Global Active Optical Module Revenue, (US$, Mn), 2024 & 2032
Figure 11. Segment by Type – Global Active Optical Module Revenue Market Share, 2020-2032
Figure 12. Segment by Type – Global Active Optical Module Sales Market Share, 2020-2032
Figure 13. Segment by Type – Global Active Optical Module Price (US$/Unit), 2020-2032
Figure 14. Segment by Application – Global Active Optical Module Revenue, (US$, Mn), 2024 & 2032
Figure 15. Segment by Application – Global Active Optical Module Revenue Market Share, 2020-2032
Figure 16. Segment by Application – Global Active Optical Module Sales Market Share, 2020-2032
Figure 17. Segment by Application -Global Active Optical Module Price (US$/Unit), 2020-2032
Figure 18. By Region – Global Active Optical Module Revenue, (US$, Mn), 2025 & 2032
Figure 19. By Region – Global Active Optical Module Revenue Market Share, 2020 VS 2024 VS 2032
Figure 20. By Region – Global Active Optical Module Revenue Market Share, 2020-2032
Figure 21. By Region – Global Active Optical Module Sales Market Share, 2020-2032
Figure 22. By Country – North America Active Optical Module Revenue Market Share, 2020-2032
Figure 23. By Country – North America Active Optical Module Sales Market Share, 2020-2032
Figure 24. United States Active Optical Module Revenue, (US$, Mn), 2020-2032
Figure 25. Canada Active Optical Module Revenue, (US$, Mn), 2020-2032
Figure 26. Mexico Active Optical Module Revenue, (US$, Mn), 2020-2032
Figure 27. By Country – Europe Active Optical Module Revenue Market Share, 2020-2032
Figure 28. By Country – Europe Active Optical Module Sales Market Share, 2020-2032
Figure 29. Germany Active Optical Module Revenue, (US$, Mn), 2020-2032
Figure 30. France Active Optical Module Revenue, (US$, Mn), 2020-2032
Figure 31. U.K. Active Optical Module Revenue, (US$, Mn), 2020-2032
Figure 32. Italy Active Optical Module Revenue, (US$, Mn), 2020-2032
Figure 33. Russia Active Optical Module Revenue, (US$, Mn), 2020-2032
Figure 34. Nordic Countries Active Optical Module Revenue, (US$, Mn), 2020-2032
Figure 35. Benelux Active Optical Module Revenue, (US$, Mn), 2020-2032
Figure 36. By Region – Asia Active Optical Module Revenue Market Share, 2020-2032
Figure 37. By Region – Asia Active Optical Module Sales Market Share, 2020-2032
Figure 38. China Active Optical Module Revenue, (US$, Mn), 2020-2032
Figure 39. Japan Active Optical Module Revenue, (US$, Mn), 2020-2032
Figure 40. South Korea Active Optical Module Revenue, (US$, Mn), 2020-2032
Figure 41. Southeast Asia Active Optical Module Revenue, (US$, Mn), 2020-2032
Figure 42. India Active Optical Module Revenue, (US$, Mn), 2020-2032
Figure 43. By Country – South America Active Optical Module Revenue Market Share, 2020-2032
Figure 44. By Country – South America Active Optical Module Sales, Market Share, 2020-2032
Figure 45. Brazil Active Optical Module Revenue, (US$, Mn), 2020-2032
Figure 46. Argentina Active Optical Module Revenue, (US$, Mn), 2020-2032
Figure 47. By Country – Middle East & Africa Active Optical Module Revenue, Market Share, 2020-2032
Figure 48. By Country – Middle East & Africa Active Optical Module Sales, Market Share, 2020-2032
Figure 49. Turkey Active Optical Module Revenue, (US$, Mn), 2020-2032
Figure 50. Israel Active Optical Module Revenue, (US$, Mn), 2020-2032
Figure 51. Saudi Arabia Active Optical Module Revenue, (US$, Mn), 2020-2032
Figure 52. UAE Active Optical Module Revenue, (US$, Mn), 2020-2032
Figure 53. Global Active Optical Module Production Capacity (K Units), 2020-2032
Figure 54. The Percentage of Production Active Optical Module by Region, 2024 VS 2032
Figure 55. Active Optical Module Industry Value Chain
Figure 56. Marketing Channels