Remote Plasma Sources Market Trends, Business Strategies 2026-2036

Remote Plasma Sources market reaches USD 8,922 million by 2034, reflecting a CAGR of 40.1% over the forecast period.

PDF Icon Download Sample Report PDF
  • Quick Dispatch

    All Orders

  • Secure Payment

    100% Secure Payment

Price range: $1,500.00 through $4,250.00

Clear

Remote Plasma Sources Market Insights

Remote Plasma Sources market was valued at USD 724 million in 2025 and reaches USD 8,922 million by 2034, reflecting a CAGR of 40.1% over the forecast period.

A remote plasma source (RPS) generates plasma within a vacuum chamber and transports reactive species to a target surface without direct contact. By using electric or magnetic fields to ionise feed‑gas streams, RPS enables uniform surface treatment, material modification and thin‑film deposition while minimizing thermal or chemical damage on sensitive substrates.

The expansion of advanced semiconductor nodes,such as gate‑all‑around (GAA) transistors and ultra‑high‑layer 3D NAND,creates strong demand for low‑damage plasma processes like atomic layer deposition (ALD) and in‑situ cleaning. In 2025, worldwide RPS sales are estimated at 23,748 units with an average price of USD 33,380 per unit and a gross profit margin near 42%. Leading suppliers including Advanced Energy, MKS Instruments, Veeco and Shenzhou Semiconductor are investing in performance stability and system‑level integration to meet tighter process windows.
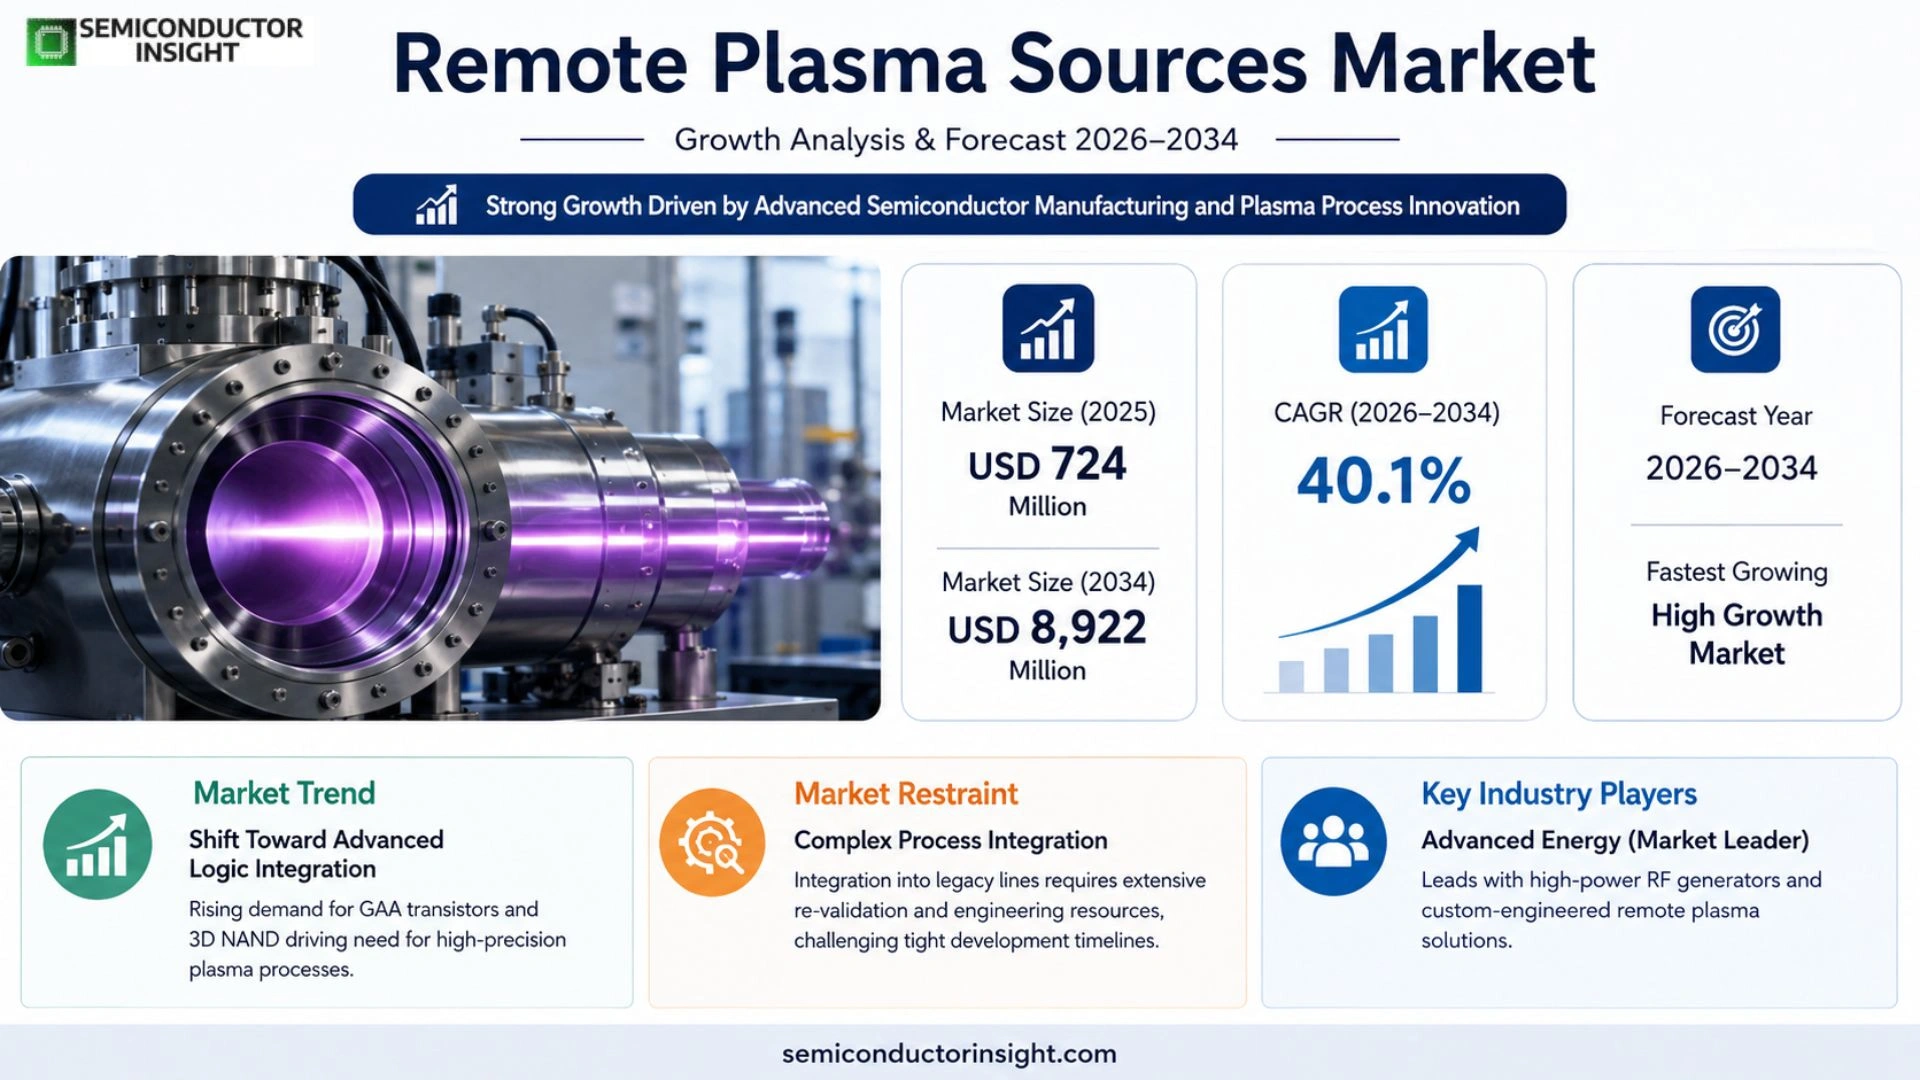
Remote Plasma Sources Market Growth 2026

MARKET DRIVERS

Technological Maturation of Remote Plasma Generators

The adoption of advanced RF matching networks has reduced power losses, enabling manufacturers to achieve higher ion densities without proportionally increasing energy consumption. This efficiency gain makes remote plasma equipment attractive for thin‑film deposition in display and solar‑cell production, where cost per unit area is a decisive factor.

Regulatory Push for Cleaner Manufacturing

Stringent emissions standards across Europe and North America compel semiconductor fabs to replace conventional glow‑discharge tools with remote plasma sources that limit volatile organic compound release. Companies that can demonstrably lower their environmental footprint gain a competitive edge in contracts that emphasize sustainability metrics.

➤ “Remote plasma technology now delivers the same surface modification quality as line‑of‑sight reactors while using 30 % less gas.”

Customer demand for higher throughput drives OEMs to integrate modular source designs that can be swapped with minimal downtime. The flexibility to re‑configure a line quickly translates into higher equipment utilization, directly influencing the profitability of Remote Plasma Sources Market.

MARKET CHALLENGES

High Capital Outlay for Integrated Systems

While the operational cost per wafer has dropped, the upfront investment required for full‑scale remote plasma platforms remains steep. Mid‑size manufacturers often struggle to secure financing, leading to a slower diffusion of the technology beyond the largest players.

Other Challenges

Supply‑Chain Vulnerabilities

The specialized ceramic and quartz components that line remote plasma chambers are sourced from a limited pool of suppliers. Any disruption,whether geopolitical or pandemic‑related,can extend lead times, forcing end users to hold higher inventory buffers.

MARKET RESTRAINTS

Complex Process Integration

Integrating remote plasma steps into legacy manufacturing lines often requires extensive re‑validation of process windows. The need for additional engineering resources can deter firms with tight development schedules.

The steep learning curve associated with tuning remote plasma parameters,such as electron temperature and neutral gas flow,creates a talent bottleneck. Companies that lack in‑house plasma physicists must rely on external consultants, inflating project costs.

MARKET OPPORTUNITIES

Emergence of Flexible Electronics

Flexible OLED and wearable sensor markets require low‑temperature surface treatments that preserve substrate integrity. Remote plasma sources, with their ability to generate energetic species at temperatures below 100 °C, are uniquely positioned to meet this niche demand.

Additionally, the rise of additive manufacturing for aerospace components introduces a need for precise surface activation prior to metal bonding. Suppliers that can package remote plasma modules as plug‑and‑play accessories will likely capture a sizeable share of this nascent application segment.

Remote Plasma Sources Market Trends

Shift Toward Advanced Logic Integration

The adoption of three‑dimensional gate‑all‑around (GAA) transistors and ultra‑high‑layer 3D NAND has tightened tolerances on interface integrity, defect density, and batch repeatability. In this context, Remote Plasma Sources Market is seeing a migration from auxiliary role to core‑process module, especially in atomic‑layer deposition (ALD) and in‑situ cleaning stages. By separating plasma generation from the wafer surface, remote sources inject only chemically active radicals, thereby curbing ion‑induced damage that traditional in‑cavity plasmas introduce. The result is a more predictable process window and higher yields on advanced logic wafers, prompting fabs to replace legacy plasma tools with remote configurations despite higher upfront cost. The 2025 valuation of US$724 million and the projected US$8.9 billion by 2034 illustrate how manufacturers are betting on this technology to sustain throughput as device architectures become increasingly intricate.

Other Trends

Cost and Verification Constraints

While remote plasma tools deliver clear performance advantages, their price point,averaging US$33,380 per unit for the 23,748 units shipped in 2025,introduces a financial hurdle for cost‑sensitive fabs. Verification cycles also lengthen, as process engineers must map radical flux to material response across a broader parameter space. Consequently, profit margins hover around 42 %, reflecting a delicate balance between premium pricing and the expense of extensive qualification. Suppliers are responding by offering modular upgrades and bundled service contracts that amortize capital outlay and shorten validation timelines, thereby making the technology more accessible to mid‑range facilities.

Reliability and System Synergy as Competitive Levers

As remote plasma devices mature, competition is moving away from the binary question of adoption toward metrics such as long‑term stability, lifespan management, and integration with broader equipment ecosystems. Companies that can demonstrate consistent radical output over extended runs, coupled with seamless communication to upstream deposition tools, gain a decisive edge. This shift aligns with the broader industry push toward system‑level optimization, where a remote plasma source functions as a deterministic process enabler rather than an isolated component. Manufacturers that embed diagnostic feedback loops and predictive maintenance algorithms are likely to capture the majority of future market share, especially as semiconductor fabs pursue higher uptime and lower total cost of ownership.

COMPETITIVE LANDSCAPE

Key Industry Players

Remote Plasma Sources Market – Competitive Overview

Advanced Energy remains the market leader, largely because its portfolio couples high‑power RF generators with custom‑engineered remote plasma modules. The firm’s ability to deliver turnkey solutions,spanning system integration, reliability testing, and after‑sale service,has secured long‑term contracts with leading semiconductor fabs, especially in ALD and in‑situ cleaning processes. Revenue from its RPS division reflects a premium pricing model, supported by a gross margin that consistently outpaces many smaller competitors. This financial strength enables sustained R&D investment, which translates into incremental performance gains such as lower ion bombardment and finer radical control, features that are increasingly demanded by manufacturers of 3‑D NAND and GAA logic devices.

Beyond the dominant player, the competitive field comprises several specialized firms that carve out niches through technology focus or regional advantage. New Power Plasma concentrates on microwave‑driven sources, offering compact units that excel in high‑density plasma generation for thin‑film deposition. MKS Instruments differentiates itself with modular product lines that can be quickly reconfigured for varying process windows, a flexibility that appeals to R&D labs and pilot production sites. European manufacturers such as Muegge GmbH and PIE Scientific leverage deep expertise in planar and tubular RPS designs, emphasizing long‑term stability and low maintenance overhead. Asian entrants,including Shenzhou Semiconductor, Shanghai Lizhao Technology, and CSL,benefit from proximity to major fabs and are rapidly expanding their service networks, while companies like Veeco and EN2CORE Technology add value through advanced diagnostics and system‑level integration capabilities.

List of Key Remote Plasma Sources Companies Profiled

  • Advanced Energy
  • MKS Instruments
  • Veeco Instruments
  • New Power Plasma
  • Muegge GmbH
  • PIE Scientific
  • EN2CORE Technology
  • Shenzhou Semiconductor
  • CSL
  • Shanghai Lizhao Technology
  • Applied Materials
  • Lam Research
  • Tokyo Electron
  • Hitachi High‑Tech
  • Sentech

Segment Analysis:

Segment Category Sub-Segments Key Insights
By Type
  • Remote Plasma Cleaner
  • Remote Plasma Processor
Remote Plasma Cleaner is emerging as the preferred choice for delicate surface treatments where thermal load must be minimized.

  • Enables uniform treatment across large wafers, reducing defect hotspots.
  • Provides gentle radical delivery, preserving fragile material interfaces.
  • Integrates seamlessly with existing vacuum lines, offering flexible process scheduling.
By Application
  • CVD
  • ALD/LPCVD
  • ETCH
  • Others
ALD/LPCVD applications benefit most from remote plasma sources because the decoupled plasma minimizes ion damage while delivering highly reactive radicals.

  • Improves film conformity on high‑aspect‑ratio structures.
  • Enhances repeatability across successive process windows.
  • Supports atomic‑level thickness control essential for next‑generation logic nodes.
By End User
  • Semiconductor Manufacturing
  • Display Panel Production
  • Solar Cell Fabrication
Semiconductor Manufacturing drives the strategic importance of remote plasma sources as device architectures become increasingly three‑dimensional.

  • Provides low‑damage surface activation crucial for gate‑all‑around (GAA) transistors.
  • Ensures consistent interface quality across ultra‑thin channel layers.
  • Facilitates in‑situ cleaning steps that sustain high‑yield production cycles.
By Incentive Method
  • Radio Frequency
  • Microwave
  • Others
Microwave based remote plasma sources are gaining traction due to their ability to generate high‑density plasma with reduced electrode wear.

  • Delivers rapid radical generation, shortening cycle times.
  • Provides superior control over ion energy distribution, protecting delicate substrates.
  • Supports modular integration, allowing manufacturers to scale capacity without major re‑engineering.
By Structural Form
  • Tubular
  • Planar
  • Jet
Planar configurations are becoming the cornerstone for high‑throughput semiconductor lines.

  • Offers uniform plasma exposure across wide substrates, essential for large‑diameter wafers.
  • Facilitates direct integration with existing batch equipment, minimizing footprint expansion.
  • Enables precise control of plasma‑surface interaction, supporting advanced patterning techniques.

Regional Analysis: Remote Plasma Sources Market

Europe

Europe maintains a sophisticated ecosystem for Remote Plasma Sources Market, driven by deep‑rooted expertise in surface engineering and a regulatory climate that rewards low‑emission technologies. Manufacturers across Germany, France, and the Nordics have cultivated supply chains that seamlessly integrate plasma generators with downstream processing lines, allowing rapid iteration of product designs. Customer demand is shaped by automotive and aerospace players seeking consistent material performance without the footprint of traditional wet processes. The region’s collaborative research networks, often anchored in university‑industry consortia, accelerate concept validation, shortening the time from laboratory to pilot scale. Consequently, European firms capture a disproportionate share of high‑value contracts, leveraging their ability to tailor plasma parameters to niche applications such as flexible electronics and advanced composites. This strategic positioning reinforces Europe’s role as a benchmark for quality and innovation in remote plasma technology.

Regulatory Advantage
European environmental directives incentivize manufacturers to adopt plasma processes that lower solvent usage. This policy backdrop encourages early investment in remote plasma equipment, granting regional suppliers a head‑start in meeting compliance expectations across multiple industries.
Industrial Collaboration
Cross‑border partnerships between equipment makers and end‑users foster co‑development programs. These alliances accelerate the translation of plasma science into turnkey solutions, reinforcing Europe’s reputation for collaborative innovation.
Skilled Workforce
A dense concentration of engineers skilled in vacuum technologies underpins rapid prototyping cycles. This talent pool enables firms to fine‑tune plasma sources for emerging material challenges, sustaining competitive differentiation.
Supply Chain Resilience
Proximity of component manufacturers to end‑users shortens lead times and reduces logistical complexity, allowing European players to respond swiftly to shifting customer specifications.

North America
North America’s Remote Plasma Sources Market is shaped by a blend of large‑scale semiconductor fabs and a burgeoning interest in sustainable manufacturing across the automotive sector. Companies benefit from a venture‑capital environment that fuels start‑ups specializing in modular plasma units, encouraging diversification of application spaces. While the region enjoys deep technical expertise, the competitive landscape forces suppliers to continuously differentiate through software‑driven process control, delivering greater repeatability for customers. The presence of major research institutions supports a pipeline of novel plasma chemistries, translating into bespoke solutions for medical device sterilization and advanced coating processes.

Asia‑Pacific
In Asia‑Pacific, rapid industrialization and cost‑sensitive production environments drive the adoption of remote plasma technologies that can enhance yield without extensive capital outlay. Nations such as Japan and South Korea leverage legacy strengths in precision engineering to fine‑tune plasma parameters for high‑value electronics, whereas emerging economies focus on scaling the technology for bulk textile and polymer treatments. Regional trade associations are instrumental in establishing standards that harmonize equipment specifications, creating a smoother entry path for multinational vendors. The market narrative is increasingly defined by the tension between price competitiveness and the need for reliable, high‑performance plasma solutions.

South America
South America’s engagement with Remote Plasma Sources Market remains centered on resource‑intensive sectors like mining and pulp processing, where plasma treatments can replace hazardous chemicals. Local manufacturers are experimenting with hybrid approaches that combine plasma with traditional methods, aiming to reduce operational costs while meeting stricter environmental expectations. Government incentives for clean technology adoption, though modest, signal a strategic shift toward greener processing. As regional players gain confidence, they are beginning to tailor plasma solutions for niche agricultural applications, opening a new frontier for market expansion.

Middle East & Africa
The Middle East & Africa region is witnessing an incremental rise in interest for remote plasma applications, largely driven by oil‑and‑gas operators seeking corrosion‑resistant coatings for infrastructure. Collaborative projects between multinational equipment providers and regional engineering firms are catalyzing knowledge transfer, gradually building indigenous expertise. In parallel, emerging renewable‑energy initiatives are exploring plasma‑based surface modifications for solar panel durability, hinting at a diversification of demand. Despite infrastructural challenges, the region’s strategic investments in research hubs suggest a long‑term commitment to integrating plasma technology within its industrial transformation agenda.

Report Scope

This market research report provides a comprehensive analysis of the Remote Plasma Sources Market , covering the forecast period 2026–2034. It offers detailed insights into market dynamics, technological advancements, competitive landscape, and key trends shaping the industry.

Key focus areas of the report include:

  • Market Overview: The report begins with an overview outlining its current market scenario, key growth indicators, and industry transformation drivers. It discusses macroeconomic factors, demand–supply balance, regulatory landscape, and the strategic role of semiconductors in powering advancements across industries such as automotive, telecommunications, consumer electronics, and industrial automation.
  • Market Size & Forecast: Historical data and future projections for revenue, unit shipments, and market value across major regions and segments.
  • Segmentation Analysis: Detailed breakdown by product type, technology, application, and end-user industry to identify high-growth segments and investment opportunities.
  • Regional Insights: Insights into market performance across North America, Europe, Asia-Pacific, Latin America, and the Middle East & Africa, including country-level analysis where relevant.
  • Competitive Landscape: Profiles of leading market participants, including their product offerings, R&D focus, manufacturing capacity, pricing strategies, and recent developments such as mergers, acquisitions, and partnerships.
  • Technology Trends & Innovation: Assessment of emerging technologies, integration of AI/IoT, semiconductor design trends, fabrication techniques, and evolving industry standards.
  • Market Drivers & Restraints: Evaluation of factors driving market growth along with challenges, supply chain constraints, regulatory issues, and market-entry barriers.
  • Stakeholder Insights: Insights for component suppliers, OEMs, system integrators, investors, and policymakers regarding the evolving ecosystem and strategic opportunities.

Primary and secondary research methods are employed, including interviews with industry experts, data from verified sources, and real-time market intelligence to ensure the accuracy and reliability of the insights presented.

FREQUENTLY ASKED QUESTIONS:

What is the current market size of Remote Plasma Sources Market?

-> Remote Plasma Sources market reaches USD 8,922 million by 2034, reflecting a CAGR of 40.1% over the forecast period.

Which key companies operate in Remote Plasma Sources Market?

-> Key players include Advanced Energy, New Power Plasma, Samco-ucp, MKS Instruments, Muegge GmbH, PIE Scientific, EN2CORE Technology, Veeco, Shenzhou Semiconductor, CSL, and Shanghai Lizhao Technology.

What are the key growth drivers?

-> Key growth drivers include the expanding adoption of advanced semiconductor processes such as ALD and in‑situ cleaning, the need for low‑damage plasma treatments, increasing demand for high‑uniformity surface modification, and the push for equipment localization and system‑level integration.

Which region dominates the market?

-> Asia‑Pacific leads the market, driven by high semiconductor manufacturing activity in China, Japan, and South Korea, while North America and Europe also show strong growth.

What are the emerging trends?

-> Emerging trends include tighter integration of remote plasma sources with atomic‑layer‑deposition modules, development of cost‑effective microwave‑based RPS, and increased focus on reliability, lifespan management, and process synergy capabilities.

Remote Plasma Sources Market Trends, Business Strategies 2026-2036

Get Sample Report PDF for Exclusive Insights

Report Sample Includes

  • Table of Contents
  • List of Tables & Figures
  • Charts, Research Methodology, and more...

PDF Icon Download Sample Report PDF

Download Sample Report

Table of Content

1 Introduction to Research & Analysis Reports
1.1 Remote Plasma Sources Market Definition
1.2 Market Segments
1.2.1 Segment by Type
1.2.2 Segment by Application
1.3 Global Remote Plasma Sources Market Overview
1.4 Features & Benefits of This Report
1.5 Methodology & Sources of Information
1.5.1 Research Methodology
1.5.2 Research Process
1.5.3 Base Year
1.5.4 Report Assumptions & Caveats
2 Global Remote Plasma Sources Overall Market Size
2.1 Global Remote Plasma Sources Market Size: 2024 VS 2031
2.2 Global Remote Plasma Sources Market Size, Prospects & Forecasts: 2020-2031
2.3 Global Remote Plasma Sources Sales: 2020-2031
3 Company Landscape
3.1 Top Remote Plasma Sources Players in Global Market
3.2 Top Global Remote Plasma Sources Companies Ranked by Revenue
3.3 Global Remote Plasma Sources Revenue by Companies
3.4 Global Remote Plasma Sources Sales by Companies
3.5 Global Remote Plasma Sources Price by Manufacturer (2020-2025)
3.6 Top 3 and Top 5 Remote Plasma Sources Companies in Global Market, by Revenue in 2024
3.7 Global Manufacturers Remote Plasma Sources Product Type
3.8 Tier 1, Tier 2, and Tier 3 Remote Plasma Sources Players in Global Market
3.8.1 List of Global Tier 1 Remote Plasma Sources Companies
3.8.2 List of Global Tier 2 and Tier 3 Remote Plasma Sources Companies
4 Sights by Product
4.1 Overview
4.1.1 Segment by Type – Global Remote Plasma Sources Market Size Markets, 2024 & 2031
4.1.2 Remote Plasma Cleaner
4.1.3 Remote Plasma Processor
4.2 Segment by Type – Global Remote Plasma Sources Revenue & Forecasts
4.2.1 Segment by Type – Global Remote Plasma Sources Revenue, 2020-2025
4.2.2 Segment by Type – Global Remote Plasma Sources Revenue, 2026-2031
4.2.3 Segment by Type – Global Remote Plasma Sources Revenue Market Share, 2020-2031
4.3 Segment by Type – Global Remote Plasma Sources Sales & Forecasts
4.3.1 Segment by Type – Global Remote Plasma Sources Sales, 2020-2025
4.3.2 Segment by Type – Global Remote Plasma Sources Sales, 2026-2031
4.3.3 Segment by Type – Global Remote Plasma Sources Sales Market Share, 2020-2031
4.4 Segment by Type – Global Remote Plasma Sources Price (Manufacturers Selling Prices), 2020-2031
5 Sights by Application
5.1 Overview
5.1.1 Segment by Application – Global Remote Plasma Sources Market Size, 2024 & 2031
5.1.2 CVD
5.1.3 ALD/LPCVD
5.1.4 ETCH
5.1.5 Others
5.2 Segment by Application – Global Remote Plasma Sources Revenue & Forecasts
5.2.1 Segment by Application – Global Remote Plasma Sources Revenue, 2020-2025
5.2.2 Segment by Application – Global Remote Plasma Sources Revenue, 2026-2031
5.2.3 Segment by Application – Global Remote Plasma Sources Revenue Market Share, 2020-2031
5.3 Segment by Application – Global Remote Plasma Sources Sales & Forecasts
5.3.1 Segment by Application – Global Remote Plasma Sources Sales, 2020-2025
5.3.2 Segment by Application – Global Remote Plasma Sources Sales, 2026-2031
5.3.3 Segment by Application – Global Remote Plasma Sources Sales Market Share, 2020-2031
5.4 Segment by Application – Global Remote Plasma Sources Price (Manufacturers Selling Prices), 2020-2031
6 Sights by Region
6.1 By Region – Global Remote Plasma Sources Market Size, 2024 & 2031
6.2 By Region – Global Remote Plasma Sources Revenue & Forecasts
6.2.1 By Region – Global Remote Plasma Sources Revenue, 2020-2025
6.2.2 By Region – Global Remote Plasma Sources Revenue, 2026-2031
6.2.3 By Region – Global Remote Plasma Sources Revenue Market Share, 2020-2031
6.3 By Region – Global Remote Plasma Sources Sales & Forecasts
6.3.1 By Region – Global Remote Plasma Sources Sales, 2020-2025
6.3.2 By Region – Global Remote Plasma Sources Sales, 2026-2031
6.3.3 By Region – Global Remote Plasma Sources Sales Market Share, 2020-2031
6.4 North America
6.4.1 By Country – North America Remote Plasma Sources Revenue, 2020-2031
6.4.2 By Country – North America Remote Plasma Sources Sales, 2020-2031
6.4.3 United States Remote Plasma Sources Market Size, 2020-2031
6.4.4 Canada Remote Plasma Sources Market Size, 2020-2031
6.4.5 Mexico Remote Plasma Sources Market Size, 2020-2031
6.5 Europe
6.5.1 By Country – Europe Remote Plasma Sources Revenue, 2020-2031
6.5.2 By Country – Europe Remote Plasma Sources Sales, 2020-2031
6.5.3 Germany Remote Plasma Sources Market Size, 2020-2031
6.5.4 France Remote Plasma Sources Market Size, 2020-2031
6.5.5 U.K. Remote Plasma Sources Market Size, 2020-2031
6.5.6 Italy Remote Plasma Sources Market Size, 2020-2031
6.5.7 Russia Remote Plasma Sources Market Size, 2020-2031
6.5.8 Nordic Countries Remote Plasma Sources Market Size, 2020-2031
6.5.9 Benelux Remote Plasma Sources Market Size, 2020-2031
6.6 Asia
6.6.1 By Region – Asia Remote Plasma Sources Revenue, 2020-2031
6.6.2 By Region – Asia Remote Plasma Sources Sales, 2020-2031
6.6.3 China Remote Plasma Sources Market Size, 2020-2031
6.6.4 Japan Remote Plasma Sources Market Size, 2020-2031
6.6.5 South Korea Remote Plasma Sources Market Size, 2020-2031
6.6.6 Southeast Asia Remote Plasma Sources Market Size, 2020-2031
6.6.7 India Remote Plasma Sources Market Size, 2020-2031
6.7 South America
6.7.1 By Country – South America Remote Plasma Sources Revenue, 2020-2031
6.7.2 By Country – South America Remote Plasma Sources Sales, 2020-2031
6.7.3 Brazil Remote Plasma Sources Market Size, 2020-2031
6.7.4 Argentina Remote Plasma Sources Market Size, 2020-2031
6.8 Middle East & Africa
6.8.1 By Country – Middle East & Africa Remote Plasma Sources Revenue, 2020-2031
6.8.2 By Country – Middle East & Africa Remote Plasma Sources Sales, 2020-2031
6.8.3 Turkey Remote Plasma Sources Market Size, 2020-2031
6.8.4 Israel Remote Plasma Sources Market Size, 2020-2031
6.8.5 Saudi Arabia Remote Plasma Sources Market Size, 2020-2031
6.8.6 UAE Remote Plasma Sources Market Size, 2020-2031
7 Manufacturers & Brands Profiles
7.1 Advanced Energy
7.1.1 Advanced Energy Company Summary
7.1.2 Advanced Energy Business Overview
7.1.3 Advanced Energy Remote Plasma Sources Major Product Offerings
7.1.4 Advanced Energy Remote Plasma Sources Sales and Revenue in Global (2020-2025)
7.1.5 Advanced Energy Key News & Latest Developments
7.2 New Power Plasma
7.2.1 New Power Plasma Company Summary
7.2.2 New Power Plasma Business Overview
7.2.3 New Power Plasma Remote Plasma Sources Major Product Offerings
7.2.4 New Power Plasma Remote Plasma Sources Sales and Revenue in Global (2020-2025)
7.2.5 New Power Plasma Key News & Latest Developments
7.3 Samco-ucp
7.3.1 Samco-ucp Company Summary
7.3.2 Samco-ucp Business Overview
7.3.3 Samco-ucp Remote Plasma Sources Major Product Offerings
7.3.4 Samco-ucp Remote Plasma Sources Sales and Revenue in Global (2020-2025)
7.3.5 Samco-ucp Key News & Latest Developments
7.4 MKS Instruments
7.4.1 MKS Instruments Company Summary
7.4.2 MKS Instruments Business Overview
7.4.3 MKS Instruments Remote Plasma Sources Major Product Offerings
7.4.4 MKS Instruments Remote Plasma Sources Sales and Revenue in Global (2020-2025)
7.4.5 MKS Instruments Key News & Latest Developments
7.5 Muegge GmbH
7.5.1 Muegge GmbH Company Summary
7.5.2 Muegge GmbH Business Overview
7.5.3 Muegge GmbH Remote Plasma Sources Major Product Offerings
7.5.4 Muegge GmbH Remote Plasma Sources Sales and Revenue in Global (2020-2025)
7.5.5 Muegge GmbH Key News & Latest Developments
7.6 PIE Scientific
7.6.1 PIE Scientific Company Summary
7.6.2 PIE Scientific Business Overview
7.6.3 PIE Scientific Remote Plasma Sources Major Product Offerings
7.6.4 PIE Scientific Remote Plasma Sources Sales and Revenue in Global (2020-2025)
7.6.5 PIE Scientific Key News & Latest Developments
7.7 Adtec Plasma Technology
7.7.1 Adtec Plasma Technology Company Summary
7.7.2 Adtec Plasma Technology Business Overview
7.7.3 Adtec Plasma Technology Remote Plasma Sources Major Product Offerings
7.7.4 Adtec Plasma Technology Remote Plasma Sources Sales and Revenue in Global (2020-2025)
7.7.5 Adtec Plasma Technology Key News & Latest Developments
8 Global Remote Plasma Sources Production Capacity, Analysis
8.1 Global Remote Plasma Sources Production Capacity, 2020-2031
8.2 Remote Plasma Sources Production Capacity of Key Manufacturers in Global Market
8.3 Global Remote Plasma Sources Production by Region
9 Key Market Trends, Opportunity, Drivers and Restraints
9.1 Market Opportunities & Trends
9.2 Market Drivers
9.3 Market Restraints
10 Remote Plasma Sources Supply Chain Analysis
10.1 Remote Plasma Sources Industry Value Chain
10.2 Remote Plasma Sources Upstream Market
10.3 Remote Plasma Sources Downstream and Clients
10.4 Marketing Channels Analysis
10.4.1 Marketing Channels
10.4.2 Remote Plasma Sources Distributors and Sales Agents in Global
11 Conclusion
12 Appendix
12.1 Note
12.2 Examples of Clients
12.3 DisclaimerList of Tables
Table 1. Key Players of Remote Plasma Sources in Global Market
Table 2. Top Remote Plasma Sources Players in Global Market, Ranking by Revenue (2024)
Table 3. Global Remote Plasma Sources Revenue by Companies, (US$, Mn), 2020-2025
Table 4. Global Remote Plasma Sources Revenue Share by Companies, 2020-2025
Table 5. Global Remote Plasma Sources Sales by Companies, (Units), 2020-2025
Table 6. Global Remote Plasma Sources Sales Share by Companies, 2020-2025
Table 7. Key Manufacturers Remote Plasma Sources Price (2020-2025) & (K US$/Unit)
Table 8. Global Manufacturers Remote Plasma Sources Product Type
Table 9. List of Global Tier 1 Remote Plasma Sources Companies, Revenue (US$, Mn) in 2024 and Market Share
Table 10. List of Global Tier 2 and Tier 3 Remote Plasma Sources Companies, Revenue (US$, Mn) in 2024 and Market Share
Table 11. Segment by Type – Global Remote Plasma Sources Revenue, (US$, Mn), 2024 & 2031
Table 12. Segment by Type – Global Remote Plasma Sources Revenue (US$, Mn), 2020-2025
Table 13. Segment by Type – Global Remote Plasma Sources Revenue (US$, Mn), 2026-2031
Table 14. Segment by Type – Global Remote Plasma Sources Sales (Units), 2020-2025
Table 15. Segment by Type – Global Remote Plasma Sources Sales (Units), 2026-2031
Table 16. Segment by Application – Global Remote Plasma Sources Revenue, (US$, Mn), 2024 & 2031
Table 17. Segment by Application – Global Remote Plasma Sources Revenue, (US$, Mn), 2020-2025
Table 18. Segment by Application – Global Remote Plasma Sources Revenue, (US$, Mn), 2026-2031
Table 19. Segment by Application – Global Remote Plasma Sources Sales, (Units), 2020-2025
Table 20. Segment by Application – Global Remote Plasma Sources Sales, (Units), 2026-2031
Table 21. By Region – Global Remote Plasma Sources Revenue, (US$, Mn), 2025-2031
Table 22. By Region – Global Remote Plasma Sources Revenue, (US$, Mn), 2020-2025
Table 23. By Region – Global Remote Plasma Sources Revenue, (US$, Mn), 2026-2031
Table 24. By Region – Global Remote Plasma Sources Sales, (Units), 2020-2025
Table 25. By Region – Global Remote Plasma Sources Sales, (Units), 2026-2031
Table 26. By Country – North America Remote Plasma Sources Revenue, (US$, Mn), 2020-2025
Table 27. By Country – North America Remote Plasma Sources Revenue, (US$, Mn), 2026-2031
Table 28. By Country – North America Remote Plasma Sources Sales, (Units), 2020-2025
Table 29. By Country – North America Remote Plasma Sources Sales, (Units), 2026-2031
Table 30. By Country – Europe Remote Plasma Sources Revenue, (US$, Mn), 2020-2025
Table 31. By Country – Europe Remote Plasma Sources Revenue, (US$, Mn), 2026-2031
Table 32. By Country – Europe Remote Plasma Sources Sales, (Units), 2020-2025
Table 33. By Country – Europe Remote Plasma Sources Sales, (Units), 2026-2031
Table 34. By Region – Asia Remote Plasma Sources Revenue, (US$, Mn), 2020-2025
Table 35. By Region – Asia Remote Plasma Sources Revenue, (US$, Mn), 2026-2031
Table 36. By Region – Asia Remote Plasma Sources Sales, (Units), 2020-2025
Table 37. By Region – Asia Remote Plasma Sources Sales, (Units), 2026-2031
Table 38. By Country – South America Remote Plasma Sources Revenue, (US$, Mn), 2020-2025
Table 39. By Country – South America Remote Plasma Sources Revenue, (US$, Mn), 2026-2031
Table 40. By Country – South America Remote Plasma Sources Sales, (Units), 2020-2025
Table 41. By Country – South America Remote Plasma Sources Sales, (Units), 2026-2031
Table 42. By Country – Middle East & Africa Remote Plasma Sources Revenue, (US$, Mn), 2020-2025
Table 43. By Country – Middle East & Africa Remote Plasma Sources Revenue, (US$, Mn), 2026-2031
Table 44. By Country – Middle East & Africa Remote Plasma Sources Sales, (Units), 2020-2025
Table 45. By Country – Middle East & Africa Remote Plasma Sources Sales, (Units), 2026-2031
Table 46. Advanced Energy Company Summary
Table 47. Advanced Energy Remote Plasma Sources Product Offerings
Table 48. Advanced Energy Remote Plasma Sources Sales (Units), Revenue (US$, Mn) and Average Price (K US$/Unit) & (2020-2025)
Table 49. Advanced Energy Key News & Latest Developments
Table 50. New Power Plasma Company Summary
Table 51. New Power Plasma Remote Plasma Sources Product Offerings
Table 52. New Power Plasma Remote Plasma Sources Sales (Units), Revenue (US$, Mn) and Average Price (K US$/Unit) & (2020-2025)
Table 53. New Power Plasma Key News & Latest Developments
Table 54. Samco-ucp Company Summary
Table 55. Samco-ucp Remote Plasma Sources Product Offerings
Table 56. Samco-ucp Remote Plasma Sources Sales (Units), Revenue (US$, Mn) and Average Price (K US$/Unit) & (2020-2025)
Table 57. Samco-ucp Key News & Latest Developments
Table 58. MKS Instruments Company Summary
Table 59. MKS Instruments Remote Plasma Sources Product Offerings
Table 60. MKS Instruments Remote Plasma Sources Sales (Units), Revenue (US$, Mn) and Average Price (K US$/Unit) & (2020-2025)
Table 61. MKS Instruments Key News & Latest Developments
Table 62. Muegge GmbH Company Summary
Table 63. Muegge GmbH Remote Plasma Sources Product Offerings
Table 64. Muegge GmbH Remote Plasma Sources Sales (Units), Revenue (US$, Mn) and Average Price (K US$/Unit) & (2020-2025)
Table 65. Muegge GmbH Key News & Latest Developments
Table 66. PIE Scientific Company Summary
Table 67. PIE Scientific Remote Plasma Sources Product Offerings
Table 68. PIE Scientific Remote Plasma Sources Sales (Units), Revenue (US$, Mn) and Average Price (K US$/Unit) & (2020-2025)
Table 69. PIE Scientific Key News & Latest Developments
Table 70. Adtec Plasma Technology Company Summary
Table 71. Adtec Plasma Technology Remote Plasma Sources Product Offerings
Table 72. Adtec Plasma Technology Remote Plasma Sources Sales (Units), Revenue (US$, Mn) and Average Price (K US$/Unit) & (2020-2025)
Table 73. Adtec Plasma Technology Key News & Latest Developments
Table 74. Remote Plasma Sources Capacity of Key Manufacturers in Global Market, 2023-2025 (Units)
Table 75. Global Remote Plasma Sources Capacity Market Share of Key Manufacturers, 2023-2025
Table 76. Global Remote Plasma Sources Production by Region, 2020-2025 (Units)
Table 77. Global Remote Plasma Sources Production by Region, 2026-2031 (Units)
Table 78. Remote Plasma Sources Market Opportunities & Trends in Global Market
Table 79. Remote Plasma Sources Market Drivers in Global Market
Table 80. Remote Plasma Sources Market Restraints in Global Market
Table 81. Remote Plasma Sources Raw Materials
Table 82. Remote Plasma Sources Raw Materials Suppliers in Global Market
Table 83. Typical Remote Plasma Sources Downstream
Table 84. Remote Plasma Sources Downstream Clients in Global Market
Table 85. Remote Plasma Sources Distributors and Sales Agents in Global Market

List of Figures
Figure 1. Remote Plasma Sources Product Picture
Figure 2. Remote Plasma Sources Segment by Type in 2024
Figure 3. Remote Plasma Sources Segment by Application in 2024
Figure 4. Global Remote Plasma Sources Market Overview: 2024
Figure 5. Key Caveats
Figure 6. Global Remote Plasma Sources Market Size: 2024 VS 2031 (US$, Mn)
Figure 7. Global Remote Plasma Sources Revenue: 2020-2031 (US$, Mn)
Figure 8. Remote Plasma Sources Sales in Global Market: 2020-2031 (Units)
Figure 9. The Top 3 and 5 Players Market Share by Remote Plasma Sources Revenue in 2024
Figure 10. Segment by Type – Global Remote Plasma Sources Revenue, (US$, Mn), 2024 & 2031
Figure 11. Segment by Type – Global Remote Plasma Sources Revenue Market Share, 2020-2031
Figure 12. Segment by Type – Global Remote Plasma Sources Sales Market Share, 2020-2031
Figure 13. Segment by Type – Global Remote Plasma Sources Price (K US$/Unit), 2020-2031
Figure 14. Segment by Application – Global Remote Plasma Sources Revenue, (US$, Mn), 2024 & 2031
Figure 15. Segment by Application – Global Remote Plasma Sources Revenue Market Share, 2020-2031
Figure 16. Segment by Application – Global Remote Plasma Sources Sales Market Share, 2020-2031
Figure 17. Segment by Application -Global Remote Plasma Sources Price (K US$/Unit), 2020-2031
Figure 18. By Region – Global Remote Plasma Sources Revenue, (US$, Mn), 2025 & 2031
Figure 19. By Region – Global Remote Plasma Sources Revenue Market Share, 2020 VS 2024 VS 2031
Figure 20. By Region – Global Remote Plasma Sources Revenue Market Share, 2020-2031
Figure 21. By Region – Global Remote Plasma Sources Sales Market Share, 2020-2031
Figure 22. By Country – North America Remote Plasma Sources Revenue Market Share, 2020-2031
Figure 23. By Country – North America Remote Plasma Sources Sales Market Share, 2020-2031
Figure 24. United States Remote Plasma Sources Revenue, (US$, Mn), 2020-2031
Figure 25. Canada Remote Plasma Sources Revenue, (US$, Mn), 2020-2031
Figure 26. Mexico Remote Plasma Sources Revenue, (US$, Mn), 2020-2031
Figure 27. By Country – Europe Remote Plasma Sources Revenue Market Share, 2020-2031
Figure 28. By Country – Europe Remote Plasma Sources Sales Market Share, 2020-2031
Figure 29. Germany Remote Plasma Sources Revenue, (US$, Mn), 2020-2031
Figure 30. France Remote Plasma Sources Revenue, (US$, Mn), 2020-2031
Figure 31. U.K. Remote Plasma Sources Revenue, (US$, Mn), 2020-2031
Figure 32. Italy Remote Plasma Sources Revenue, (US$, Mn), 2020-2031
Figure 33. Russia Remote Plasma Sources Revenue, (US$, Mn), 2020-2031
Figure 34. Nordic Countries Remote Plasma Sources Revenue, (US$, Mn), 2020-2031
Figure 35. Benelux Remote Plasma Sources Revenue, (US$, Mn), 2020-2031
Figure 36. By Region – Asia Remote Plasma Sources Revenue Market Share, 2020-2031
Figure 37. By Region – Asia Remote Plasma Sources Sales Market Share, 2020-2031
Figure 38. China Remote Plasma Sources Revenue, (US$, Mn), 2020-2031
Figure 39. Japan Remote Plasma Sources Revenue, (US$, Mn), 2020-2031
Figure 40. South Korea Remote Plasma Sources Revenue, (US$, Mn), 2020-2031
Figure 41. Southeast Asia Remote Plasma Sources Revenue, (US$, Mn), 2020-2031
Figure 42. India Remote Plasma Sources Revenue, (US$, Mn), 2020-2031
Figure 43. By Country – South America Remote Plasma Sources Revenue Market Share, 2020-2031
Figure 44. By Country – South America Remote Plasma Sources Sales, Market Share, 2020-2031
Figure 45. Brazil Remote Plasma Sources Revenue, (US$, Mn), 2020-2031
Figure 46. Argentina Remote Plasma Sources Revenue, (US$, Mn), 2020-2031
Figure 47. By Country – Middle East & Africa Remote Plasma Sources Revenue, Market Share, 2020-2031
Figure 48. By Country – Middle East & Africa Remote Plasma Sources Sales, Market Share, 2020-2031
Figure 49. Turkey Remote Plasma Sources Revenue, (US$, Mn), 2020-2031
Figure 50. Israel Remote Plasma Sources Revenue, (US$, Mn), 2020-2031
Figure 51. Saudi Arabia Remote Plasma Sources Revenue, (US$, Mn), 2020-2031
Figure 52. UAE Remote Plasma Sources Revenue, (US$, Mn), 2020-2031
Figure 53. Global Remote Plasma Sources Production Capacity (Units), 2020-2031
Figure 54. The Percentage of Production Remote Plasma Sources by Region, 2024 VS 2031
Figure 55. Remote Plasma Sources Industry Value Chain
Figure 56. Marketing Channels
