Key Statistics
Key Takeaways
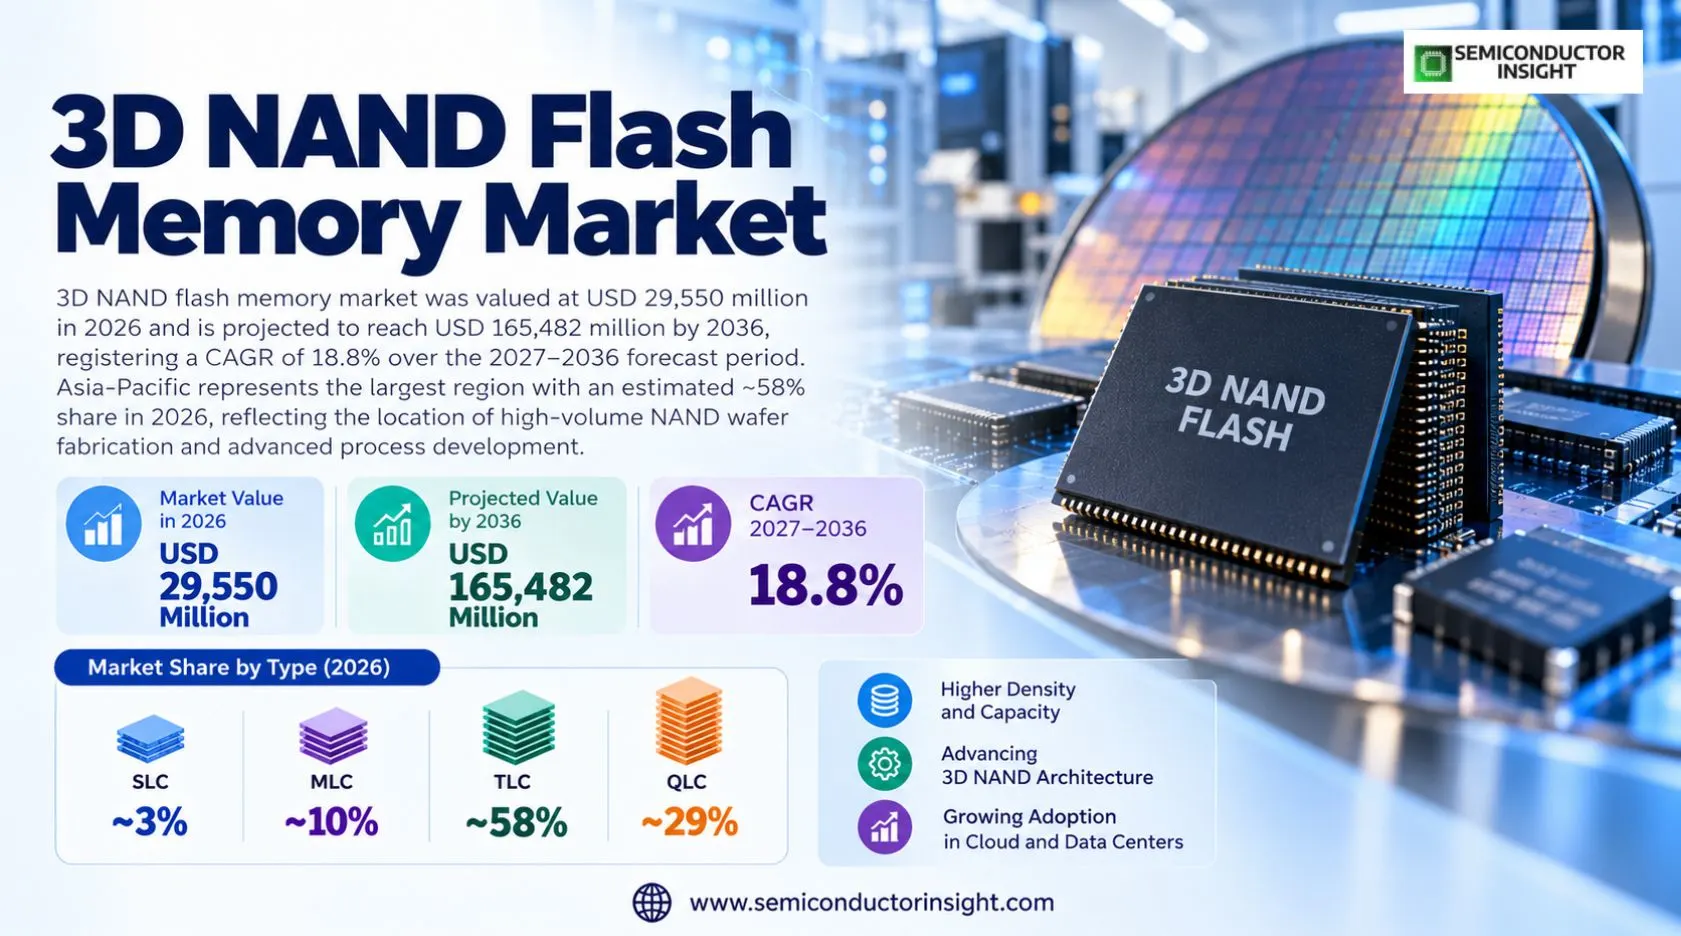
- 2026 market: USD 29,550 million of factory-gate 3D NAND flash die and package revenue anchors the market, covering storage silicon sold into enterprise SSDs, client SSDs, managed mobile storage and industrial equipment rather than the retail value of complete drives.
- 2036 outlook: USD 165,482 million is the 2036 modeled endpoint, representing a 18.8% annualized expansion from the 2026 baseline as higher layer counts, denser QLC devices and data-center demand support rising flash-bit shipments despite cyclical average selling prices.
- Type mix: TLC holds an estimated ~58% of 2026 NAND silicon revenue, while QLC at an estimated ~29% offers the strongest density-led migration path; legacy MLC and specialized SLC serve smaller endurance-led markets.
- Applications: Enterprise SSDs represent an estimated ~38% of die-level demand, followed by client SSDs at ~30% and mobile UFS/eMMC at ~25%; application shares refer to flash content rather than finished device selling prices.
- Regional structure: Asia-Pacific accounts for an estimated ~58% of 2026 revenue through the concentration of Korean, Japanese and Chinese wafer operations; North America at ~23% remains a powerful enterprise-storage design and consumption center.
- Layer transition: Products using 200+ layers hold an estimated ~59% of 2026 market value, with SK hynix 321-layer QLC and Kioxia-Sandisk 332-layer announcements indicating where new process investment is directed.
- Competition: Samsung, SK hynix, Micron, Kioxia, Sandisk and YMTC shape high-volume NAND competition; legacy company names and downstream module suppliers must not be treated as independent wafer manufacturers.
- Market boundary: Forecasts span 2027–2036, with six separately reconciled modeled dimensions: Region, Type, Application, End User, Layer Count and Cell Structure; all share splits are scenario estimates, not audited supplier disclosures.
3D NAND Flash Memory Market Overview
3D NAND flash memory market was valued at USD 29,550 million in 2026 and is projected to reach USD 165,482 million by 2036, registering a CAGR of 18.8% over the 2027–2036 forecast period. Asia-Pacific represents the largest region with an estimated ~58% share in 2026, reflecting the location of high-volume NAND wafer fabrication and advanced process development.
3D NAND is nonvolatile flash memory built by vertically stacking storage cells, allowing manufacturers to add bits per wafer without relying exclusively on planar transistor shrinkage. Revenue in this market represents the value of NAND flash dies and semiconductor packages delivered to customers or integrated internally at a comparable factory-gate value. A complete 122TB enterprise SSD includes controller, firmware, enclosure and service margin, so its invoice price cannot be counted as NAND semiconductor revenue. The distinction is essential when comparing memory makers with system vendors.
In 2026, TLC NAND remains the mainstream choice because its three-bit-per-cell architecture balances endurance, density and controller complexity across enterprise, client and mobile products. QLC raises capacity to four bits per cell and benefits from improvements in error correction, write caching and over-provisioning. Micron markets SLC, MLC, TLC and QLC NAND families, illustrating that different endurance requirements coexist even as 200+ layer production becomes more common. The transition changes the value of each wafer as well as the economics of qualification.
SK hynix disclosed mass production of 321-layer 2Tb QLC NAND in August 2025, with six internal planes instead of four and claimed write-performance and efficiency improvements. Kioxia and Sandisk disclosed a 332-layer QLC architecture in August 2026 with a 4.8Gb/s interface and CMOS-directly-bonded-to-array integration. These are verifiable technology milestones rather than direct proof of market-size estimates. Their commercial importance lies in how process yield, test time, die area and packaging affect cost per bit at scale.
The demand profile is increasingly shaped by enterprise cloud storage, AI training datasets, inference retrieval, mobile devices and PC refresh cycles. Sandisk demonstrated a 256TB enterprise SSD using BiCS8 QLC technology in August 2025, while SK hynix began supplying a 321-layer QLC client SSD in April 2026. Both examples demonstrate end-system demand for NAND, but the semiconductor revenue boundary excludes their controllers and finished-system premiums. Procurement decisions depend on endurance class, latency consistency, power per stored terabyte and qualification lead times.
Supply is concentrated in a small group of capital-intensive producers whose 2026–2036 investments must overcome process complexity and cyclical pricing. Kioxia and Sandisk began tenth-generation production at Kitakami Fab2 in July 2026 and later announced planned investment exceeding USD 31 billion through 2032, subject to support conditions. Their January 2026 Yokkaichi agreement extension to 2034 underscores the value of shared wafer capacity. The long-range revenue scenario remains sensitive to utilization, yield learning, bit growth and price changes; manufacturer disclosures do not audit its regional allocations.
Segment Analysis: By Type
By type, SLC, MLC, TLC and QLC describe one, two, three and four stored bits per cell, respectively. TLC carries an estimated ~58% of 2026 die-level revenue, while QLC accounts for ~29% and is growing faster as cloud operators favor capacity per rack. SLC and MLC remain smaller but valuable in industrial and qualified systems. For cell architecture, 2027 contracts hinge on endurance, density and controller correction; by 2031, cell architecture qualification shifts the cost calculus, and 2036 outcomes depend on endurance, density and controller correction translating into durable flash-bit shipments.
| Cell type | Technology and application fit | 2026 modeled share and commercial position |
|---|---|---|
| SLC | One-bit storage minimizes threshold-voltage states and offers high endurance and predictable read behavior. It is appropriate for industrial logging, boot storage and demanding write workloads where component availability matters more than peak bits per wafer. For SLC, 2027 contracts hinge on bits per cell, cycling endurance and error correction; by 2031, SLC qualification shifts the cost calculus, and 2036 outcomes depend on bits per cell, cycling endurance and error correction translating into durable flash-bit shipments. | Estimated ~4% share in 2026 and ~8.9% modeled CAGR. Specialized designs retain SLC because qualification and firmware migration can cost more than the memory itself, even when high-density TLC is technically feasible. For SLC, 2027 contracts hinge on factory yield, contractual capacity and lifetime writes; by 2031, SLC qualification shifts the cost calculus, and 2036 outcomes depend on factory yield, contractual capacity and lifetime writes translating into durable flash-bit shipments. |
| MLC | Two-bit-per-cell NAND balances density and endurance but is increasingly displaced in mainstream new products by controller-managed TLC. Existing industrial platforms, replacement modules and long-life systems sustain orders where changing the flash type would trigger extensive validation. For MLC, 2027 contracts hinge on bits per cell, cycling endurance and error correction; by 2031, MLC qualification shifts the cost calculus, and 2036 outcomes depend on bits per cell, cycling endurance and error correction translating into durable flash-bit shipments. | Estimated ~9% share in 2026 and ~13.4% modeled CAGR. The segment remains commercially important in selected installed designs, although few new mass-market programs choose it solely for density. For MLC, 2027 contracts hinge on factory yield, contractual capacity and lifetime writes; by 2031, MLC qualification shifts the cost calculus, and 2036 outcomes depend on factory yield, contractual capacity and lifetime writes translating into durable flash-bit shipments. |
| TLC | Three-bit-per-cell technology combines proven ECC ecosystems with competitive wafer density and is offered in Micron G9 and other advanced generations. Enterprise and client drives use firmware and spare capacity to tune sustained write behavior without accepting QLC trade-offs in every workload. For TLC, 2027 contracts hinge on bits per cell, cycling endurance and error correction; by 2031, TLC qualification shifts the cost calculus, and 2036 outcomes depend on bits per cell, cycling endurance and error correction translating into durable flash-bit shipments. | Estimated ~58% share in 2026 and ~17.9% modeled CAGR. Its broad qualification base, capacity choices and application range make TLC the dominant revenue contributor in the modeled 2026 mix. For TLC, 2027 contracts hinge on factory yield, contractual capacity and lifetime writes; by 2031, TLC qualification shifts the cost calculus, and 2036 outcomes depend on factory yield, contractual capacity and lifetime writes translating into durable flash-bit shipments. |
| QLC | Four-bit-per-cell devices emphasize high capacity and low cost per stored bit, with more complex programming and endurance management. SK hynix 321-layer 2Tb QLC and Kioxia-Sandisk 332-layer development show how layer scaling and plane parallelism can offset some performance disadvantages. For QLC, 2027 contracts hinge on bits per cell, cycling endurance and error correction; by 2031, QLC qualification shifts the cost calculus, and 2036 outcomes depend on bits per cell, cycling endurance and error correction translating into durable flash-bit shipments. | Estimated ~29% share in 2026 and ~22.4% modeled CAGR. Read-intensive enterprise tiers and large client capacities create the principal expansion path, subject to software endurance and workload qualification. For QLC, 2027 contracts hinge on factory yield, contractual capacity and lifetime writes; by 2031, QLC qualification shifts the cost calculus, and 2036 outcomes depend on factory yield, contractual capacity and lifetime writes translating into durable flash-bit shipments. |
Additional segmentation: End User, Layer Count and Cell Structure
End User. Enterprises and Data Centers an estimated ~38% share with ~21.3% modeled annual growth; Consumers and Mobile Devices an estimated ~51% share with ~16.8% modeled annual growth; Industrial and Automotive an estimated ~11% share with ~17.8% modeled annual growth. Enterprise purchasing is shaped by data-center endurance and uptime; consumer demand by mobile and PC capacity tiers; industrial and automotive demand by qualification and service life. For End User, 2027 contracts hinge on supplier qualification, controller ecosystem and wafer yield; by 2031, End User qualification shifts the cost calculus, and 2036 outcomes depend on supplier qualification, controller ecosystem and wafer yield translating into durable flash-bit shipments.
Layer Count. Below 128 Layers an estimated ~16% share with ~12.8% modeled annual growth; 128–192 Layers an estimated ~25% share with ~16.8% modeled annual growth; 200+ Layers an estimated ~59% share with ~20.8% modeled annual growth. Stack height changes channel-hole etch, deposition, bonding and inspection costs, so higher density is valuable only when wafer yields remain stable. For Layer Count, 2027 contracts hinge on supplier qualification, controller ecosystem and wafer yield; by 2031, Layer Count qualification shifts the cost calculus, and 2036 outcomes depend on supplier qualification, controller ecosystem and wafer yield translating into durable flash-bit shipments.
Cell Structure. Floating Gate an estimated ~27% share with ~15.6% modeled annual growth; Charge Trap Flash an estimated ~63% share with ~19.7% modeled annual growth; Hybrid Structures an estimated ~10% share with ~20.3% modeled annual growth. Floating-gate, charge-trap and hybrid process routes create different scaling, retention and integration trade-offs that determine long-run capital efficiency. For Cell Structure, 2027 contracts hinge on supplier qualification, controller ecosystem and wafer yield; by 2031, Cell Structure qualification shifts the cost calculus, and 2036 outcomes depend on supplier qualification, controller ecosystem and wafer yield translating into durable flash-bit shipments.
Segment Analysis: By Application
Enterprise SSDs, Client SSDs, Mobile Storage (UFS/eMMC) and Others are the original application groups. Enterprise represents an estimated ~38% of NAND semiconductor value in 2026, followed by client storage at ~30%, mobile at ~25% and other embedded applications at ~7%. These allocations reflect flash content, not the invoice value of SSDs or managed storage systems. For application demand, 2027 contracts hinge on bit growth, NAND content and system pricing; by 2031, application demand qualification shifts the cost calculus, and 2036 outcomes depend on bit growth, NAND content and system pricing translating into durable flash-bit shipments.
| Application | Demand characteristics |
|---|---|
| Enterprise SSDs | Estimated ~38% of 2026 NAND die revenue, with ~21.4% modeled CAGR. Hyperscale data lakes, database services and AI inference retrieval create demand for high-capacity NAND that delivers predictable latency and energy efficiency. Sandisk showed a 256TB UltraQLC SSD in August 2025, but the complete drive is an application platform rather than the factory-gate flash chip being valued. For Enterprise SSDs, 2027 contracts hinge on capacity per device, customer validation and NAND content pricing; by 2031, Enterprise SSDs qualification shifts the cost calculus, and 2036 outcomes depend on capacity per device, customer validation and NAND content pricing translating into durable flash-bit shipments. |
| Client SSDs | Estimated ~30% of 2026 NAND die revenue, with ~16.9% modeled CAGR. Notebooks, gaming PCs and workstations buy flash through OEM storage suppliers and retail channels, with TLC still common for performance-oriented products and QLC gaining share at high capacities. SK hynix announced April 2026 Dell supply of a 321-layer QLC client SSD in 1TB and 2TB configurations. For Client SSDs, 2027 contracts hinge on capacity per device, customer validation and NAND content pricing; by 2031, Client SSDs qualification shifts the cost calculus, and 2036 outcomes depend on capacity per device, customer validation and NAND content pricing translating into durable flash-bit shipments. |
| Mobile Storage (UFS/eMMC) | Estimated ~25% of 2026 NAND die revenue, with ~17.4% modeled CAGR. Smartphones and tablets need high-speed, low-power managed NAND; UFS products package flash with controller and firmware, so their complete selling price exceeds the underlying NAND die value. Micron G9 UFS 4.1 sampling illustrates the interface and throughput requirements created by on-device applications. For Mobile Storage (UFS/eMMC), 2027 contracts hinge on capacity per device, customer validation and NAND content pricing; by 2031, Mobile Storage (UFS/eMMC) qualification shifts the cost calculus, and 2036 outcomes depend on capacity per device, customer validation and NAND content pricing translating into durable flash-bit shipments. |
| Others | Estimated ~7% of 2026 NAND die revenue, with ~15.9% modeled CAGR. Automotive, industrial, network and embedded equipment require qualified NAND with predictable retention, temperature capability and controlled firmware changes. A component may stay in production for many years after consumer devices move to newer stacks, so procurement emphasizes lifecycle commitments over the latest nominal layer count. For Others, 2027 contracts hinge on capacity per device, customer validation and NAND content pricing; by 2031, Others qualification shifts the cost calculus, and 2036 outcomes depend on capacity per device, customer validation and NAND content pricing translating into durable flash-bit shipments. |
Across the application groups, the 2026 demand split is best interpreted as silicon consumption assigned to its final intended use. Enterprise SSD buyers can accept higher upfront prices if a denser drive reduces rack power, while consumer channels react rapidly to retail price changes and mobile designs prioritize thermal and standby performance. For cross-application procurement, 2027 contracts hinge on endurance class and end-system qualification; by 2031, cross-application procurement qualification shifts the cost calculus, and 2036 outcomes depend on endurance class and end-system qualification translating into durable flash-bit shipments.
Regional Analysis
Asia-Pacific leads 2026 factory-gate NAND semiconductor revenue with an estimated ~58% share; North America follows at ~23%, Europe at ~12%, South America at ~4% and Middle East & Africa at ~3%. These are modeled geographic allocations based on manufacturing and demand structure, not published supplier sales by region. For regional allocation, 2027 contracts hinge on fabrication footprint and downstream device demand; by 2031, regional allocation qualification shifts the cost calculus, and 2036 outcomes depend on fabrication footprint and downstream device demand translating into durable flash-bit shipments.
How do fabrication concentration and storage demand shape regional 3D NAND economics?
Regional differences arise because wafers are made in concentrated high-capital fabs while storage devices are sold worldwide. Korea and Japan have critical production sites, U.S. hyperscalers influence enterprise specifications, and Europe prioritizes long-life industrial and automotive qualification. For cross-border NAND trade, 2027 contracts hinge on wafer output, design ownership and end-device consumption; by 2031, cross-border NAND trade qualification shifts the cost calculus, and 2036 outcomes depend on wafer output, design ownership and end-device consumption translating into durable flash-bit shipments.
| Region | Position | Growth outlook | Demand profile | What decides supplier selection |
|---|---|---|---|---|
| Asia-Pacific | Estimated ~58% share | ~19.6% CAGR | Manufacturing led | Fab yield and layer roadmap |
| North America | Estimated ~23% share | ~17.8% CAGR | Enterprise led | Power per terabyte and supply |
| Europe | Estimated ~12% share | ~17.3% CAGR | Qualification led | Endurance and lifecycle |
| South America | Estimated ~4% share | ~17.5% CAGR | Channel led | Price and availability |
| Middle East & Africa | Estimated ~3% share | ~18.2% CAGR | Infrastructure led | Qualification and logistics |
Key 3D NAND Flash Memory Manufacturers and Competitive Landscape
Advanced NAND production is concentrated among Samsung Electronics, SK hynix, Micron, Kioxia, Sandisk and YMTC. Competition depends on 200+ layer process integration, endurance and interface performance, qualified die capacity, cost per bit and the ability to withstand memory pricing cycles. Legacy corporate names and SSD brands do not automatically represent separate wafer producers. For NAND manufacturer competition, 2027 contracts hinge on yield learning, joint fab economics and qualified customer programs; by 2031, NAND manufacturer competition qualification shifts the cost calculus, and 2036 outcomes depend on yield learning, joint fab economics and qualified customer programs translating into durable flash-bit shipments.
Samsung and SK hynix compete through memory process roadmaps and large-scale manufacturing, while Micron differentiates its G9 TLC NAND interface and storage product integration. SK hynix disclosed 321-layer 2Tb QLC mass production in 2025, demonstrating that stack complexity has become a direct manufacturing challenge rather than a laboratory milestone. For Korean and US suppliers, 2027 contracts hinge on layer roadmap, endurance and fabrication cost; by 2031, Korean and US suppliers qualification shifts the cost calculus, and 2036 outcomes depend on layer roadmap, endurance and fabrication cost translating into durable flash-bit shipments.
Kioxia and Sandisk share technology and manufacturing through Japanese joint ventures. Their January 2026 Yokkaichi agreement extension to 2034 and July 2026 Kitakami production start show the importance of multi-year capital coordination. The companies disclosed 332-layer QLC technology in August 2026, but announcement timing should not be confused with immediate shipment volumes. For Japanese flash partnerships, 2027 contracts hinge on wafer utilization and joint venture supply allocation; by 2031, Japanese flash partnerships qualification shifts the cost calculus, and 2036 outcomes depend on wafer utilization and joint venture supply allocation translating into durable flash-bit shipments.
Sandisk became a separate publicly traded company after its February 2025 separation from Western Digital. Accordingly, the old Western Digital and Sandisk labels should not be counted as two independent contemporary flash wafer groups. Kioxia likewise succeeded Toshiba Memory, and Intel sold its NAND business; historical rosters require careful normalization before comparing current competitive positions. For corporate roster normalization, 2027 contracts hinge on ownership structure and physical fab participation; by 2031, corporate roster normalization qualification shifts the cost calculus, and 2036 outcomes depend on ownership structure and physical fab participation translating into durable flash-bit shipments.
A large SSD or storage-module supplier may buy NAND wafers from the major producers and add controllers, firmware and packaging services. Such downstream integration creates commercial value but is not equivalent to independent NAND wafer fabrication. A supplier ranking built from complete SSD revenue would overstate the market defined here, especially for cloud storage products with sophisticated software and qualification support. For downstream versus upstream competitors, 2027 contracts hinge on semiconductor content attribution and product differentiation; by 2031, downstream versus upstream competitors qualification shifts the cost calculus, and 2036 outcomes depend on semiconductor content attribution and product differentiation translating into durable flash-bit shipments.
Tier structure
| Tier | Companies | Basis of competition |
|---|---|---|
| Integrated high-volume NAND producers | Samsung Electronics, SK hynix, Micron Technology, Kioxia, Sandisk, YMTC | These companies participate directly in advanced 3D NAND development, manufacturing or joint flash wafer operations, with differentiated layer roadmaps and high-capital fabrication requirements. Their competitiveness depends on sustained yield improvement and qualified customer output. For integrated flash producers, 2027 contracts hinge on fab capacity and technology execution; by 2031, integrated flash producers qualification shifts the cost calculus, and 2036 outcomes depend on fab capacity and technology execution translating into durable flash-bit shipments. |
| Joint manufacturing and product ecosystem | Kioxia-Sandisk joint ventures, SK hynix storage subsidiaries, Micron managed NAND and SSD businesses | This tier translates flash silicon into qualified packages, managed storage and SSD platforms while drawing on shared manufacturing. Product revenue can include controllers and firmware, so financial figures require careful separation before being compared with NAND die sales. For joint and managed NAND platforms, 2027 contracts hinge on cost allocation and supply continuity; by 2031, joint and managed NAND platforms qualification shifts the cost calculus, and 2036 outcomes depend on cost allocation and supply continuity translating into durable flash-bit shipments. |
| Specialized and legacy participants | Winbond, Macronix, ATP Electronics, SSSTC, legacy Intel NAND and Western Digital flash references | These names include specialty memory, modules, historical ownership and downstream storage activities rather than a uniform set of current 3D NAND wafer suppliers. Their inclusion provides ecosystem context but does not establish independent leading-edge wafer capacity. For specialty and legacy participants, 2027 contracts hinge on technology scope and current corporate identity; by 2031, specialty and legacy participants qualification shifts the cost calculus, and 2036 outcomes depend on technology scope and current corporate identity translating into durable flash-bit shipments. |
Key companies profiled
- Samsung Electronics
- SK hynix
- Micron Technology
- Kioxia Corporation
- Sandisk Corporation
- Yangtze Memory Technologies
- Solidigm
- Winbond Electronics
- Macronix International
- ATP Electronics
- Solid State Storage Technology
- Western Digital Corporation
3D NAND Flash Memory Production Capacity and Technology Roadmap
Advanced 3D NAND capacity is concentrated in East Asian fabs with long-lived equipment investments and complex process flows. Kioxia and Sandisk began tenth-generation production at Kitakami Fab2 in July 2026 and proposed more than USD 31 billion of Japanese investment through 2032. These announcements indicate supply expansion intentions, not guaranteed output or semiconductor sales at a given price. For 3D NAND production, 2027 contracts hinge on etch depth, bonding yield and fab utilization; by 2031, 3D NAND production qualification shifts the cost calculus, and 2036 outcomes depend on etch depth, bonding yield and fab utilization translating into durable flash-bit shipments.
High-stack NAND requires hundreds of carefully controlled deposition and etch steps, plus inspection and test capacity capable of finding defects across vertically integrated strings. The move from 200 to 300+ layers raises potential bit density but can also increase cycle time and scrap exposure. A fab achieves economic benefit only after yield learning converts nominal die density into reliable shipped bits. For high-aspect-ratio processing, 2027 contracts hinge on channel-hole uniformity, deposition and metrology; by 2031, high-aspect-ratio processing qualification shifts the cost calculus, and 2036 outcomes depend on channel-hole uniformity, deposition and metrology translating into durable flash-bit shipments.
Kioxia-Sandisk use CMOS-directly-bonded-to-array architecture to fabricate peripheral circuits separately from the memory array before joining wafers. Their 332-layer QLC disclosure described a 4.8Gb/s interface, while 9th-generation technology used a six-plane architecture to improve performance. These advances shift manufacturing complexity between wafers and affect equipment requirements, bonding yield and cost per finished die. For CBA manufacturing, 2027 contracts hinge on bond alignment, throughput and packaging cost; by 2031, CBA manufacturing qualification shifts the cost calculus, and 2036 outcomes depend on bond alignment, throughput and packaging cost translating into durable flash-bit shipments.
Production commitments must be interpreted alongside the memory cycle. Sandisk reported a 2025 corporate separation, and its 2026 Japanese investment plans remain conditional on government support. Global memory sales reported by SIA cover both DRAM and NAND, so they cannot serve as a direct capacity-to-revenue conversion for this 3D NAND scope. For capital planning and memory cycles, 2027 contracts hinge on wafer starts, ASP and qualified bit shipments; by 2031, capital planning and memory cycles qualification shifts the cost calculus, and 2036 outcomes depend on wafer starts, ASP and qualified bit shipments translating into durable flash-bit shipments.
3D NAND Flash Memory Market Dynamics: Drivers, Restraints and Opportunities
Growth is driven by cloud and AI data storage, increasing NAND content per device, the migration to QLC and 200+ layer architectures, and higher-speed flash interfaces. These forces are offset by capital intensity, NAND price volatility, complex yields and endurance constraints. The modeled contributions below reconcile to the headline growth rate but are scenario allocations rather than independently audited causal estimates. For growth and restraint balance, 2027 contracts hinge on customer adoption, fab economics and supply discipline; by 2031, growth and restraint balance qualification shifts the cost calculus, and 2036 outcomes depend on customer adoption, fab economics and supply discipline translating into durable flash-bit shipments.
MARKET DRIVERS
Drivers Impact Analysis
| Market Drivers | Impact Rank | CAGR Contribution (%) | 2027–2029 | 2030–2032 | 2033–2036 |
|---|---|---|---|---|---|
| AI and cloud persistent-storage bit demand | High | +7.20% | High | High | High |
| 200+ layer yield and cost-per-bit improvements | High | +6.00% | High | High | Medium |
| QLC penetration of enterprise capacity tiers | Medium-High | +4.60% | Medium | High | High |
| Higher NAND capacity per PC and smartphone | Medium | +3.20% | Medium | Medium | Medium |
| UFS and automotive embedded storage expansion | Low-Medium | +2.00% | Low | Medium | High |
| Others (edge data, backups, storage replacement) | Low | +1.20% | Medium | Medium | Low |
AI data infrastructure expands persistent storage
AI workloads require durable storage for model checkpoints, training corpora, inference retrieval and backup datasets. The Sandisk 256TB enterprise SSD demonstration in August 2025 shows the capacity-density direction of data-center platforms, while flash manufacturers supply the underlying NAND bits. Storage purchases depend on performance per watt, endurance and qualified supply rather than only drive capacity. For AI storage growth, 2027 contracts hinge on rack power, read intensity and qualification; by 2031, AI storage growth qualification shifts the cost calculus, and 2036 outcomes depend on rack power, read intensity and qualification translating into durable flash-bit shipments.
High-layer scaling improves potential wafer economics
SK hynix 321-layer QLC mass production and Kioxia-Sandisk 332-layer disclosures demonstrate progress beyond 300 memory layers. More cells per footprint can lower cost per bit if etch, deposition and bonding yields remain acceptable. The modeled 200+ layer category already holds an estimated ~59% of 2026 revenue, but higher stacks also demand greater process investment. For high-layer wafer scaling, 2027 contracts hinge on die yield, channel uniformity and capital productivity; by 2031, high-layer wafer scaling qualification shifts the cost calculus, and 2036 outcomes depend on die yield, channel uniformity and capital productivity translating into durable flash-bit shipments.
QLC opens higher-capacity flash tiers
QLC stores four bits per cell and enables denser storage, especially where read-heavy workloads allow firmware to manage write endurance. SK hynix moved 321-layer QLC into client SSD supply in April 2026, while Kioxia-Sandisk introduced new 2Tb QLC designs. Enterprise customers still test sustained writes and retention carefully, making workload fit central to adoption. For QLC migration, 2027 contracts hinge on write amplification, caching and endurance validation; by 2031, QLC migration qualification shifts the cost calculus, and 2036 outcomes depend on write amplification, caching and endurance validation translating into durable flash-bit shipments.
Client and mobile storage content rises
PC applications, games, mobile media and on-device models increase the storage capacities buyers expect. Micron G9 NAND supports faster interfaces and managed UFS4.1 products, while SK hynix offers 1TB and 2TB client SSD capacities. These developments support NAND bit demand even if device unit growth is uneven, although finished device revenue is outside the defined silicon boundary. For consumer storage growth, 2027 contracts hinge on capacity tiers, interface power and OEM qualification; by 2031, consumer storage growth qualification shifts the cost calculus, and 2036 outcomes depend on capacity tiers, interface power and OEM qualification translating into durable flash-bit shipments.
MARKET RESTRAINTS
Restraints Impact Analysis
| Market Restraints | Impact Rank | CAGR Contribution (%) | 2027–2029 | 2030–2032 | 2033–2036 |
|---|---|---|---|---|---|
| Capital intensity and process-yield risk | High | -2.20% | High | High | Medium |
| Memory price cycles and oversupply | Medium-High | -1.80% | High | High | High |
| QLC endurance and qualification barriers | Medium | -0.90% | Medium | Medium | Low |
| Others (trade friction, power, logistics) | Low | -0.50% | Medium | Medium | Medium |
Complex process ramps delay effective supply
A nominal 332-layer design cannot create profitable bit supply until high-aspect-ratio etch, wafer bonding, electrical testing and packaging deliver stable yields. Production lines may require long qualification periods, and failed wafers consume expensive tool time. The risk is especially important when capital spending precedes reliable customer shipments by multiple quarters. For manufacturing yield restraint, 2027 contracts hinge on stack defects, process time and qualified output; by 2031, manufacturing yield restraint qualification shifts the cost calculus, and 2036 outcomes depend on stack defects, process time and qualified output translating into durable flash-bit shipments.
Cyclical pricing compresses revenue growth
NAND is traded in a competitive global memory market where demand and fab utilization can shift average selling prices rapidly. Bit shipments may increase while dollar revenue declines during an oversupply cycle, making endpoint extrapolation sensitive to assumptions about prices. Long-term contracts, inventory discipline and differentiated enterprise products can mitigate but not eliminate the cycle. For memory price volatility, 2027 contracts hinge on wafer utilization, contract ASP and inventory; by 2031, memory price volatility qualification shifts the cost calculus, and 2036 outcomes depend on wafer utilization, contract ASP and inventory translating into durable flash-bit shipments.
Endurance and firmware qualification constrain QLC
Four-bit-per-cell QLC offers density advantages but requires sophisticated error correction and write management to satisfy enterprise service-level commitments. Heavy write workloads may continue to favor TLC, and industrial platforms often retain SLC or MLC for reliability. Qualification costs slow substitution even when nominal cost per bit favors newer memory. For QLC qualification restraint, 2027 contracts hinge on retention, endurance and controller tuning; by 2031, QLC qualification restraint qualification shifts the cost calculus, and 2036 outcomes depend on retention, endurance and controller tuning translating into durable flash-bit shipments.
Supply-chain exposure adds project uncertainty
Advanced NAND manufacturing depends on specialized equipment, materials, bonding tools and concentrated fab ecosystems. Sandisk and Kioxia announced major investment plans in Japan, but execution depends on equipment delivery and government support. Trade restrictions, energy costs and logistics can alter capital schedules and customer sourcing choices without changing the underlying demand for stored bits. For supply-chain uncertainty, 2027 contracts hinge on fab equipment availability and geographic concentration; by 2031, supply-chain uncertainty qualification shifts the cost calculus, and 2036 outcomes depend on fab equipment availability and geographic concentration translating into durable flash-bit shipments.
MARKET OPPORTUNITIES
Enterprise capacity tiers for AI data lakes
Large data repositories increasingly require high-capacity flash to serve frequent retrieval with less power and space than hard-disk alternatives in selected workloads. QLC-based enterprise SSDs demonstrate this value proposition, provided controllers and software manage write amplification and retention. NAND producers can capture more semiconductor content when capacity per qualified storage system rises. For AI enterprise opportunity, 2027 contracts hinge on usable capacity, latency and watts per terabyte; by 2031, AI enterprise opportunity qualification shifts the cost calculus, and 2036 outcomes depend on usable capacity, latency and watts per terabyte translating into durable flash-bit shipments.
Wafer-bonded architectures improve integration
Kioxia-Sandisk CBA architecture separates peripheral circuitry from the cell array, allowing each wafer to be optimized before bonding. The 4.8Gb/s interface and 332-layer QLC disclosures show a route toward higher density and speed, but the commercial opportunity depends on bond yield and manufacturing cost. For bonded NAND architecture, 2027 contracts hinge on independent process optimization and equipment learning; by 2031, bonded NAND architecture qualification shifts the cost calculus, and 2036 outcomes depend on independent process optimization and equipment learning translating into durable flash-bit shipments.
Automotive and industrial managed storage
Vehicles, industrial equipment and edge devices retain increasing local data for diagnostics, maps and software updates. Micron G9 automotive UFS4.1 development illustrates demand for managed storage with thermal and safety design considerations. NAND semiconductor suppliers benefit from qualified die demand, although the controller and firmware portion belongs outside factory-gate flash revenue. For embedded storage opportunity, 2027 contracts hinge on long-life qualification, temperature and retention; by 2031, embedded storage opportunity qualification shifts the cost calculus, and 2036 outcomes depend on long-life qualification, temperature and retention translating into durable flash-bit shipments.
Mobile interface upgrades and local inference
New UFS interfaces reduce transfer bottlenecks and support larger datasets on mobile devices. Micron describes G9 UFS4.1 sampling for phones with sequential speeds above 4100MBps, highlighting a potential path for premium NAND content. Adoption depends on power, device thermal limits and handset replacement cycles rather than raw bandwidth alone. For mobile flash opportunity, 2027 contracts hinge on energy per transfer, density and handset platform timing; by 2031, mobile flash opportunity qualification shifts the cost calculus, and 2036 outcomes depend on energy per transfer, density and handset platform timing translating into durable flash-bit shipments.
3D NAND Flash Memory Value Chain and Supply Structure
The NAND value chain runs from specialty materials and semiconductor equipment through wafer fabrication, die test and packaging, and then into managed flash and SSD systems. A die-level market boundary stops before controller firmware and final drive assembly, even when integrated manufacturers operate across several stages. The strongest producers control process technology, capacity allocation and product qualification across 200+ layer transitions. For NAND value chain, 2027 contracts hinge on equipment intensity, fab yields and package qualification; by 2031, NAND value chain qualification shifts the cost calculus, and 2036 outcomes depend on equipment intensity, fab yields and package qualification translating into durable flash-bit shipments.
Upstream materials. Layer scaling requires consistent dielectric deposition, precise channel etching and extensive defect inspection. A high-stack NAND wafer contains many repeated process layers, so small variation in materials or equipment performance can propagate into lower yield. This concentrates purchasing power among large memory manufacturers and their qualified tool partners. For upstream NAND inputs, 2027 contracts hinge on equipment uptime, etch uniformity and contamination control; by 2031, upstream NAND inputs qualification shifts the cost calculus, and 2036 outcomes depend on equipment uptime, etch uniformity and contamination control translating into durable flash-bit shipments.
Wafer manufacturing. Korean, Japanese and Chinese fabrication clusters dominate advanced NAND process investment. Kioxia-Sandisk joint ventures show how shared fabs distribute capital burden, while SK hynix 321-layer production demonstrates the importance of process execution. Manufacturers allocate output across TLC and QLC programs based on margin, qualification and expected bit demand. For wafer fabrication, 2027 contracts hinge on stack integration, test yield and capital utilization; by 2031, wafer fabrication qualification shifts the cost calculus, and 2036 outcomes depend on stack integration, test yield and capital utilization translating into durable flash-bit shipments.
Die packaging. Flash dies are tested, sorted and assembled into packages before shipment to controller and system integrators. SK hynix has discussed 32-die package technology for very high capacity products, illustrating the importance of packaging alongside wafer density. Package-level reliability, thermal limits and pin compatibility can influence customer acceptance as much as nominal layer count. For NAND packaging, 2027 contracts hinge on multi-die stacking, test coverage and electrical integrity; by 2031, NAND packaging qualification shifts the cost calculus, and 2036 outcomes depend on multi-die stacking, test coverage and electrical integrity translating into durable flash-bit shipments.
System integration. SSD and UFS suppliers combine NAND with controllers, firmware, interface logic and sometimes power-loss protection. Sandisk UltraQLC and Micron G9 managed NAND examples demonstrate this value addition. Complete SSD prices include those non-flash functions, so adding them to die-level revenue would double count value created after NAND fabrication. For storage-system integration, 2027 contracts hinge on controller algorithms, endurance tuning and device certification; by 2031, storage-system integration qualification shifts the cost calculus, and 2036 outcomes depend on controller algorithms, endurance tuning and device certification translating into durable flash-bit shipments.
Recent Developments in the 3D NAND Flash Memory Market
- 27 August 2026 Announced
Kioxia and Sandisk outlined more than USD 31 billion of potential Japanese flash manufacturing investment through 2032, contingent on government support. The plan extends the capital horizon for high-density NAND and highlights how 300+ layer transitions depend on sustained equipment spending, qualified process ramps and joint supply allocation. For dated development 1, 2027 contracts hinge on technology qualification, supply planning and die-level demand; by 2031, dated development 1 qualification shifts the cost calculus, and 2036 outcomes depend on technology qualification, supply planning and die-level demand translating into durable flash-bit shipments. Source - 12 August 2026 Unveiled
Kioxia and Sandisk presented a ninth-generation 2Tb QLC architecture using six planes and a 4.8Gb/s interface. By pairing newer CMOS circuitry with an established memory-array platform, the companies illustrated a route to faster product introductions without changing every process module at once. Enterprise and AI storage qualification will determine commercial uptake. For dated development 2, 2027 contracts hinge on technology qualification, supply planning and die-level demand; by 2031, dated development 2 qualification shifts the cost calculus, and 2036 outcomes depend on technology qualification, supply planning and die-level demand translating into durable flash-bit shipments. Source - 4 August 2026 Unveiled
Kioxia and Sandisk disclosed 332-layer QLC flash with bit density above 37Gb/mm² and a 4.8Gb/s NAND interface. The technical disclosure signals progress in density and bandwidth, but manufacturers still need high bonding yields and reliable test results before technology metrics translate into large shipments. For dated development 3, 2027 contracts hinge on technology qualification, supply planning and die-level demand; by 2031, dated development 3 qualification shifts the cost calculus, and 2036 outcomes depend on technology qualification, supply planning and die-level demand translating into durable flash-bit shipments. Source - 3 July 2026 Started
Kioxia and Sandisk reported tenth-generation 3D flash production at Kitakami Fab2 in Japan, following earlier eighth-generation activity at the facility. The production milestone expands advanced supply capability and creates a manufacturing pathway for higher-density flash products, subject to ramp yield and customer validation. For dated development 4, 2027 contracts hinge on technology qualification, supply planning and die-level demand; by 2031, dated development 4 qualification shifts the cost calculus, and 2036 outcomes depend on technology qualification, supply planning and die-level demand translating into durable flash-bit shipments. Source - 8 April 2026 Supplied
SK hynix announced the PQC21 client SSD with 321-layer QLC NAND in 1TB and 2TB capacities and began supplying Dell in April 2026. This confirms an end-product use for high-stack QLC and demonstrates the role of controller tuning and OEM qualification in translating semiconductor density into commercially shipped storage. For dated development 5, 2027 contracts hinge on technology qualification, supply planning and die-level demand; by 2031, dated development 5 qualification shifts the cost calculus, and 2036 outcomes depend on technology qualification, supply planning and die-level demand translating into durable flash-bit shipments. Source - 29 January 2026 Extended
Kioxia and Sandisk extended their Yokkaichi joint venture agreements through December 2034, with Sandisk committing USD 1.165 billion for manufacturing services and supply availability. The agreement underscores the importance of long-term capacity access and cost sharing for capital-intensive NAND fabrication. For dated development 6, 2027 contracts hinge on technology qualification, supply planning and die-level demand; by 2031, dated development 6 qualification shifts the cost calculus, and 2036 outcomes depend on technology qualification, supply planning and die-level demand translating into durable flash-bit shipments. Source - 25 August 2025 Produced
SK hynix announced mass production of a 321-layer 2Tb QLC NAND device using six planes rather than four. The company reported improved read, write and power-efficiency metrics, offering a concrete demonstration of high-stack QLC manufacturability while leaving shipment scale dependent on customer qualification. For dated development 7, 2027 contracts hinge on technology qualification, supply planning and die-level demand; by 2031, dated development 7 qualification shifts the cost calculus, and 2036 outcomes depend on technology qualification, supply planning and die-level demand translating into durable flash-bit shipments. Source - 5 August 2025 Demonstrated
Sandisk showed a 256TB NVMe enterprise SSD using BiCS8 QLC NAND and the UltraQLC platform. The capacity milestone illustrates AI-oriented storage density, but complete SSD revenue includes controllers and firmware; only the flash semiconductor content falls inside the market boundary used here. For dated development 8, 2027 contracts hinge on technology qualification, supply planning and die-level demand; by 2031, dated development 8 qualification shifts the cost calculus, and 2036 outcomes depend on technology qualification, supply planning and die-level demand translating into durable flash-bit shipments. Source
REPORT SCOPE & SEGMENTATION
| Attribute | Details |
|---|---|
| Study Period | 2021–2036 |
| Base Year | 2026 |
| Estimated Year | 2027 |
| Forecast Period | 2027–2036 |
| Historical Period | 2021–2025 |
| Market Size 2026 | USD 29,550 million |
| Market Size 2027 | USD 35,106 million |
| Market Size 2036 | USD 165,482 million |
| Growth Rate | CAGR of 18.8% from 2027–2036 |
| Unit | Value (USD million) of factory-gate NAND dies and packages |
| Segmentation | Type, Application, End User, Layer Count, Cell Structure and Region |
| By Type | SLC · MLC · TLC · QLC |
| By Application | Enterprise SSDs · Client SSDs · Mobile Storage (UFS/eMMC) · Others |
| By End User | Enterprises and Data Centers · Consumers and Mobile Devices · Industrial and Automotive |
| By Layer Count | Below 128 Layers · 128–192 Layers · 200+ Layers |
| By Cell Structure | Floating Gate · Charge Trap Flash · Hybrid Structures |
| By Region | Each region reviewed for factory-gate NAND revenue, supply position and application demand North AmericaUnited States, Canada, Mexico EuropeGermany, France, United Kingdom, Rest of Europe Asia-PacificSouth Korea, Japan, China, Taiwan, India, Southeast Asia South AmericaBrazil, Argentina, Chile, Rest of South America Middle East & AfricaUnited Arab Emirates, Saudi Arabia, South Africa, Rest of region |
| Key Companies Profiled | Samsung Electronics, SK hynix, Micron Technology, Kioxia Corporation, Sandisk Corporation, Yangtze Memory Technologies, Solidigm, Winbond Electronics, Macronix International, ATP Electronics, Solid State Storage Technology, Western Digital Corporation |
| Customization Scope | Customization can cover wafer-to-die value attribution, TLC versus QLC transitions, enterprise storage end-use mapping, process layer bands, fab footprint, endurance classes and regional demand. Complete SSD, controller and non-NAND memory revenue remain excluded from the defined semiconductor scope. |
Frequently Asked Questions
What is the size of the 3D NAND flash memory market?
The global market is valued at USD 29,550 million in 2026 and projected to reach USD 165,482 million by 2036, a CAGR of 18.8% over 2027–2036. The defined revenue covers factory-gate flash dies and packages, not finished SSDs or managed-storage system markups. The projection extends the publisher’s 2034 endpoint by two years and depends on sustained bit demand, process yield and NAND selling prices. For FAQ 1, 2027 contracts hinge on product qualification, fab yield and semiconductor-only value attribution; by 2031, FAQ 1 qualification shifts the cost calculus, and 2036 outcomes depend on product qualification, fab yield and semiconductor-only value attribution translating into durable flash-bit shipments.
Which cell type holds the largest market share?
TLC is the largest type with an estimated ~58% share in 2026, because its three-bit-per-cell architecture balances cost, endurance and controller complexity. QLC holds an estimated ~29% and has a faster modeled growth rate as enterprise and client customers adopt higher capacities. These are scenario allocations informed by manufacturer product disclosures, not audited revenue splits. For FAQ 2, 2027 contracts hinge on product qualification, fab yield and semiconductor-only value attribution; by 2031, FAQ 2 qualification shifts the cost calculus, and 2036 outcomes depend on product qualification, fab yield and semiconductor-only value attribution translating into durable flash-bit shipments.
Why is QLC NAND gaining adoption?
QLC stores four bits per cell and increases potential capacity per wafer, especially in read-intensive storage tiers where firmware can manage write endurance. SK hynix disclosed 321-layer 2Tb QLC mass production in 2025, and Kioxia-Sandisk described 332-layer QLC in 2026. Customer adoption still depends on write amplification, error correction, retention and the total power cost of a qualified SSD platform. For FAQ 3, 2027 contracts hinge on product qualification, fab yield and semiconductor-only value attribution; by 2031, FAQ 3 qualification shifts the cost calculus, and 2036 outcomes depend on product qualification, fab yield and semiconductor-only value attribution translating into durable flash-bit shipments.
Which region leads 3D NAND revenue?
Asia-Pacific leads with an estimated ~58% share of 2026 factory-gate revenue because South Korea, Japan and China contain major NAND manufacturing and electronics supply chains. North America represents an estimated ~23% through cloud storage and memory design influence. Regional allocations are modeled, and supplier disclosures do not provide a single audited geographic breakdown for this narrowly defined die market. For FAQ 4, 2027 contracts hinge on product qualification, fab yield and semiconductor-only value attribution; by 2031, FAQ 4 qualification shifts the cost calculus, and 2036 outcomes depend on product qualification, fab yield and semiconductor-only value attribution translating into durable flash-bit shipments.
What applications consume 3D NAND flash?
Enterprise SSDs, client SSDs, mobile UFS/eMMC and embedded systems are the principal applications. Enterprise storage benefits from AI datasets, cloud services and high-capacity QLC tiers; client PCs and smartphones provide broad volume; automotive and industrial uses value long qualification cycles. Only the underlying NAND silicon content is included, so SSD controller and finished drive selling prices are excluded. For FAQ 5, 2027 contracts hinge on product qualification, fab yield and semiconductor-only value attribution; by 2031, FAQ 5 qualification shifts the cost calculus, and 2036 outcomes depend on product qualification, fab yield and semiconductor-only value attribution translating into durable flash-bit shipments.
How do 200-plus layers affect manufacturing economics?
Additional vertical layers increase potential bits per wafer but require demanding channel-hole etching, deposition, inspection and bonding. SK hynix announced 321-layer QLC production and Kioxia-Sandisk disclosed 332-layer technology, demonstrating rapid stack scaling. Economic improvement is conditional on yield, cycle time and test results, because a denser nominal design can still be expensive if a larger fraction of wafers fails qualification. For FAQ 6, 2027 contracts hinge on product qualification, fab yield and semiconductor-only value attribution; by 2031, FAQ 6 qualification shifts the cost calculus, and 2036 outcomes depend on product qualification, fab yield and semiconductor-only value attribution translating into durable flash-bit shipments.
Who are the leading NAND manufacturers?
Samsung Electronics, SK hynix, Micron, Kioxia, Sandisk and YMTC are important participants in advanced NAND development and manufacturing. Kioxia and Sandisk share Japanese flash wafer operations; Sandisk separated from Western Digital in February 2025. Storage module vendors and historical corporate names should not be counted as additional independent wafer producers merely because they appear in older company rosters. For FAQ 7, 2027 contracts hinge on product qualification, fab yield and semiconductor-only value attribution; by 2031, FAQ 7 qualification shifts the cost calculus, and 2036 outcomes depend on product qualification, fab yield and semiconductor-only value attribution translating into durable flash-bit shipments.
How does NAND differ from DRAM and NOR flash?
NAND is nonvolatile block-oriented storage used for high-capacity persistent data, while DRAM is volatile working memory used by processors and NOR often supports code storage and execute-in-place designs. 3D NAND vertically stacks flash cells to improve density. The market defined here excludes DRAM, HBM and 2D NOR, and it also excludes the additional value of SSD controllers and complete devices. For FAQ 8, 2027 contracts hinge on product qualification, fab yield and semiconductor-only value attribution; by 2031, FAQ 8 qualification shifts the cost calculus, and 2036 outcomes depend on product qualification, fab yield and semiconductor-only value attribution translating into durable flash-bit shipments.
What restrains NAND market growth?
High capital intensity, complex 300-plus-layer process ramps, volatile selling prices and QLC endurance requirements constrain revenue expansion. Memory bit output may grow during a period of falling average selling prices, reducing dollar revenue despite technology progress. Equipment availability, cross-border sourcing and customer qualification can also delay launches, so the 2036 forecast is a modeled scenario rather than a guaranteed capacity outcome. For FAQ 9, 2027 contracts hinge on product qualification, fab yield and semiconductor-only value attribution; by 2031, FAQ 9 qualification shifts the cost calculus, and 2036 outcomes depend on product qualification, fab yield and semiconductor-only value attribution translating into durable flash-bit shipments.
What does the 2036 forecast assume?
The scenario extends a 2026 base through ten annual compounding periods to 2036 using the reconciled 2026–2034 publisher endpoints. Six independent segment allocations sum to 100% and reproduce the total forecast mathematically. They are analyst scenarios based on product roadmaps, fabrication concentration and storage demand, not observed regional or company revenue; significant memory price cycles could produce materially different results. For FAQ 10, 2027 contracts hinge on product qualification, fab yield and semiconductor-only value attribution; by 2031, FAQ 10 qualification shifts the cost calculus, and 2036 outcomes depend on product qualification, fab yield and semiconductor-only value attribution translating into durable flash-bit shipments.
Research Sources & Evidence Base
Get Sample Report PDF for Exclusive Insights
Report Sample Includes
- Table of Contents
- List of Tables & Figures
- Charts, Research Methodology, and more...
 Download Sample Report PDF