MARKET INSIGHTS
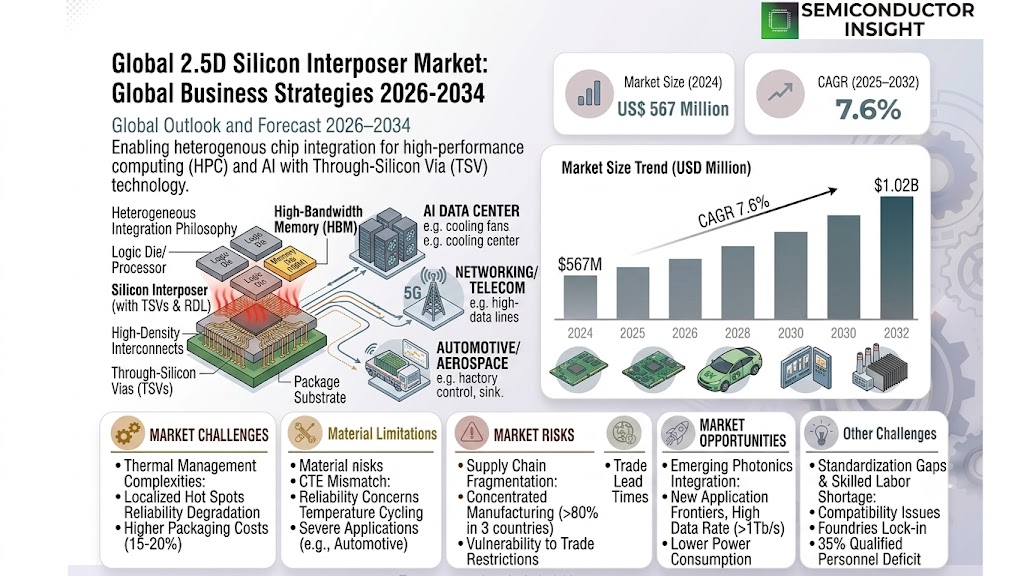
The global 2.5D Silicon Interposer Market size was valued at US$ 567 million in 2024 and is projected to reach US$ 1.02 billion by 2032, at a CAGR of 7.6% during the forecast period 2025-2032. The U.S. market accounted for 32% of global revenue in 2024, while China is expected to witness the highest growth rate due to expanding semiconductor manufacturing capabilities.
2.5D silicon interposers are advanced packaging substrates that enable high-density interconnection between integrated circuits. These components act as intermediate layers, facilitating electrical connections through through-silicon vias (TSVs) while providing thermal management and signal integrity. Key applications include high-performance computing, artificial intelligence processors, and advanced memory solutions where traditional packaging cannot meet performance requirements.
The market growth is primarily driven by increasing demand for heterogeneous integration in semiconductor packaging, particularly for applications requiring high bandwidth and low latency. While the 200 µm to 500 µm thickness segment dominates current adoption, emerging applications in 5G and IoT are creating new opportunities. Major players like UMC and Amkor continue to invest in TSV technology, with recent developments focusing on cost reduction through improved manufacturing yields and panel-level processing.
MARKET DYNAMICS
MARKET DRIVERS
Rising Demand for Advanced Packaging Technologies to Accelerate Market Growth
The global semiconductor industry’s shift toward high-performance computing and miniaturized electronics is driving unprecedented demand for 2.5D silicon interposers. These components enable higher interconnect density and improved thermal management compared to traditional packaging solutions. Data centers, artificial intelligence processors, and 5G infrastructure require advanced packaging technologies where 2.5D interposers reduce power consumption by approximately 30% while doubling bandwidth capacity. Major semiconductor foundries report that 2.5D packaging adoption grew by over 45% in 2023, with projections indicating continued double-digit growth through 2030.
Growing Adoption in High-Bandwidth Memory Applications to Fuel Expansion
Memory manufacturers are increasingly adopting 2.5D silicon interposers for high-bandwidth memory (HBM) stacks, which are critical for graphics processing units and AI accelerators. The third-generation HBM solutions now incorporate ultra-thin interposers between 55-100 microns thick, enabling memory bandwidth exceeding 460GB/s. With AI server shipments projected to grow at a CAGR of 29% through 2030, the demand for interposer-enabled memory solutions is creating significant opportunities. Recent product launches from leading manufacturers demonstrate 40% improvements in power efficiency compared to previous-generation designs.
Automotive Electronics Evolution to Create New Growth Avenues
The accelerating transition toward electric and autonomous vehicles is creating substantial demand for reliable interposer solutions. Advanced driver assistance systems (ADAS) require high-density interconnects that 2.5D silicon interposers provide, with automotive applications projected to account for 18% of the market by 2027. The ability to integrate heterogeneous components while maintaining signal integrity makes these solutions particularly valuable for next-generation vehicle architectures. Recent industry benchmarks indicate that 2.5D packaging can reduce system footprint by as much as 60% in automotive radar modules.
MARKET RESTRAINTS
High Manufacturing Costs and Yield Challenges to Limit Market Penetration
While offering significant performance advantages, 2.5D silicon interposers face substantial cost barriers that constrain adoption. The complex fabrication process involving through-silicon vias (TSVs) and micro-bump interconnects results in manufacturing costs approximately 60-80% higher than conventional packaging. Yield rates for ultra-thin interposers below 100µm currently average just 75-85%, creating supply chain challenges. The capital expenditure required for interposer production lines exceeds $500 million for a fully equipped facility, limiting participation to major players with substantial financial resources.
Other Constraints
Thermal Management Complexities
As component densities increase, thermal dissipation becomes a critical challenge. The close proximity of active dies in 2.5D configurations creates localized hot spots that degrade reliability. Current thermal solutions add 15-20% to total packaging costs, making some applications economically unfeasible.
Material Limitations
Silicon interposers face inherent limitations in thermal expansion mismatch with organic substrates. This creates reliability concerns in automotive and industrial applications where temperature cycling is severe.
MARKET CHALLENGES
Supply Chain Fragmentation and Geopolitical Factors to Create Uncertainties
The 2.5D silicon interposer ecosystem faces significant disruption risks due to concentrated manufacturing capacity in specific geographic regions. Over 80% of advanced packaging facilities are located in just three countries, creating vulnerability to trade restrictions. Recent export controls on semiconductor technologies have already caused lead times to extend by 30-45 days for some interposer products. The specialized equipment required for TSV formation remains dominated by a handful of suppliers, further complicating supply chain resilience.
Other Challenges
Standardization Gaps
The lack of unified design rules and testing protocols creates compatibility issues between foundries. This forces customers to lock into single-supplier relationships, reducing flexibility and increasing costs.
Skilled Labor Shortages
The multidisciplinary nature of interposer development requires expertise spanning materials science, electrical engineering, and manufacturing. Industry reports indicate a 35% deficit in qualified personnel, significantly delaying new product development cycles.
MARKET OPPORTUNITIES
Emerging Photonics Integration to Open New Application Frontiers
The convergence of silicon photonics with 2.5D interposer technology presents significant growth potential. Optical interconnects integrated into interposer architectures offer data transmission rates exceeding 1Tb/s with substantially lower power consumption. Major players are investing heavily in this space, with recent prototypes demonstrating 80% reductions in optical coupling losses. The global silicon photonics market is projected to exceed $4 billion by 2028, with datacom applications driving much of this growth.
Advanced Manufacturing Innovations to Reduce Costs and Expand Applications
Emerging fabrication techniques such as wafer-level packaging and hybrid bonding are creating opportunities to dramatically reduce production costs. New bonding technologies enable interconnect pitches below 10µm while eliminating solder bumps, potentially reducing manufacturing expenses by 40%. Several foundries have announced plans to qualify these processes for volume production within the next 18 months, which could make 2.5D solutions viable for mid-range applications.
2.5D SILICON INTERPOSER MARKET TRENDS
Increasing Demand for High-Performance Computing Drives Market Growth
The global 2.5D silicon interposer market is experiencing robust growth, fueled primarily by the escalating demand for high-performance computing (HPC) applications in data centers, AI accelerators, and advanced consumer electronics. As semiconductor packaging technologies evolve to meet the needs of smaller, faster, and more efficient chips, 2.5D interposers have emerged as a critical solution for enabling heterogeneous integration. With a CAGR projected to exceed 15% through 2032, the market is witnessing substantial investments from major semiconductor players, particularly in the 200µm to 500µm segment, which accounts for over 40% of current industry revenue. This trend is further amplified by the rising adoption of 2.5D packaging in advanced memory solutions like HBM (High Bandwidth Memory), where interconnects demand superior signal integrity.
Other Trends
Miniaturization and Power Efficiency Requirements
As semiconductor nodes continue shrinking below 7nm, traditional packaging approaches face limitations in thermal management and power distribution. 2.5D silicon interposers address these challenges by enabling shorter interconnect lengths and lower power consumption compared to conventional PCB-based solutions. Major foundries report that interposer-based designs can reduce power consumption by up to 30% while improving bandwidth density by 5-8x. This advantage is particularly crucial for applications in 5G infrastructure and autonomous vehicles, where both performance and energy efficiency are paramount. Recent design innovations, such as hybrid bonding techniques, are pushing these benefits further while lowering production costs.
Geographical Shifts in Production Capabilities
The market is witnessing significant geographical realignment, with China accelerating domestic production to reduce reliance on foreign interposer suppliers. While the U.S. currently leads in advanced packaging R&D, accounting for approximately 35% of global patent filings in 2.5D integration technologies, Asian foundries are rapidly scaling manufacturing capacities. Taiwan and South Korea collectively represent over 60% of current production volume, with key players like UMC and Amkor expanding cleanroom facilities specifically for interposer production. Meanwhile, European manufacturers are focusing on niche applications in aerospace and medical devices, leveraging the technology’s reliability advantages in harsh environments. This regional specialization is creating diverse growth opportunities across market segments.
Emerging Applications Beyond Traditional Semiconductors
While the imaging & optoelectronics segment currently dominates application share at nearly 28%, novel uses in photonics integration and quantum computing are opening new frontiers. Research institutions and startup ecosystems are pioneering silicon interposer applications in integrated photonic circuits, where the technology enables precise alignment of optical components with electronic dies. In MEMS/sensors, interposers are becoming indispensable for advanced LiDAR systems in autonomous vehicles, with prototype designs demonstrating 50% improvement in signal-to-noise ratios. Furthermore, the LED sector is adopting 2.5D architectures to achieve unprecedented lumen density in micro-LED displays, particularly for augmented reality devices expected to enter mass production by 2026.
2.5D Silicon Interposer Market Competitive Landscape
Key Industry Players
Strategic Investments and Innovation Drive Market Competition
The global 2.5D silicon interposer market is characterized by a mix of established semiconductor manufacturers and specialized firms focusing on advanced packaging solutions. As interconnect density and performance requirements escalate in applications like high-performance computing, AI, and 5G, key players are actively expanding their production capabilities and R&D efforts.
UMC (United Microelectronics Corporation) emerged as one of the dominant players in 2024, holding approximately 28% revenue share in the 2.5D interposer segment. The company’s strength stems from its advanced wafer-level packaging expertise and partnerships with major fabless semiconductor companies. Their persistent focus on thinner interposers (200-500µm range) positions them strongly in memory and GPU applications.
Meanwhile, Amkor Technology has strengthened its position through strategic acquisitions and technology partnerships. Their silicon interposer solutions are particularly prominent in the automotive and networking sectors, where reliability and thermal performance are critical. Recent expansions in their Japanese and Korean facilities have enhanced their production capacity by an estimated 35% since 2022.
The market also sees robust competition from specialist firms like Tezzaron Semiconductor and Plan Optik AG, who differentiate through proprietary through-silicon via (TSV) technologies and ultra-thin wafer handling capabilities. These smaller players collectively command about 18% of the market, often serving niche applications in MEMS and optoelectronics where customization is paramount.
List of Key 2.5D Silicon Interposer Manufacturers
- UMC (Taiwan)
- Amkor Technology (U.S.)
- ALLVIA, Inc. (U.S.)
- Tezzaron Semiconductor (U.S.)
- Plan Optik AG (Germany)
- Toshiba Electronics (Japan)
- TSMC (Taiwan)
- Xilinx (now part of AMD) (U.S.)
Recent market dynamics show companies are increasingly diversifying beyond traditional semiconductor applications. For instance, several players are developing interposer solutions for quantum computing and advanced MEMS packaging, signaling the technology’s expanding role across multiple high-tech sectors. With the market projected to grow at 14-17% CAGR through 2030, competition is expected to intensify, particularly in the Asia-Pacific region where over 60% of advanced packaging capacity is concentrated.
Segment Analysis:
By Type
200 µm to 500 µm Segment Leads the Market Due to High Demand in Advanced Packaging Applications
The market is segmented based on type into:
- 200 µm to 500 µm
- 500 µm to 1000 µm
- Others
By Application
Memory Segment Dominates Due to Rising Need for High-Bandwidth Solutions
The market is segmented based on application into:
- Imaging & Optoelectronics
- Memory
- MEMS/sensors
- LED
- Others
By End User
Semiconductor Foundries Lead with Expanding 3D IC Packaging Capabilities
The market is segmented based on end user into:
- Semiconductor foundries
- IDMs (Integrated Device Manufacturers)
- OSAT (Outsourced Semiconductor Assembly and Test) providers
- Research institutes
By Technology
Through-Silicon Via (TSV) Technology Segment Holds Major Share Due to Superior Electrical Performance
The market is segmented based on technology into:
- Through-Silicon Via (TSV)
- Redistribution Layer (RDL)
- Microbump
- Hybrid technology
Regional Analysis: 2.5D Silicon Interposer Market
North America
The North American market for 2.5D silicon interposers is driven by high-performance computing (HPC) applications, AI accelerators, and advanced semiconductor packaging technologies. The U.S. dominates regional demand due to strong investments in 5G infrastructure, data centers, and autonomous vehicle technologies, which require high-bandwidth memory (HBM) integration through interposers. Companies like Amkor and Tezzaron are actively expanding production capacity to meet demand. While adoption in the automotive sector is still emerging, applications in medical imaging and defense electronics provide additional growth avenues. Challenges include high manufacturing costs and the technical complexity of through-silicon via (TSV) processes, which slow large-scale deployment.
Europe
Europe’s 2.5D silicon interposer market benefits from strong R&D investments in IoT, automotive radars, and MEMS sensors. Germany and France lead due to their robust semiconductor manufacturing ecosystems, with companies like Plan Optik AG specializing in silicon wafer solutions. The region prioritizes energy-efficient interposer designs for aerospace and industrial applications, aligning with EU sustainability goals. However, fragmented supply chains and reliance on Asian foundries for advanced packaging limit production scalability. Recent collaborations between research institutes and manufacturers aim to reduce dependency on external suppliers, though progress remains gradual due to capital intensity.
Asia-Pacific
As the largest and fastest-growing market, Asia-Pacific is fueled by China’s semiconductor self-sufficiency initiatives and Japan’s leadership in MEMS/sensors. Taiwan’s UMC and China’s emerging foundries dominate production, catering to memory and optoelectronics applications. The region’s cost-competitive ecosystem encourages adoption, but intellectual property (IP) concerns and yield variability in TSV manufacturing pose challenges. India and Southeast Asia show increasing demand for interposers in consumer electronics, though local fabrication capabilities lag behind global leaders. Eventual shifts toward 3D IC integration could redefine market dynamics, pushing suppliers to innovate.
South America
This region represents a nascent market, primarily serving niche applications in medical imaging and LED packaging. Brazil leads with localized assembly operations, but reliance on imported interposers constrains cost efficiency. Economic instability and limited government support for semiconductor infrastructure deter large-scale investments. However, partnerships with North American and European firms for automotive sensor modules could unlock growth, provided stable policies are implemented. The lack of domestic wafer fabrication remains a critical bottleneck.
Middle East & Africa
Adoption is minimal but growing, concentrated in UAE and Israel’s defense and telecom sectors. High costs and scarce technical expertise restrict market expansion, though sovereign wealth funds are cautiously investing in semiconductor projects. Partnerships with Asian manufacturers could accelerate development, particularly for oil/gas sensor applications. Long-term potential hinges on economic diversification strategies, but progress will likely trail other regions due to infrastructure gaps and low localized demand.
Report Scope
This market research report provides a comprehensive analysis of the global and regional 2.5D Silicon Interposer markets, covering the forecast period 2025–2032. It offers detailed insights into market dynamics, technological advancements, competitive landscape, and key trends shaping the industry.
Key focus areas of the report include:
- Market Size & Forecast: Historical data and future projections for revenue, unit shipments, and market value across major regions and segments.
- Segmentation Analysis: Detailed breakdown by product type, technology, application, and end-user industry to identify high-growth segments and investment opportunities.
- Regional Outlook: Insights into market performance across North America, Europe, Asia-Pacific, Latin America, and the Middle East & Africa, including country-level analysis where relevant.
- Competitive Landscape: Profiles of leading market participants, including their product offerings, R&D focus, manufacturing capacity, pricing strategies, and recent developments such as mergers, acquisitions, and partnerships.
- Technology Trends & Innovation: Assessment of emerging technologies, integration of AI/IoT, semiconductor design trends, fabrication techniques, and evolving industry standards.
- Market Drivers & Restraints: Evaluation of factors driving market growth along with challenges, supply chain constraints, regulatory issues, and market-entry barriers.
- Stakeholder Analysis: Insights for component suppliers, OEMs, system integrators, investors, and policymakers regarding the evolving ecosystem and strategic opportunities.
Primary and secondary research methods are employed, including interviews with industry experts, data from verified sources, and real-time market intelligence to ensure the accuracy and reliability of the insights presented.
FREQUENTLY ASKED QUESTIONS:
What is the current market size of Global 2.5D Silicon Interposer Market?
-> 2.5D Silicon Interposer Market size was valued at US$ 567 million in 2024 and is projected to reach US$ 1.02 billion by 2032, at a CAGR of 7.6% during the forecast period 2025-2032s.
Which key companies operate in Global 2.5D Silicon Interposer Market?
-> Key players include UMC, Amkor, ALLVIA, Inc, Tezzaron, and Plan Optik AG, among others. These companies collectively held approximately 68% of the global market share in 2024.
What are the key growth drivers?
-> Key growth drivers include increasing demand for advanced packaging solutions in semiconductor devices, rising adoption of 2.5D technology in high-performance computing applications, and the growing need for miniaturization in electronics.
Which region dominates the market?
-> Asia-Pacific dominates the global market, accounting for over 58% of revenue in 2024, driven by strong semiconductor manufacturing capabilities in countries like China, Taiwan, and South Korea.
What are the emerging trends?
-> Emerging trends include development of ultra-thin interposers, integration of through-silicon vias (TSVs) for improved performance, and increasing adoption in artificial intelligence and 5G applications.

Get Sample Report PDF for Exclusive Insights
Report Sample Includes
- Table of Contents
- List of Tables & Figures
- Charts, Research Methodology, and more...