Bus Line Transceiver Market, Trends, Business Strategies 2026-2036

Bus Line Transceiver market is expected to climb to USD 8,680 million by 2034, indicating an implied CAGR of approximately 8.3% over the forecast horizon.

PDF Icon Download Sample Report PDF
  • Quick Dispatch

    All Orders

  • Secure Payment

    100% Secure Payment

Price range: $1,500.00 through $4,250.00

Clear

Bus Line Transceiver Market Insights

Bus Line Transceiver market was valued at USD 4,209 million in 2025 and is expected to climb to USD 8,680 million by 2034, indicating an implied CAGR of approximately 8.3% over the forecast horizon.

A Bus Line Transceiver is a physical‑layer interface chip positioned between a microcontroller or SoC and an external bus such as CAN, LIN, RS‑485 or backplane lines. It integrates driver and receiver functions, performs level conversion, bidirectional data transfer, and incorporates protection features like over‑voltage, short‑circuit and ESD safeguards.

The market expansion is fueled by the surge in automotive electronic content,especially in new‑energy vehicles,and the rising demand for robust communication links in industrial automation and energy‑storage systems. Stricter EMC and functional‑safety standards are prompting OEMs to replace low‑end devices with higher‑performance transceivers, while regional manufacturers are gaining ground on generic RS‑485/LIN solutions.
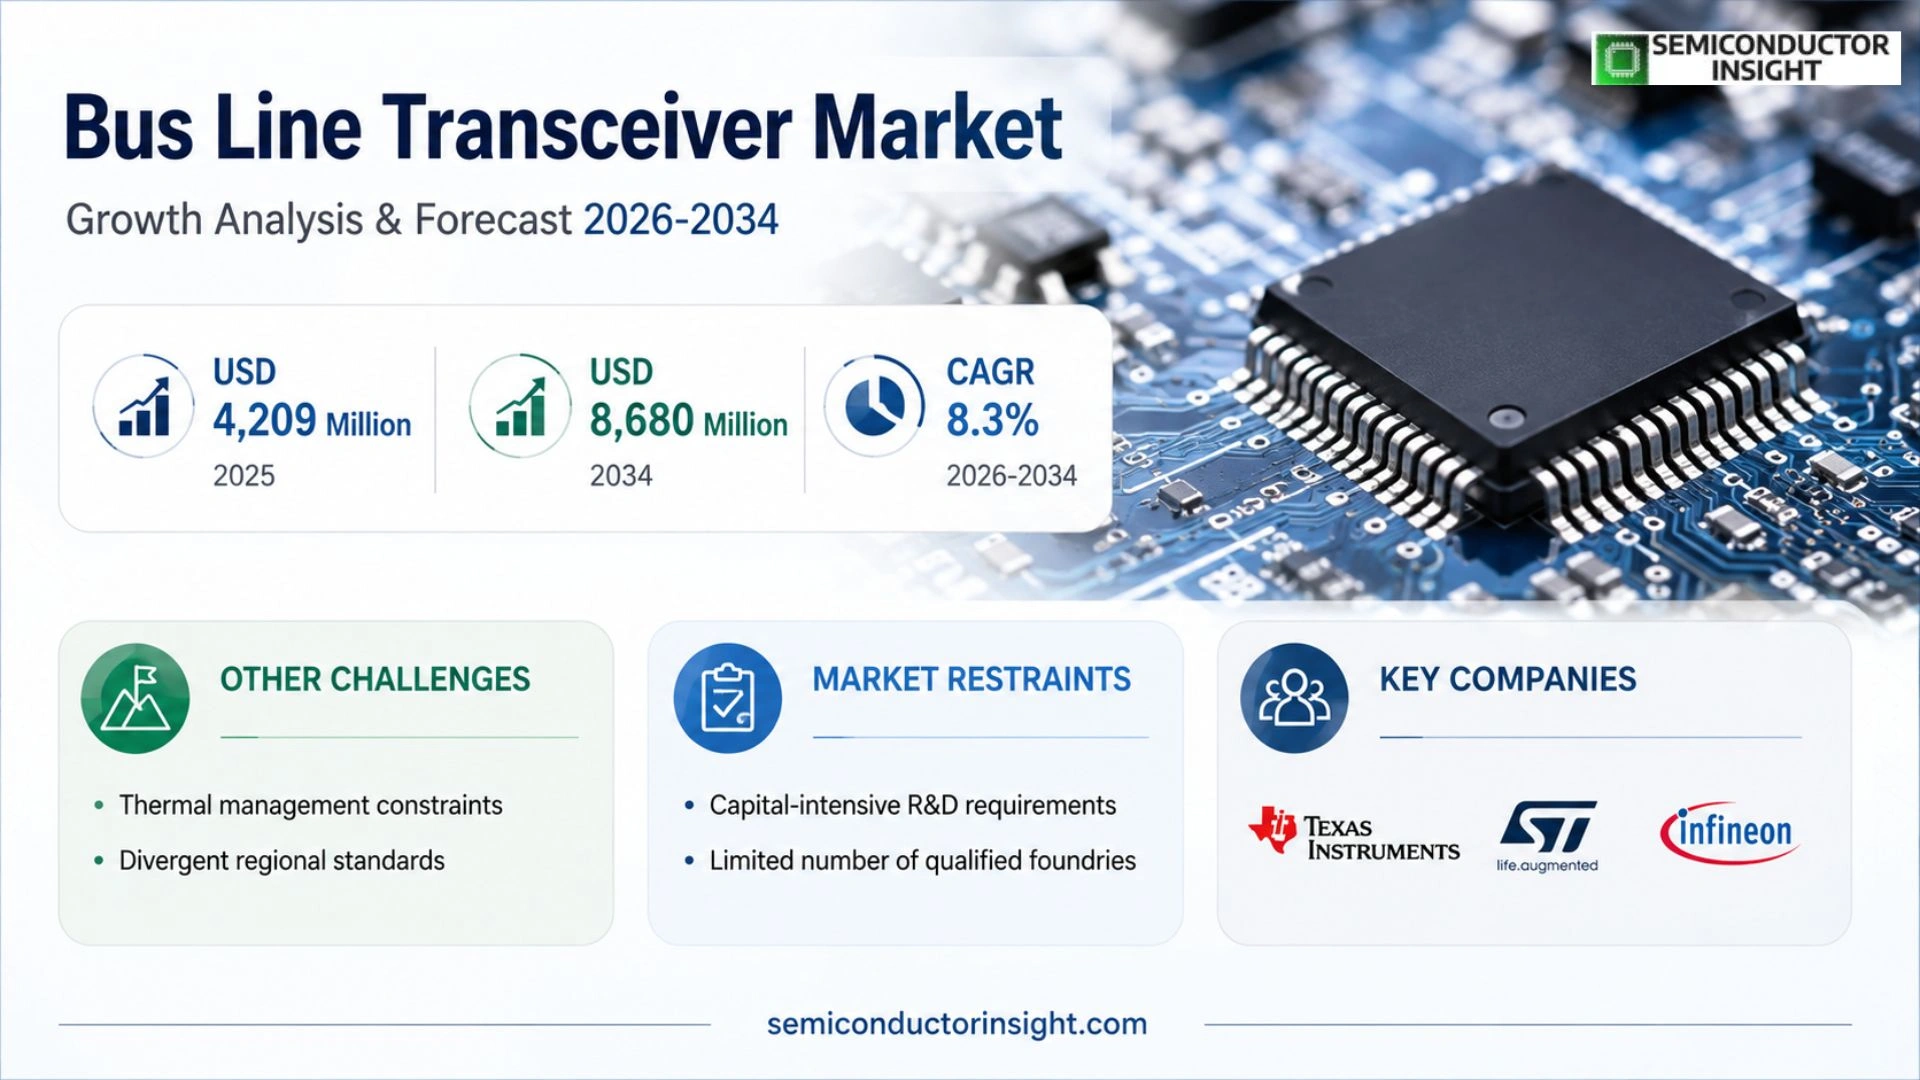
MARKET DRIVERS

Automotive Electrification and Safety Requirements

The shift toward electric powertrains has forced vehicle manufacturers to re‑engineer communication backbones. Bus Line Transceiver components now carry higher voltage levels while maintaining signal integrity, a combination that is essential for meeting stringent crash‑safety standards and for supporting fast charging protocols.

Industrial Automation and High‑Speed Data Exchange

Factories adopting Industry 4.0 architectures rely on deterministic networks to synchronize robotic cells. Modern transceivers, with embedded error‑correction and low‑latency interfaces, enable the precise timing required for motion control loops, thereby justifying higher capital outlays.

➤ “Reliability gains of up to 30 % are being reported in test benches where next‑generation transceivers replace legacy modules.”

These technical imperatives are prompting OEMs to partner with specialist silicon firms, creating a feedback loop that fuels further innovation across Bus Line Transceiver market.

MARKET CHALLENGES

Design Complexity and Qualification Overheads

Engineering a transceiver that simultaneously satisfies automotive EMC limits, temperature extremes, and high‑speed data rates demands multi‑disciplinary expertise. The qualification process, often spanning 12‑18 months, compresses product launch windows and inflates development budgets.

Other Challenges

Thermal Management Constraints

As power densities climb, dissipating heat without compromising board space becomes a critical hurdle, prompting designers to adopt advanced packaging technologies.

Furthermore, divergent regional standards force manufacturers to maintain multiple design variants, eroding economies of scale.

MARKET RESTRAINTS

Capital‑Intensive R&D Requirements

The need for continuous silicon refresh cycles drives up research expenditures, particularly for firms lacking deep pockets. Smaller players often resort to licensing agreements, which can dilute profit margins.

Additionally, the limited number of qualified foundries capable of delivering automotive‑grade processes creates a bottleneck that hampers supply‑side agility.

MARKET OPPORTUNITIES

Autonomous Systems and Edge Connectivity

Self‑driving platforms demand fault‑tolerant, high‑bandwidth links between sensors, compute units, and actuation modules. Transceiver architectures that integrate time‑sensitive networking (TSN) are positioned to capture a growing slice of this nascent market.

Parallel to automotive trends, the aerospace sector is retrofitting legacy aircraft with digital bus infrastructures to support predictive maintenance. The stringent reliability criteria in aviation open a premium niche for ruggedized transceiver families.

Finally, the proliferation of IoT gateways in smart‑city deployments presents a peripheral but measurable avenue, where low‑cost, scalable transceivers can embed themselves in municipal sensor grids.

Bus Line Transceiver Market Trends

Automotive Architecture Evolution Boosts Unit Demand

The transition toward domain‑centric electronic architectures in passenger vehicles has expanded the number of communication nodes per platform. A conventional gasoline model now carries roughly 20 CAN/LIN transceivers, while a mid‑range electric vehicle may require up to 50. This escalation stems from higher voltage power‑train control, advanced driver‑assistance modules, and over‑the‑air update capabilities, all of which rely on reliable physical‑layer interfaces. As each node incorporates a dedicated transceiver, total unit shipments climbed to 5.9 billion in 2025, sustaining a pricing band of US $0.75‑0.85. The resulting margin profile,hovering between 28 % and 40 %,reflects the premium placed on integrated protection features that meet tightening EMC and safety specifications.

Other Trends

Supply‑Chain Pressures on Component Margins

Periodic shortages of advanced wafer capacity and packaging lines introduce volatility into cost structures. Fluctuations in copper and precious‑metal prices further compress gross margins, especially for manufacturers relying on high‑volume, low‑margin product families. Companies that have diversified their foundry base or adopted in‑house testing see a steadier cost curve, enabling them to retain pricing power while still delivering the high‑integrity devices demanded by automotive OEMs and industrial system integrators.

Industrial Automation and Energy‑Infrastructure Demand

Parallel to automotive trends, the rollout of smart factories and grid‑edge storage solutions fuels demand for robust RS‑485 and CAN FD transceivers. A typical PLC station now integrates three to six field‑bus interfaces, and photovoltaic inverters often embed four to ten units to manage monitoring, protection, and communication with energy‑management platforms. The push for higher data‑rate capabilities,up to 50 Mbit/s in emerging bus‑hybrid schemes,encourages OEMs to favor highly integrated, low‑power parts that reduce board real‑estate and simplify system design. This shift reshapes the competitive landscape: global IDMs retain leadership in high‑reliability segments, while regional players gain traction in cost‑sensitive, mid‑range offerings, creating a tiered market that balances performance with price elasticity.

COMPETITIVE LANDSCAPE

Key Industry Players

Competitive Overview of Bus Line Transceiver market

The market is led by a handful of international integrated device manufacturers whose breadth of process technology and global production capacity give them a decisive edge in high‑reliability automotive and industrial transceivers. Texas Instruments, STMicroelectronics, Infineon Technologies and Renesas Electronics each command double‑digit shares in the CAN/F‑D, LIN and RS‑485 segments, leveraging mature 65 nm and below wafers to deliver parts that meet stringent functional‑safety and EMC standards. Their product portfolios are tightly integrated with major ECU and PLC suppliers, which reinforces recurring revenue streams and creates high barriers for new entrants.

Beyond the tier‑one giants, a second layer of specialists supplies niche or cost‑sensitive solutions. Companies such as ON Semiconductor, NXP Semiconductors and Nexperia focus on mid‑range CAN and LIN devices that balance performance with competitive pricing. Smaller firms,including Vector Informatik, Exar, SG Micro, Analog Devices, Diodes Incorporated, Teledyne Technologies, and Adafruit Industries,target particular applications such as diagnostic tools, isolated RS‑485 front‑ends, or development kits for rapid prototyping. Their agility allows quick adaptation to emerging standards in electric‑vehicle networking and industrial IoT, which keeps them relevant despite limited scale.

List of Key Bus Line Transceiver Companies Profiled

Segment Analysis:

Segment Category Sub-Segments Key Insights
By Type
  • CAN/LIN Transceivers
  • RS‑485/RS‑422 Transceivers
  • Multi‑Protocol (CAN‑FD, LIN‑FD, etc.) Transceivers
CAN/LIN Transceivers dominate the market due to their entrenched role in automotive networking and legacy industrial platforms.

  • Offer proven reliability under harsh temperature and vibration conditions.
  • Provide straightforward integration with existing ECU architectures, reducing design cycle time.
  • Benefit from mature design ecosystems and extensive qualification libraries.
By Application
  • Automotive Electronics
  • Industrial Control
  • Energy Storage & Photovoltaic Inverters
  • Smart Home & IoT Devices
Automotive Electronics remains the leading application segment, driven by increasing ECU count and the shift toward domain‑oriented architectures.

  • Higher bus density in electric and autonomous vehicles fuels demand for compact, low‑power transceivers.
  • Stringent functional‑safety and EMC standards push designers toward high‑integrity CAN/LIN solutions.
  • Emergence of hybrid Ethernet‑bus architectures still relies on robust legacy transceivers for cost‑effective connectivity.
By End User
  • Vehicle ECUs
  • PLC & DCS Controllers
  • Inverter & BMS Modules
Vehicle ECUs are the primary end‑user, reflecting the exponential growth of electronic functions inside modern cars.

  • Increasing number of safety‑critical nodes (ADAS, powertrain, body‑control) requires dependable bus protection.
  • Low‑power standby and wake‑up features are essential for energy‑efficient electric vehicles.
  • Designers favor integrated driver/receiver architectures to minimise board space and simplify routing.
By Voltage Level
  • 3.3 V Devices
  • 5 V Devices
  • Higher‑Voltage (6 V +) Devices
5 V Devices have become the preferred voltage class for mixed‑signal automotive and industrial platforms.

  • Offer a balance between power consumption and noise immunity across long bus runs.
  • Compatible with both older 5 V MCU families and newer 3.3 V cores via level‑shifting features.
  • Facilitate broader component standardisation, simplifying supply‑chain management.
By Protection Feature
  • ESD Protection
  • Over‑/Under‑Voltage Guarding
  • Fault‑Tolerant / Fail‑Safe Operation
ESD Protection is a decisive differentiator as devices encounter increasingly harsh electromagnetic environments.

  • Integrated ±8 kV to ±16 kV ESD clamping safeguards both bus and controller sides.
  • Reduces field failures in automotive crash scenarios and industrial surge events.
  • Enables designers to meet stringent IEC and ISO safety standards without additional external components.

Regional Analysis: Bus Line Transceiver Market

North America

North America continues to shape Bus Line Transceiver market through a combination of mature automotive ecosystems and aggressive electrification mandates. Original equipment manufacturers (OEMs) in the United States and Canada have embraced next‑generation transceivers to meet stringent functional safety requirements while supporting higher data rates for advanced driver‑assistance systems. At the same time, the region’s robust semiconductor supply chain offers rapid prototyping capabilities, allowing startups to iterate designs faster than peers elsewhere. Investor confidence is reinforced by a steady pipeline of government‑backed research programs targeting low‑latency communication protocols for autonomous fleets. These dynamics create a feedback loop: as manufacturers demand more reliable bus architectures, suppliers invest in process improvements, which in turn enable OEMs to differentiate vehicles with richer infotainment and sensor integration. The net effect is a resilient market where product innovation and regulatory alignment reinforce each other, positioning North America as the benchmark for global performance standards in Bus Line Transceiver market.

Automotive OEM Adoption
Leading car makers are standardizing high‑speed transceivers across power‑train modules, creating a uniform platform that reduces integration risk. This shift is motivated by the need to support over‑the‑air updates and sensor fusion, which demand consistent bandwidth across the vehicle network. OEMs also value the reduced wiring complexity that modern transceivers provide, translating into lighter assemblies and lower fuel consumption.
Industrial Automation Integration
Beyond automotive, manufacturers of factory automation equipment are embedding bus line transceivers to synchronize robotic cells. The move is driven by tighter cycle times and the desire for deterministic communication. Suppliers that can guarantee low jitter gain preferred‑supplier status, influencing procurement decisions across multiple industrial sectors.
Regulatory Landscape
Federal safety directives now reference specific fault‑tolerance levels for in‑vehicle networks, pushing manufacturers toward transceivers with built‑in redundancy. Compliance testing labs are aligning their criteria with these standards, meaning that early adopters secure certification pathways ahead of competitors.
Supply Chain Resilience
The region’s diversified silicon fab base offers a buffer against global shortages. Companies that maintain dual‑sourcing strategies can sustain production schedules even when a single plant faces disruption, preserving market share and customer confidence.

Europe
European manufacturers are capitalizing on the Union’s stringent emissions agenda, which forces tighter integration of communication modules within electric drivetrains. Companies in Germany and France are collaborating with local chipset firms to embed transceivers that support both CAN‑FD and automotive Ethernet, allowing a smoother transition between legacy and future networks. The regulatory emphasis on functional safety, paired with a highly skilled engineering workforce, creates an environment where product refinement cycles are short and customer feedback loops are tight. As a result, European players are shaping global specifications for bus line transceivers, influencing standards bodies and driving cross‑border component harmonization.

Asia‑Pacific
In Asia‑Pacific, rapid growth of low‑cost vehicle production drives demand for affordable yet reliable transceiver solutions. Chinese and Indian OEMs prioritize volume manufacturing, prompting suppliers to streamline designs for economies of scale without sacrificing essential safety features. Simultaneously, the region’s burgeoning electric‑vehicle market is nudging manufacturers toward higher‑bandwidth interfaces that can handle extensive battery‑management communications. The confluence of cost pressures and technology upgrades forces a delicate balance, encouraging innovation in integration techniques that keep component footprints minimal while preserving performance.

South America
South American markets are experiencing a modest upgrade of fleet management systems, where bus line transceivers enable real‑time telemetry for public transportation networks. Governments are investing in smart city initiatives that require reliable data exchange between vehicles and central control hubs. Although the overall market size remains smaller than in the north, the emphasis on connectivity for passenger safety and operational efficiency creates a niche that attracts specialized suppliers seeking to establish early footholds.

Middle East & Africa
The Middle East & Africa region is witnessing a gradual shift from diesel‑centric fleets to hybrid and electric platforms, especially in affluent Gulf states. This transition fuels interest in transceiver technologies that can withstand high-temperature environments while delivering consistent data integrity. Meanwhile, emerging economies in Africa are piloting telematics solutions for logistics, using bus line transceivers to enhance route optimization and cargo monitoring. These divergent drivers,climate resilience in the Gulf and cost‑effective connectivity in Africa,prompt vendors to tailor product families to distinct operating conditions, thereby expanding the overall footprint of Bus Line Transceiver market.

Report Scope

This market research report provides a comprehensive analysis of the Bus Line Transceiver Market , covering the forecast period 2026–2034. It offers detailed insights into market dynamics, technological advancements, competitive landscape, and key trends shaping the industry.

Key focus areas of the report include:

  • Market Overview: The report begins with an overview outlining its current market scenario, key growth indicators, and industry transformation drivers. It discusses macroeconomic factors, demand–supply balance, regulatory landscape, and the strategic role of semiconductors in powering advancements across industries such as automotive, telecommunications, consumer electronics, and industrial automation.
  • Market Size & Forecast: Historical data and future projections for revenue, unit shipments, and market value across major regions and segments.
  • Segmentation Analysis: Detailed breakdown by product type, technology, application, and end-user industry to identify high-growth segments and investment opportunities.
  • Regional Insights: Insights into market performance across North America, Europe, Asia-Pacific, Latin America, and the Middle East & Africa, including country-level analysis where relevant.
  • Competitive Landscape: Profiles of leading market participants, including their product offerings, R&D focus, manufacturing capacity, pricing strategies, and recent developments such as mergers, acquisitions, and partnerships.
  • Technology Trends & Innovation: Assessment of emerging technologies, integration of AI/IoT, semiconductor design trends, fabrication techniques, and evolving industry standards.
  • Market Drivers & Restraints: Evaluation of factors driving market growth along with challenges, supply chain constraints, regulatory issues, and market-entry barriers.
  • Stakeholder Insights: Insights for component suppliers, OEMs, system integrators, investors, and policymakers regarding the evolving ecosystem and strategic opportunities.

Primary and secondary research methods are employed, including interviews with industry experts, data from verified sources, and real-time market intelligence to ensure the accuracy and reliability of the insights presented.

FREQUENTLY ASKED QUESTIONS:

What is the current market size of Bus Line Transceiver Market?

-> Bus Line Transceiver market is expected to climb to USD 8,680 million by 2034, indicating an implied CAGR of approximately 8.3% over the forecast horizon.

Which key companies operate in Bus Line Transceiver Market?

-> Key players include Texas Instruments, Onsemi, STMicroelectronics, Microchip Technology, Renesas Electronics, Infineon, NXP Semiconductors, Toshiba, Vector Informatik, and Analog Devices.

What are the key growth drivers?

-> Key growth drivers include rising penetration of automotive electronics and new‑energy vehicles, expanding industrial automation and digitalized energy infrastructure, and increasing demand for high‑performance, high‑reliability transceivers meeting stricter EMC and functional‑safety standards.

Which region dominates the market?

-> Asia-Pacific holds the largest market share, driven by strong automotive and industrial demand, while Europe shows significant growth potential.

What are the emerging trends?

-> Emerging trends include integration of bus transceivers with Ethernet and IoT functionalities, development of isolated and high‑EMC versions, and a shift toward highly integrated, low‑power designs for electric and autonomous vehicle applications.

Bus Line Transceiver Market, Trends, Business Strategies 2026-2036

Get Sample Report PDF for Exclusive Insights

Report Sample Includes

  • Table of Contents
  • List of Tables & Figures
  • Charts, Research Methodology, and more...

PDF Icon Download Sample Report PDF
SKU: b762610f4e6b
Category:
License Type

Corporate License, Excel License, PDF and Excel Databook License

Download Sample Report

Table of Content

1 Introduction to Research & Analysis Reports
1.1 Bus Line Transceiver Market Definition
1.2 Market Segments
1.2.1 Segment by Voltage
1.2.2 Segment by Current Sinking Capability
1.2.3 Segment by Packaging Method
1.2.4 Segment by Application
1.3 Global Bus Line Transceiver Market Overview
1.4 Features & Benefits of This Report
1.5 Methodology & Sources of Information
1.5.1 Research Methodology
1.5.2 Research Process
1.5.3 Base Year
1.5.4 Report Assumptions & Caveats
2 Global Bus Line Transceiver Overall Market Size
2.1 Global Bus Line Transceiver Market Size: 2025 VS 2032
2.2 Global Bus Line Transceiver Market Size, Prospects & Forecasts: 2021-2032
2.3 Global Bus Line Transceiver Sales: 2021-2032
3 Company Landscape
3.1 Top Bus Line Transceiver Players in Global Market
3.2 Top Global Bus Line Transceiver Companies Ranked by Revenue
3.3 Global Bus Line Transceiver Revenue by Companies
3.4 Global Bus Line Transceiver Sales by Companies
3.5 Global Bus Line Transceiver Price by Manufacturer (2021-2026)
3.6 Top 3 and Top 5 Bus Line Transceiver Companies in Global Market, by Revenue in 2025
3.7 Global Manufacturers Bus Line Transceiver Product Type
3.8 Tier 1, Tier 2, and Tier 3 Bus Line Transceiver Players in Global Market
3.8.1 List of Global Tier 1 Bus Line Transceiver Companies
3.8.2 List of Global Tier 2 and Tier 3 Bus Line Transceiver Companies
4 Sights by Voltage
4.1 Overview
4.1.1 Segment by Voltage – Global Bus Line Transceiver Market Size Markets, 2025 & 2032
4.1.2 3.6V
4.1.3 5.5V
4.1.4 6V
4.2 Segment by Voltage – Global Bus Line Transceiver Revenue & Forecasts
4.2.1 Segment by Voltage – Global Bus Line Transceiver Revenue, 2021-2026
4.2.2 Segment by Voltage – Global Bus Line Transceiver Revenue, 2027-2032
4.2.3 Segment by Voltage – Global Bus Line Transceiver Revenue Market Share, 2021-2032
4.3 Segment by Voltage – Global Bus Line Transceiver Sales & Forecasts
4.3.1 Segment by Voltage – Global Bus Line Transceiver Sales, 2021-2026
4.3.2 Segment by Voltage – Global Bus Line Transceiver Sales, 2027-2032
4.3.3 Segment by Voltage – Global Bus Line Transceiver Sales Market Share, 2021-2032
4.4 Segment by Voltage – Global Bus Line Transceiver Price (Manufacturers Selling Prices), 2021-2032
5 Sights by Current Sinking Capability
5.1 Overview
5.1.1 Segment by Current Sinking Capability – Global Bus Line Transceiver Market Size Markets, 2025 & 2032
5.1.2 8 mA
5.1.3 24 mA
5.1.4 Others
5.2 Segment by Current Sinking Capability – Global Bus Line Transceiver Revenue & Forecasts
5.2.1 Segment by Current Sinking Capability – Global Bus Line Transceiver Revenue, 2021-2026
5.2.2 Segment by Current Sinking Capability – Global Bus Line Transceiver Revenue, 2027-2032
5.2.3 Segment by Current Sinking Capability – Global Bus Line Transceiver Revenue Market Share, 2021-2032
5.3 Segment by Current Sinking Capability – Global Bus Line Transceiver Sales & Forecasts
5.3.1 Segment by Current Sinking Capability – Global Bus Line Transceiver Sales, 2021-2026
5.3.2 Segment by Current Sinking Capability – Global Bus Line Transceiver Sales, 2027-2032
5.3.3 Segment by Current Sinking Capability – Global Bus Line Transceiver Sales Market Share, 2021-2032
5.4 Segment by Current Sinking Capability – Global Bus Line Transceiver Price (Manufacturers Selling Prices), 2021-2032
6 Sights by Packaging Method
6.1 Overview
6.1.1 Segment by Packaging Method – Global Bus Line Transceiver Market Size Markets, 2025 & 2032
6.1.2 DW Package
6.1.3 N Package
6.2 Segment by Packaging Method – Global Bus Line Transceiver Revenue & Forecasts
6.2.1 Segment by Packaging Method – Global Bus Line Transceiver Revenue, 2021-2026
6.2.2 Segment by Packaging Method – Global Bus Line Transceiver Revenue, 2027-2032
6.2.3 Segment by Packaging Method – Global Bus Line Transceiver Revenue Market Share, 2021-2032
6.3 Segment by Packaging Method – Global Bus Line Transceiver Sales & Forecasts
6.3.1 Segment by Packaging Method – Global Bus Line Transceiver Sales, 2021-2026
6.3.2 Segment by Packaging Method – Global Bus Line Transceiver Sales, 2027-2032
6.3.3 Segment by Packaging Method – Global Bus Line Transceiver Sales Market Share, 2021-2032
6.4 Segment by Packaging Method – Global Bus Line Transceiver Price (Manufacturers Selling Prices), 2021-2032
7 Sights by Application
7.1 Overview
7.1.1 Segment by Application – Global Bus Line Transceiver Market Size, 2025 & 2032
7.1.2 Industrial Control
7.1.3 Automotive Electronics
7.1.4 Smart Home
7.1.5 Others
7.2 Segment by Application – Global Bus Line Transceiver Revenue & Forecasts
7.2.1 Segment by Application – Global Bus Line Transceiver Revenue, 2021-2026
7.2.2 Segment by Application – Global Bus Line Transceiver Revenue, 2027-2032
7.2.3 Segment by Application – Global Bus Line Transceiver Revenue Market Share, 2021-2032
7.3 Segment by Application – Global Bus Line Transceiver Sales & Forecasts
7.3.1 Segment by Application – Global Bus Line Transceiver Sales, 2021-2026
7.3.2 Segment by Application – Global Bus Line Transceiver Sales, 2027-2032
7.3.3 Segment by Application – Global Bus Line Transceiver Sales Market Share, 2021-2032
7.4 Segment by Application – Global Bus Line Transceiver Price (Manufacturers Selling Prices), 2021-2032
8 Sights Region
8.1 By Region – Global Bus Line Transceiver Market Size, 2025 & 2032
8.2 By Region – Global Bus Line Transceiver Revenue & Forecasts
8.2.1 By Region – Global Bus Line Transceiver Revenue, 2021-2026
8.2.2 By Region – Global Bus Line Transceiver Revenue, 2027-2032
8.2.3 By Region – Global Bus Line Transceiver Revenue Market Share, 2021-2032
8.3 By Region – Global Bus Line Transceiver Sales & Forecasts
8.3.1 By Region – Global Bus Line Transceiver Sales, 2021-2026
8.3.2 By Region – Global Bus Line Transceiver Sales, 2027-2032
8.3.3 By Region – Global Bus Line Transceiver Sales Market Share, 2021-2032
8.4 North America
8.4.1 By Country – North America Bus Line Transceiver Revenue, 2021-2032
8.4.2 By Country – North America Bus Line Transceiver Sales, 2021-2032
8.4.3 United States Bus Line Transceiver Market Size, 2021-2032
8.4.4 Canada Bus Line Transceiver Market Size, 2021-2032
8.4.5 Mexico Bus Line Transceiver Market Size, 2021-2032
8.5 Europe
8.5.1 By Country – Europe Bus Line Transceiver Revenue, 2021-2032
8.5.2 By Country – Europe Bus Line Transceiver Sales, 2021-2032
8.5.3 Germany Bus Line Transceiver Market Size, 2021-2032
8.5.4 France Bus Line Transceiver Market Size, 2021-2032
8.5.5 U.K. Bus Line Transceiver Market Size, 2021-2032
8.5.6 Italy Bus Line Transceiver Market Size, 2021-2032
8.5.7 Russia Bus Line Transceiver Market Size, 2021-2032
8.5.8 Nordic Countries Bus Line Transceiver Market Size, 2021-2032
8.5.9 Benelux Bus Line Transceiver Market Size, 2021-2032
8.6 Asia
8.6.1 By Region – Asia Bus Line Transceiver Revenue, 2021-2032
8.6.2 By Region – Asia Bus Line Transceiver Sales, 2021-2032
8.6.3 China Bus Line Transceiver Market Size, 2021-2032
8.6.4 Japan Bus Line Transceiver Market Size, 2021-2032
8.6.5 South Korea Bus Line Transceiver Market Size, 2021-2032
8.6.6 Southeast Asia Bus Line Transceiver Market Size, 2021-2032
8.6.7 India Bus Line Transceiver Market Size, 2021-2032
8.7 South America
8.7.1 By Country – South America Bus Line Transceiver Revenue, 2021-2032
8.7.2 By Country – South America Bus Line Transceiver Sales, 2021-2032
8.7.3 Brazil Bus Line Transceiver Market Size, 2021-2032
8.7.4 Argentina Bus Line Transceiver Market Size, 2021-2032
8.8 Middle East & Africa
8.8.1 By Country – Middle East & Africa Bus Line Transceiver Revenue, 2021-2032
8.8.2 By Country – Middle East & Africa Bus Line Transceiver Sales, 2021-2032
8.8.3 Turkey Bus Line Transceiver Market Size, 2021-2032
8.8.4 Israel Bus Line Transceiver Market Size, 2021-2032
8.8.5 Saudi Arabia Bus Line Transceiver Market Size, 2021-2032
8.8.6 UAE Bus Line Transceiver Market Size, 2021-2032
9 Manufacturers & Brands Profiles
9.1 Onsemi
9.1.1 Onsemi Company Summary
9.1.2 Onsemi Business Overview
9.1.3 Onsemi Bus Line Transceiver Major Product Offerings
9.1.4 Onsemi Bus Line Transceiver Sales and Revenue in Global (2021-2026)
9.1.5 Onsemi Key News & Latest Developments
9.2 TI
9.2.1 TI Company Summary
9.2.2 TI Business Overview
9.2.3 TI Bus Line Transceiver Major Product Offerings
9.2.4 TI Bus Line Transceiver Sales and Revenue in Global (2021-2026)
9.2.5 TI Key News & Latest Developments
9.3 Vector Informatik
9.3.1 Vector Informatik Company Summary
9.3.2 Vector Informatik Business Overview
9.3.3 Vector Informatik Bus Line Transceiver Major Product Offerings
9.3.4 Vector Informatik Bus Line Transceiver Sales and Revenue in Global (2021-2026)
9.3.5 Vector Informatik Key News & Latest Developments
9.4 Toshiba
9.4.1 Toshiba Company Summary
9.4.2 Toshiba Business Overview
9.4.3 Toshiba Bus Line Transceiver Major Product Offerings
9.4.4 Toshiba Bus Line Transceiver Sales and Revenue in Global (2021-2026)
9.4.5 Toshiba Key News & Latest Developments
9.5 Infineon
9.5.1 Infineon Company Summary
9.5.2 Infineon Business Overview
9.5.3 Infineon Bus Line Transceiver Major Product Offerings
9.5.4 Infineon Bus Line Transceiver Sales and Revenue in Global (2021-2026)
9.5.5 Infineon Key News & Latest Developments
9.6 Microchip Technology
9.6.1 Microchip Technology Company Summary
9.6.2 Microchip Technology Business Overview
9.6.3 Microchip Technology Bus Line Transceiver Major Product Offerings
9.6.4 Microchip Technology Bus Line Transceiver Sales and Revenue in Global (2021-2026)
9.6.5 Microchip Technology Key News & Latest Developments
9.7 Exar
9.7.1 Exar Company Summary
9.7.2 Exar Business Overview
9.7.3 Exar Bus Line Transceiver Major Product Offerings
9.7.4 Exar Bus Line Transceiver Sales and Revenue in Global (2021-2026)
9.7.5 Exar Key News & Latest Developments
9.8 STMicroelectronics
9.8.1 STMicroelectronics Company Summary
9.8.2 STMicroelectronics Business Overview
9.8.3 STMicroelectronics Bus Line Transceiver Major Product Offerings
9.8.4 STMicroelectronics Bus Line Transceiver Sales and Revenue in Global (2021-2026)
9.8.5 STMicroelectronics Key News & Latest Developments
9.9 SG MICRO
9.9.1 SG MICRO Company Summary
9.9.2 SG MICRO Business Overview
9.9.3 SG MICRO Bus Line Transceiver Major Product Offerings
9.9.4 SG MICRO Bus Line Transceiver Sales and Revenue in Global (2021-2026)
9.9.5 SG MICRO Key News & Latest Developments
9.10 Nexperia
9.10.1 Nexperia Company Summary
9.10.2 Nexperia Business Overview
9.10.3 Nexperia Bus Line Transceiver Major Product Offerings
9.10.4 Nexperia Bus Line Transceiver Sales and Revenue in Global (2021-2026)
9.10.5 Nexperia Key News & Latest Developments
9.11 Adafruit
9.11.1 Adafruit Company Summary
9.11.2 Adafruit Business Overview
9.11.3 Adafruit Bus Line Transceiver Major Product Offerings
9.11.4 Adafruit Bus Line Transceiver Sales and Revenue in Global (2021-2026)
9.11.5 Adafruit Key News & Latest Developments
9.12 Analog Devices
9.12.1 Analog Devices Company Summary
9.12.2 Analog Devices Business Overview
9.12.3 Analog Devices Bus Line Transceiver Major Product Offerings
9.12.4 Analog Devices Bus Line Transceiver Sales and Revenue in Global (2021-2026)
9.12.5 Analog Devices Key News & Latest Developments
9.13 NTE Electronics
9.13.1 NTE Electronics Company Summary
9.13.2 NTE Electronics Business Overview
9.13.3 NTE Electronics Bus Line Transceiver Major Product Offerings
9.13.4 NTE Electronics Bus Line Transceiver Sales and Revenue in Global (2021-2026)
9.13.5 NTE Electronics Key News & Latest Developments
9.14 Diodes Incorporated
9.14.1 Diodes Incorporated Company Summary
9.14.2 Diodes Incorporated Business Overview
9.14.3 Diodes Incorporated Bus Line Transceiver Major Product Offerings
9.14.4 Diodes Incorporated Bus Line Transceiver Sales and Revenue in Global (2021-2026)
9.14.5 Diodes Incorporated Key News & Latest Developments
9.15 Renesas Electronics
9.15.1 Renesas Electronics Company Summary
9.15.2 Renesas Electronics Business Overview
9.15.3 Renesas Electronics Bus Line Transceiver Major Product Offerings
9.15.4 Renesas Electronics Bus Line Transceiver Sales and Revenue in Global (2021-2026)
9.15.5 Renesas Electronics Key News & Latest Developments
9.16 Teledyne
9.16.1 Teledyne Company Summary
9.16.2 Teledyne Business Overview
9.16.3 Teledyne Bus Line Transceiver Major Product Offerings
9.16.4 Teledyne Bus Line Transceiver Sales and Revenue in Global (2021-2026)
9.16.5 Teledyne Key News & Latest Developments
10 Global Bus Line Transceiver Production Capacity, Analysis
10.1 Global Bus Line Transceiver Production Capacity, 2021-2032
10.2 Bus Line Transceiver Production Capacity of Key Manufacturers in Global Market
10.3 Global Bus Line Transceiver Production by Region
11 Key Market Trends, Opportunity, Drivers and Restraints
11.1 Market Opportunities & Trends
11.2 Market Drivers
11.3 Market Restraints
12 Bus Line Transceiver Supply Chain Analysis
12.1 Bus Line Transceiver Industry Value Chain
12.2 Bus Line Transceiver Upstream Market
12.3 Bus Line Transceiver Downstream and Clients
12.4 Marketing Channels Analysis
12.4.1 Marketing Channels
12.4.2 Bus Line Transceiver Distributors and Sales Agents in Global
13 Conclusion
14 Appendix
14.1 Note
14.2 Examples of Clients
14.3 DisclaimerList of Tables
Table 1. Key Players of Bus Line Transceiver in Global Market
Table 2. Top Bus Line Transceiver Players in Global Market, Ranking by Revenue (2025)
Table 3. Global Bus Line Transceiver Revenue by Companies, (US$, Mn), 2021-2026
Table 4. Global Bus Line Transceiver Revenue Share by Companies, 2021-2026
Table 5. Global Bus Line Transceiver Sales by Companies, (Million Units), 2021-2026
Table 6. Global Bus Line Transceiver Sales Share by Companies, 2021-2026
Table 7. Key Manufacturers Bus Line Transceiver Price (2021-2026) & (US$/Unit)
Table 8. Global Manufacturers Bus Line Transceiver Product Type
Table 9. List of Global Tier 1 Bus Line Transceiver Companies, Revenue (US$, Mn) in 2025 and Market Share
Table 10. List of Global Tier 2 and Tier 3 Bus Line Transceiver Companies, Revenue (US$, Mn) in 2025 and Market Share
Table 11. Segment by Voltage – Global Bus Line Transceiver Revenue, (US$, Mn), 2025 & 2032
Table 12. Segment by Voltage – Global Bus Line Transceiver Revenue (US$, Mn), 2021-2026
Table 13. Segment by Voltage – Global Bus Line Transceiver Revenue (US$, Mn), 2027-2032
Table 14. Segment by Voltage – Global Bus Line Transceiver Sales (Million Units), 2021-2026
Table 15. Segment by Voltage – Global Bus Line Transceiver Sales (Million Units), 2027-2032
Table 16. Segment by Current Sinking Capability – Global Bus Line Transceiver Revenue, (US$, Mn), 2025 & 2032
Table 17. Segment by Current Sinking Capability – Global Bus Line Transceiver Revenue (US$, Mn), 2021-2026
Table 18. Segment by Current Sinking Capability – Global Bus Line Transceiver Revenue (US$, Mn), 2027-2032
Table 19. Segment by Current Sinking Capability – Global Bus Line Transceiver Sales (Million Units), 2021-2026
Table 20. Segment by Current Sinking Capability – Global Bus Line Transceiver Sales (Million Units), 2027-2032
Table 21. Segment by Packaging Method – Global Bus Line Transceiver Revenue, (US$, Mn), 2025 & 2032
Table 22. Segment by Packaging Method – Global Bus Line Transceiver Revenue (US$, Mn), 2021-2026
Table 23. Segment by Packaging Method – Global Bus Line Transceiver Revenue (US$, Mn), 2027-2032
Table 24. Segment by Packaging Method – Global Bus Line Transceiver Sales (Million Units), 2021-2026
Table 25. Segment by Packaging Method – Global Bus Line Transceiver Sales (Million Units), 2027-2032
Table 26. Segment by Application – Global Bus Line Transceiver Revenue, (US$, Mn), 2025 & 2032
Table 27. Segment by Application – Global Bus Line Transceiver Revenue, (US$, Mn), 2021-2026
Table 28. Segment by Application – Global Bus Line Transceiver Revenue, (US$, Mn), 2027-2032
Table 29. Segment by Application – Global Bus Line Transceiver Sales, (Million Units), 2021-2026
Table 30. Segment by Application – Global Bus Line Transceiver Sales, (Million Units), 2027-2032
Table 31. By Region – Global Bus Line Transceiver Revenue, (US$, Mn), 2025 & 2032
Table 32. By Region – Global Bus Line Transceiver Revenue, (US$, Mn), 2021-2026
Table 33. By Region – Global Bus Line Transceiver Revenue, (US$, Mn), 2027-2032
Table 34. By Region – Global Bus Line Transceiver Sales, (Million Units), 2021-2026
Table 35. By Region – Global Bus Line Transceiver Sales, (Million Units), 2027-2032
Table 36. By Country – North America Bus Line Transceiver Revenue, (US$, Mn), 2021-2026
Table 37. By Country – North America Bus Line Transceiver Revenue, (US$, Mn), 2027-2032
Table 38. By Country – North America Bus Line Transceiver Sales, (Million Units), 2021-2026
Table 39. By Country – North America Bus Line Transceiver Sales, (Million Units), 2027-2032
Table 40. By Country – Europe Bus Line Transceiver Revenue, (US$, Mn), 2021-2026
Table 41. By Country – Europe Bus Line Transceiver Revenue, (US$, Mn), 2027-2032
Table 42. By Country – Europe Bus Line Transceiver Sales, (Million Units), 2021-2026
Table 43. By Country – Europe Bus Line Transceiver Sales, (Million Units), 2027-2032
Table 44. By Region – Asia Bus Line Transceiver Revenue, (US$, Mn), 2021-2026
Table 45. By Region – Asia Bus Line Transceiver Revenue, (US$, Mn), 2027-2032
Table 46. By Region – Asia Bus Line Transceiver Sales, (Million Units), 2021-2026
Table 47. By Region – Asia Bus Line Transceiver Sales, (Million Units), 2027-2032
Table 48. By Country – South America Bus Line Transceiver Revenue, (US$, Mn), 2021-2026
Table 49. By Country – South America Bus Line Transceiver Revenue, (US$, Mn), 2027-2032
Table 50. By Country – South America Bus Line Transceiver Sales, (Million Units), 2021-2026
Table 51. By Country – South America Bus Line Transceiver Sales, (Million Units), 2027-2032
Table 52. By Country – Middle East & Africa Bus Line Transceiver Revenue, (US$, Mn), 2021-2026
Table 53. By Country – Middle East & Africa Bus Line Transceiver Revenue, (US$, Mn), 2027-2032
Table 54. By Country – Middle East & Africa Bus Line Transceiver Sales, (Million Units), 2021-2026
Table 55. By Country – Middle East & Africa Bus Line Transceiver Sales, (Million Units), 2027-2032
Table 56. Onsemi Company Summary
Table 57. Onsemi Bus Line Transceiver Product Offerings
Table 58. Onsemi Bus Line Transceiver Sales (Million Units), Revenue (US$, Mn) and Average Price (US$/Unit) & (2021-2026)
Table 59. Onsemi Key News & Latest Developments
Table 60. TI Company Summary
Table 61. TI Bus Line Transceiver Product Offerings
Table 62. TI Bus Line Transceiver Sales (Million Units), Revenue (US$, Mn) and Average Price (US$/Unit) & (2021-2026)
Table 63. TI Key News & Latest Developments
Table 64. Vector Informatik Company Summary
Table 65. Vector Informatik Bus Line Transceiver Product Offerings
Table 66. Vector Informatik Bus Line Transceiver Sales (Million Units), Revenue (US$, Mn) and Average Price (US$/Unit) & (2021-2026)
Table 67. Vector Informatik Key News & Latest Developments
Table 68. Toshiba Company Summary
Table 69. Toshiba Bus Line Transceiver Product Offerings
Table 70. Toshiba Bus Line Transceiver Sales (Million Units), Revenue (US$, Mn) and Average Price (US$/Unit) & (2021-2026)
Table 71. Toshiba Key News & Latest Developments
Table 72. Infineon Company Summary
Table 73. Infineon Bus Line Transceiver Product Offerings
Table 74. Infineon Bus Line Transceiver Sales (Million Units), Revenue (US$, Mn) and Average Price (US$/Unit) & (2021-2026)
Table 75. Infineon Key News & Latest Developments
Table 76. Microchip Technology Company Summary
Table 77. Microchip Technology Bus Line Transceiver Product Offerings
Table 78. Microchip Technology Bus Line Transceiver Sales (Million Units), Revenue (US$, Mn) and Average Price (US$/Unit) & (2021-2026)
Table 79. Microchip Technology Key News & Latest Developments
Table 80. Exar Company Summary
Table 81. Exar Bus Line Transceiver Product Offerings
Table 82. Exar Bus Line Transceiver Sales (Million Units), Revenue (US$, Mn) and Average Price (US$/Unit) & (2021-2026)
Table 83. Exar Key News & Latest Developments
Table 84. STMicroelectronics Company Summary
Table 85. STMicroelectronics Bus Line Transceiver Product Offerings
Table 86. STMicroelectronics Bus Line Transceiver Sales (Million Units), Revenue (US$, Mn) and Average Price (US$/Unit) & (2021-2026)
Table 87. STMicroelectronics Key News & Latest Developments
Table 88. SG MICRO Company Summary
Table 89. SG MICRO Bus Line Transceiver Product Offerings
Table 90. SG MICRO Bus Line Transceiver Sales (Million Units), Revenue (US$, Mn) and Average Price (US$/Unit) & (2021-2026)
Table 91. SG MICRO Key News & Latest Developments
Table 92. Nexperia Company Summary
Table 93. Nexperia Bus Line Transceiver Product Offerings
Table 94. Nexperia Bus Line Transceiver Sales (Million Units), Revenue (US$, Mn) and Average Price (US$/Unit) & (2021-2026)
Table 95. Nexperia Key News & Latest Developments
Table 96. Adafruit Company Summary
Table 97. Adafruit Bus Line Transceiver Product Offerings
Table 98. Adafruit Bus Line Transceiver Sales (Million Units), Revenue (US$, Mn) and Average Price (US$/Unit) & (2021-2026)
Table 99. Adafruit Key News & Latest Developments
Table 100. Analog Devices Company Summary
Table 101. Analog Devices Bus Line Transceiver Product Offerings
Table 102. Analog Devices Bus Line Transceiver Sales (Million Units), Revenue (US$, Mn) and Average Price (US$/Unit) & (2021-2026)
Table 103. Analog Devices Key News & Latest Developments
Table 104. NTE Electronics Company Summary
Table 105. NTE Electronics Bus Line Transceiver Product Offerings
Table 106. NTE Electronics Bus Line Transceiver Sales (Million Units), Revenue (US$, Mn) and Average Price (US$/Unit) & (2021-2026)
Table 107. NTE Electronics Key News & Latest Developments
Table 108. Diodes Incorporated Company Summary
Table 109. Diodes Incorporated Bus Line Transceiver Product Offerings
Table 110. Diodes Incorporated Bus Line Transceiver Sales (Million Units), Revenue (US$, Mn) and Average Price (US$/Unit) & (2021-2026)
Table 111. Diodes Incorporated Key News & Latest Developments
Table 112. Renesas Electronics Company Summary
Table 113. Renesas Electronics Bus Line Transceiver Product Offerings
Table 114. Renesas Electronics Bus Line Transceiver Sales (Million Units), Revenue (US$, Mn) and Average Price (US$/Unit) & (2021-2026)
Table 115. Renesas Electronics Key News & Latest Developments
Table 116. Teledyne Company Summary
Table 117. Teledyne Bus Line Transceiver Product Offerings
Table 118. Teledyne Bus Line Transceiver Sales (Million Units), Revenue (US$, Mn) and Average Price (US$/Unit) & (2021-2026)
Table 119. Teledyne Key News & Latest Developments
Table 120. Bus Line Transceiver Capacity of Key Manufacturers in Global Market, 2024-2026 (Million Units)
Table 121. Global Bus Line Transceiver Capacity Market Share of Key Manufacturers, 2024-2026
Table 122. Global Bus Line Transceiver Production by Region, 2021-2026 (Million Units)
Table 123. Global Bus Line Transceiver Production by Region, 2027-2032 (Million Units)
Table 124. Bus Line Transceiver Market Opportunities & Trends in Global Market
Table 125. Bus Line Transceiver Market Drivers in Global Market
Table 126. Bus Line Transceiver Market Restraints in Global Market
Table 127. Bus Line Transceiver Raw Materials
Table 128. Bus Line Transceiver Raw Materials Suppliers in Global Market
Table 129. Typical Bus Line Transceiver Downstream
Table 130. Bus Line Transceiver Downstream Clients in Global Market
Table 131. Bus Line Transceiver Distributors and Sales Agents in Global Market

List of Figures
Figure 1. Bus Line Transceiver Product Picture
Figure 2. Bus Line Transceiver Segment by Voltage in 2025
Figure 3. Bus Line Transceiver Segment by Current Sinking Capability in 2025
Figure 4. Bus Line Transceiver Segment by Packaging Method in 2025
Figure 5. Bus Line Transceiver Segment by Application in 2025
Figure 6. Global Bus Line Transceiver Market Overview: 2025
Figure 7. Key Caveats
Figure 8. Global Bus Line Transceiver Market Size: 2025 VS 2032 (US$, Mn)
Figure 9. Global Bus Line Transceiver Revenue: 2021-2032 (US$, Mn)
Figure 10. Bus Line Transceiver Sales in Global Market: 2021-2032 (Million Units)
Figure 11. The Top 3 and 5 Players Market Share by Bus Line Transceiver Revenue in 2025
Figure 12. Segment by Voltage – Global Bus Line Transceiver Revenue, (US$, Mn), 2025 & 2032
Figure 13. Segment by Voltage – Global Bus Line Transceiver Revenue Market Share, 2021-2032
Figure 14. Segment by Voltage – Global Bus Line Transceiver Sales Market Share, 2021-2032
Figure 15. Segment by Voltage – Global Bus Line Transceiver Price (US$/Unit), 2021-2032
Figure 16. Segment by Current Sinking Capability – Global Bus Line Transceiver Revenue, (US$, Mn), 2025 & 2032
Figure 17. Segment by Current Sinking Capability – Global Bus Line Transceiver Revenue Market Share, 2021-2032
Figure 18. Segment by Current Sinking Capability – Global Bus Line Transceiver Sales Market Share, 2021-2032
Figure 19. Segment by Current Sinking Capability – Global Bus Line Transceiver Price (US$/Unit), 2021-2032
Figure 20. Segment by Packaging Method – Global Bus Line Transceiver Revenue, (US$, Mn), 2025 & 2032
Figure 21. Segment by Packaging Method – Global Bus Line Transceiver Revenue Market Share, 2021-2032
Figure 22. Segment by Packaging Method – Global Bus Line Transceiver Sales Market Share, 2021-2032
Figure 23. Segment by Packaging Method – Global Bus Line Transceiver Price (US$/Unit), 2021-2032
Figure 24. Segment by Application – Global Bus Line Transceiver Revenue, (US$, Mn), 2025 & 2032
Figure 25. Segment by Application – Global Bus Line Transceiver Revenue Market Share, 2021-2032
Figure 26. Segment by Application – Global Bus Line Transceiver Sales Market Share, 2021-2032
Figure 27. Segment by Application -Global Bus Line Transceiver Price (US$/Unit), 2021-2032
Figure 28. By Region – Global Bus Line Transceiver Revenue, (US$, Mn), 2025 & 2032
Figure 29. By Region – Global Bus Line Transceiver Revenue Market Share, 2021 VS 2025 VS 2032
Figure 30. By Region – Global Bus Line Transceiver Revenue Market Share, 2021-2032
Figure 31. By Region – Global Bus Line Transceiver Sales Market Share, 2021-2032
Figure 32. By Country – North America Bus Line Transceiver Revenue Market Share, 2021-2032
Figure 33. By Country – North America Bus Line Transceiver Sales Market Share, 2021-2032
Figure 34. United States Bus Line Transceiver Revenue, (US$, Mn), 2021-2032
Figure 35. Canada Bus Line Transceiver Revenue, (US$, Mn), 2021-2032
Figure 36. Mexico Bus Line Transceiver Revenue, (US$, Mn), 2021-2032
Figure 37. By Country – Europe Bus Line Transceiver Revenue Market Share, 2021-2032
Figure 38. By Country – Europe Bus Line Transceiver Sales Market Share, 2021-2032
Figure 39. Germany Bus Line Transceiver Revenue, (US$, Mn), 2021-2032
Figure 40. France Bus Line Transceiver Revenue, (US$, Mn), 2021-2032
Figure 41. U.K. Bus Line Transceiver Revenue, (US$, Mn), 2021-2032
Figure 42. Italy Bus Line Transceiver Revenue, (US$, Mn), 2021-2032
Figure 43. Russia Bus Line Transceiver Revenue, (US$, Mn), 2021-2032
Figure 44. Nordic Countries Bus Line Transceiver Revenue, (US$, Mn), 2021-2032
Figure 45. Benelux Bus Line Transceiver Revenue, (US$, Mn), 2021-2032
Figure 46. By Region – Asia Bus Line Transceiver Revenue Market Share, 2021-2032
Figure 47. By Region – Asia Bus Line Transceiver Sales Market Share, 2021-2032
Figure 48. China Bus Line Transceiver Revenue, (US$, Mn), 2021-2032
Figure 49. Japan Bus Line Transceiver Revenue, (US$, Mn), 2021-2032
Figure 50. South Korea Bus Line Transceiver Revenue, (US$, Mn), 2021-2032
Figure 51. Southeast Asia Bus Line Transceiver Revenue, (US$, Mn), 2021-2032
Figure 52. India Bus Line Transceiver Revenue, (US$, Mn), 2021-2032
Figure 53. By Country – South America Bus Line Transceiver Revenue Market Share, 2021-2032
Figure 54. By Country – South America Bus Line Transceiver Sales, Market Share, 2021-2032
Figure 55. Brazil Bus Line Transceiver Revenue, (US$, Mn), 2021-2032
Figure 56. Argentina Bus Line Transceiver Revenue, (US$, Mn), 2021-2032
Figure 57. By Country – Middle East & Africa Bus Line Transceiver Revenue, Market Share, 2021-2032
Figure 58. By Country – Middle East & Africa Bus Line Transceiver Sales, Market Share, 2021-2032
Figure 59. Turkey Bus Line Transceiver Revenue, (US$, Mn), 2021-2032
Figure 60. Israel Bus Line Transceiver Revenue, (US$, Mn), 2021-2032
Figure 61. Saudi Arabia Bus Line Transceiver Revenue, (US$, Mn), 2021-2032
Figure 62. UAE Bus Line Transceiver Revenue, (US$, Mn), 2021-2032
Figure 63. Global Bus Line Transceiver Production Capacity (Million Units), 2021-2032
Figure 64. The Percentage of Production Bus Line Transceiver by Region, 2025 VS 2032
Figure 65. Bus Line Transceiver Industry Value Chain
Figure 66. Marketing Channels