
3 Inch or Larger Wafer Mapping Sensor Market Insights
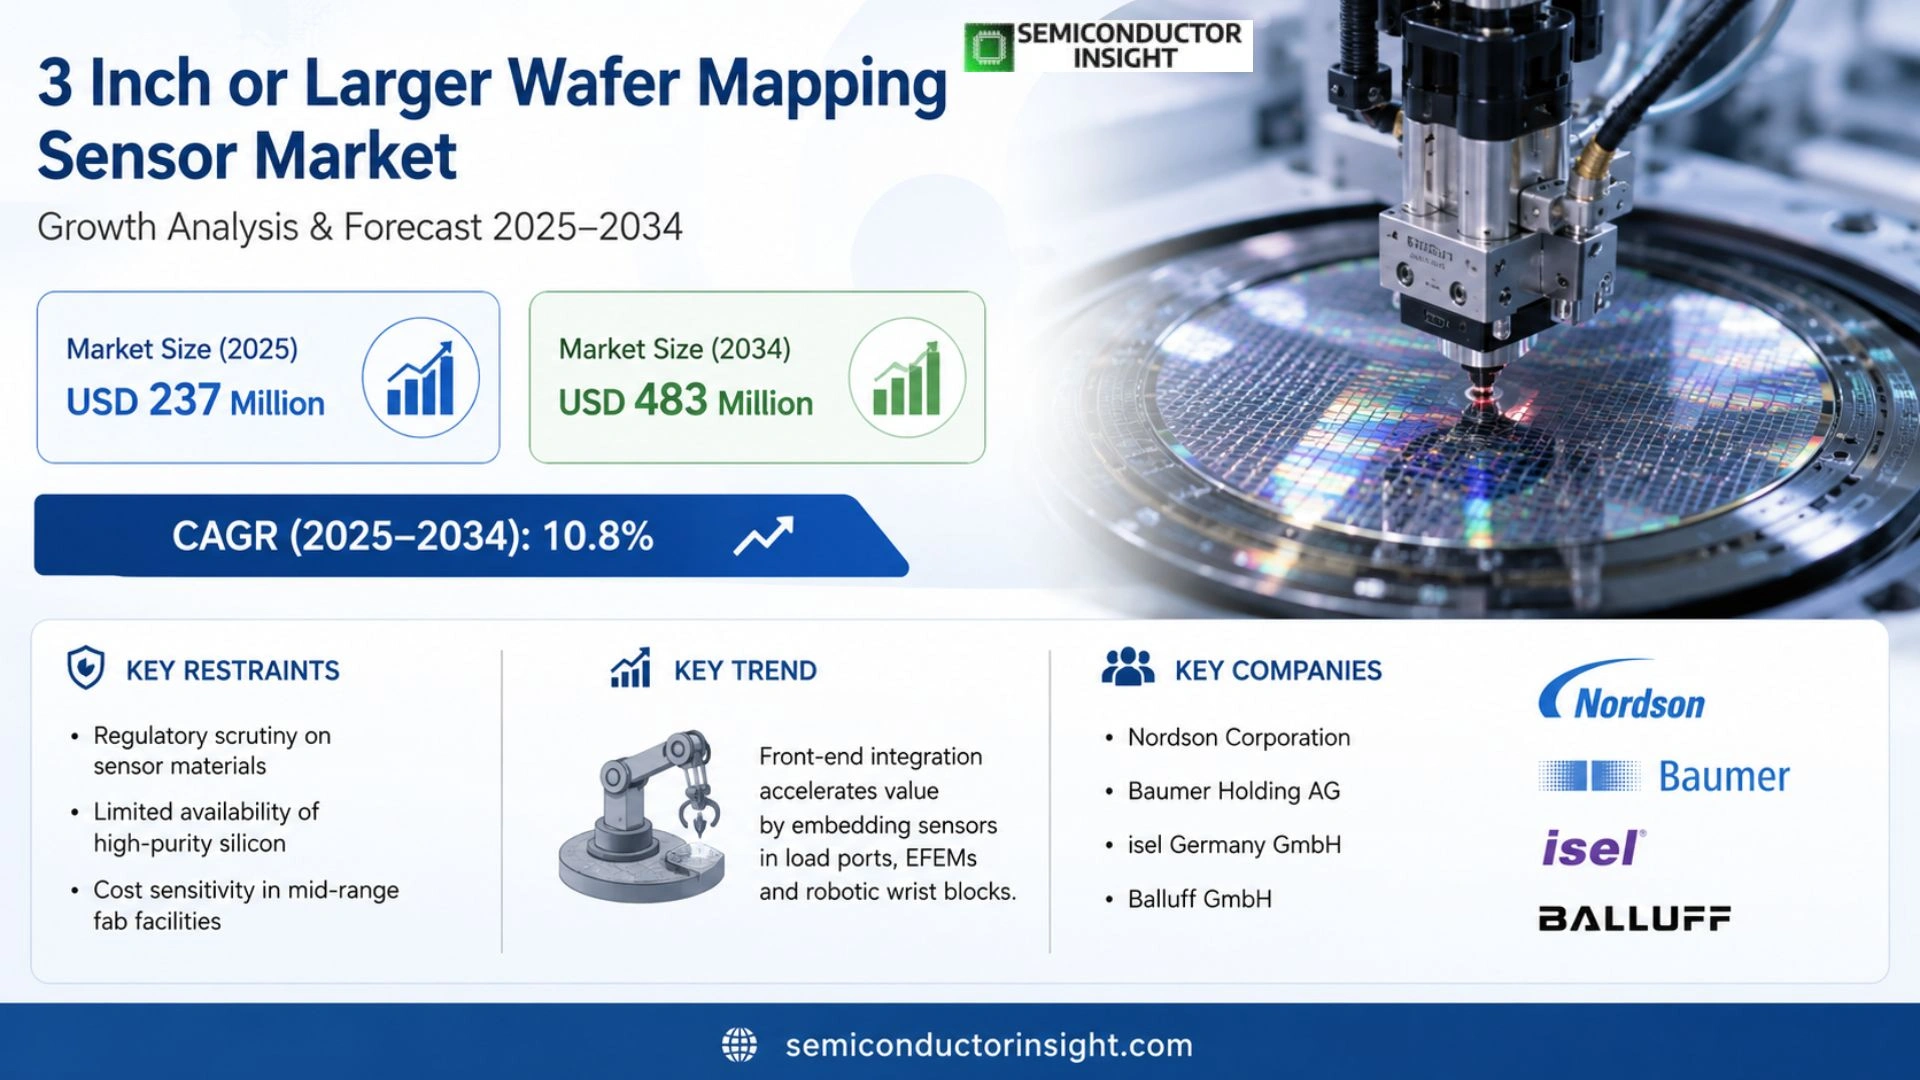
3 Inch or Larger Wafer Mapping Sensor Market was valued at USD 237 million in 2025 and moves to USD 483 million by 2034, reflecting a CAGR of 10.8% over the forecast horizon.
Wafer mapping sensors for wafers 3 inches and larger serve as detection components within front‑end semiconductor automation. They generate a complete cassette slot map before handling begins, identifying empty slots, double wafers, cross‑slots, fly‑out conditions, protrusions, tilts, thin or coated wafers, thereby preventing mis‑picks, collisions and tool downtime. Solutions span standalone reflective heads, through‑beam units, fiber‑optic probes and background‑suppressed laser modules, as well as integrated designs mounted on end‑effectors, wrist blocks or EFEM systems.
Growth stems from continued rollout of 200 mm production lines through 2026 and expanding capacity for 300 mm equipment, supported by policy incentives across the United States, Europe and Asia‑Pacific. The rise of power‑semiconductor and SiC processes adds demand for adaptable mapping technologies capable of handling high‑transmittance wafers.
MARKET DRIVERS
Scaling Demands in Semiconductor Manufacturing
The relentless push toward higher transistor density forces fabs to employ wafers larger than the traditional 2‑inch format. Consequently, 3 Inch or Larger Wafer Mapping Sensor Market experiences a surge as manufacturers replace legacy 1‑inch solutions with sensors that can scan full‑size dies without sacrificing resolution. This shift not only shortens cycle time but also aligns with the economics of volume production, where each additional yield point translates into multi‑million‑dollar savings.
Enhanced Defect Detection Capabilities
Next‑generation sensor architectures now combine high‑speed photodiodes with on‑chip signal processing, enabling real‑time defect classification during wafer mapping. When tied to AI‑driven analytics, these sensors can differentiate between process‑induced variations and genuine process drift, reducing false‑positive alerts by roughly 25 % in leading fabs. The ability to act on precise defect data empowers line managers to implement corrective actions before downstream equipment is impacted.
➤ New sensor designs cut inspection latency by up to 40 %, delivering faster feedback loops for yield optimization.
In sum, the convergence of larger wafer formats and smarter, faster sensor suites creates a virtuous cycle: higher throughput fuels tighter quality control, which in turn justifies further investment in 3‑inch or larger mapping solutions.
MARKET CHALLENGES
High Capital Expenditure for Sensor Integration
Deploying state‑of‑the‑art wafer mapping sensors often requires retrofitting existing metrology lines, a process that can exceed $10 million for a midsize fab. The upfront cost, coupled with the need for specialized calibration staff, makes budgeting a multi‑year exercise. Smaller foundries, which operate on tighter margins, frequently postpone adoption until the technology becomes commodity‑grade.
Other Challenges
Supply Chain Volatility
The semiconductor sensor market relies on a narrow set of high‑purity silicon sources. Recent geopolitical tensions have caused lead times to stretch beyond six months, inflating inventory costs for fabs that seek to keep a buffer of spare sensors.
Calibration Complexity
Accurate wafer mapping demands sub‑nanometer alignment tolerances. As sensor pixel counts rise, the calibration matrix expands exponentially, requiring sophisticated software that many equipment vendors have yet to fully integrate.
MARKET RESTRAINTS
Regulatory Scrutiny on Sensor Materials
Emerging environmental directives in the EU and North America limit the use of certain dopants and heavy‑metal alloys in sensor fabrication. Compliance drives additional testing cycles, which can delay product launches and increase unit costs for suppliers targeting 3 Inch or Larger Wafer Mapping Sensor Market.
Limited Availability of High‑Purity Silicon
As demand for larger wafer sensors climbs, the pool of ultra‑high‑purity silicon wafers shrinks, prompting price premiums that erode the economic advantage of switching from older 2‑inch platforms.
Cost Sensitivity in Mid‑range Fab Facilities
Mid‑tier fabs prioritize equipment that offers the lowest total cost of ownership. When sensor upgrades do not present an immediate ROI within 12‑18 months, decision‑makers often defer purchases, slowing overall market penetration.
MARKET OPPORTUNITIES
Emerging Applications in Advanced Packaging
Advanced packaging techniques such as fan‑out wafer‑level packaging (FO‑WLP) and heterogeneous integration require precise inspection of large‑area interconnects. Sensors that can map 3‑inch or larger wafers with micron‑level accuracy become indispensable, opening a lucrative niche for vendors that adapt their product lines to these new form factors.
Growth of 3D‑IC and Heterogeneous Integration
The rise of 3D‑IC stacks amplifies the importance of defect mapping across multiple bonded layers. Suppliers that embed multi‑spectral sensing capabilities,combining visible, infrared, and terahertz modalities,stand to capture a disproportionate share of the market as designers seek to validate vertical interconnects in real time.
Strategic Partnerships with Equipment OEMs
Collaborations between sensor manufacturers and lithography or metrology OEMs can embed wafer‑mapping functionality directly into production tools. Such OEM‑driven solutions streamline workflow, reduce footprint, and offer end‑users a bundled value proposition that accelerates adoption across 3 Inch or Larger Wafer Mapping Sensor Market.
3 Inch or Larger Wafer Mapping Sensor Market Trends
Front‑End Integration Accelerates Value
Equipment manufacturers are embedding wafer‑mapping sensors directly into load ports, EFEMs and robotic wrist blocks rather than treating them as add‑on components. This shift shortens the detection loop, allowing control software to react to slot‑status information before a wafer is gripped. The practical outcome is fewer mis‑picks, lower tool downtime and smoother takt compliance on 200 mm and 300 mm lines. Because the sensor is now part of the equipment architecture, customers view the purchase as a system upgrade rather than a simple opto‑electronic part, raising design‑in stickiness and creating recurring revenue streams for OEMs. The trend also spurs higher specifications for optical clarity and background suppression, as the sensor must operate reliably beneath the cleanroom lighting conditions that dominate front‑end modules.
Other Trends
Technology Diversification
Suppliers continue to offer parallel optical approaches,reflective heads, through‑beam emitters, fiber‑optic bundles and background‑suppressed laser modules,each tuned to distinct wafer materials such as silicon, SiC or sapphire. The coexistence of multiple families reflects the difficulty of achieving a one‑size‑fits‑all solution when dealing with ultra‑thin or high‑transmittance wafers. End‑users select the style that best matches their carrier geometry, cleanliness regime and the speed of the handling robot. This multiplicity preserves a barrier to entry for new competitors, because successful market participation now requires expertise across several optical disciplines as well as integration know‑how.
Regional Concentration and Policy Support
The bulk of sensor consumption remains anchored in East Asia, where dense clusters of 200 mm and 300 mm fabs generate steady demand for front‑end automation. Meanwhile, policy incentives in North America and Europe are encouraging the establishment of new fabs and the retro‑fit of existing lines, which in turn fuels orders for mapping modules that can be certified to local standards. Japanese firms dominate the standalone sensor niche, while Korean and Taiwanese companies bring integrated robot‑arm solutions to market. Chinese manufacturers are expanding their footprint by offering localized service contracts and tailored EFEM integrations, leveraging domestic subsidy programs. Collectively, these geographic dynamics suggest that 3 Inch or Larger Wafer Mapping Sensor Market will evolve through a blend of technology depth and region‑specific policy momentum, shaping investment decisions for equipment vendors and end‑users alike.
COMPETITIVE LANDSCAPE
Key Industry Players
3‑Inch or Larger Wafer Mapping Sensor Market – Competitive Overview
The market is anchored by a handful of firms that command the majority of design‑in revenue for standalone and integrated mapping solutions. Nordson Corporation, with its extensive portfolio of reflective and fiber‑optic sensors, supplies the bulk of equipment OEMs in North America and Europe, securing long‑term contracts that embed its technology deep into robot arm and EFEM architectures. Baumer Holding AG and KEYENCE CORPORATION complement this dominance by offering high‑precision through‑beam and laser‑based heads that cater to high‑volume 200 mm and 300 mm fabs, where throughput and repeatability are non‑negotiable. OMRON Corporation adds a systems‑integration layer, bundling sensor modules with control software that aligns with the takt‑time logic of modern fabs. This concentration of capabilities creates a de‑facto tiered structure: a core of global sensor specialists, a second tier of optical innovators, and a peripheral group of regional integrators that adapt the technology to local carrier standards and material mixes.
Beyond the core, a diverse set of niche players brings specialized expertise that sustains competition and mitigates the risk of supplier lock‑in. Companies such as isel Germany GmbH and Balluff GmbH focus on miniaturized sensing heads for ultra‑thin and sapphire wafers, while TAKENAKA ELECTRONIC INDUSTRIAL CO., LTD. and Panasonic Holdings Corporation have leveraged their legacy in laser components to address high‑transmittance SiC applications. European and Asian firms,OPTEX FA, JEL Corporation, HIRATA Corporation, HanMech Controls, Robots and Design, KORO, Sanwa Engineering, and Fortrend Engineering,provide region‑specific integration services, often coupling sensors with local robot manufacturers or offering after‑sales calibration in the language of the domestic fab. Their agility in customizing carrier‑type interfaces and rapid response to policy‑driven fab expansions in China, Korea, and the United States keeps the market dynamic despite its modest size.
List of Key Wafer Mapping Sensor Companies Profiled
- Nordson Corporation
- Baumer Holding AG
- isel Germany GmbH
- Balluff GmbH
- TAKENAKA ELECTRONIC INDUSTRIAL CO., LTD.
- Panasonic Holdings Corporation
- KEYENCE CORPORATION
- OMRON Corporation
- OPTEX FA Co., Ltd.
- JEL Corporation
- HIRATA Corporation
- HanMech Controls Co., Ltd.
- Robots and Design, Co., Ltd.
- KORO
- Sanwa Engineering Corp.
- Fortrend Engineering Corporation
Segment Analysis:
| Segment Category | Sub-Segments | Key Insights |
| By Type |
|
Reflective Sensors
|
| By Application |
|
Carrier Slot Mapping
|
| By End User |
|
Wafer fabs
|
| By Integration Form |
|
End‑Effector / Wrist‑Integrated Modules
|
| By Primary Installation Position |
|
Robot Arm / Wrist Side
|
Regional Analysis: 3 Inch or Larger Wafer Mapping Sensor Market
Asia-Pacific
Japan and South Korea host the densest clusters of wafer‑processing equipment, where sensor manufacturers align their production lines with the cadence of leading fabs. The geographic proximity reduces freight friction and allows real‑time feedback loops, fostering incremental improvements that meet the region’s exacting performance standards.
Recent disruptions have highlighted the value of diversified component sourcing across Taiwan, Singapore, and mainland China. Companies are now engaging multiple tier‑1 distributors to mitigate bottlenecks, a practice that also spreads technical expertise throughout the supply chain.
Regional research institutes collaborate closely with sensor firms on advanced defect‑mapping algorithms. The joint‑venture model accelerates the translation of academic breakthroughs into commercial calibrations, sharpening competitive edges for early adopters.
While environmental regulations tighten, authorities in the region grant expedited approvals for low‑power sensing modules, encouraging manufacturers to prioritize eco‑design without sacrificing resolution.
North America
In North America, the market is shaped by a strong emphasis on advanced packaging and the integration of wafer mapping sensors into heterogeneous test platforms. Major semiconductor hubs in the United States leverage extensive engineering talent to customize sensor firmware for specific yield‑enhancement projects. End users prioritize interoperability with existing data‑analytics suites, prompting vendors to develop open‑interface APIs. The region’s focus on intellectual‑property protection drives a premium on proprietary algorithms that can pinpoint subtle defect patterns, influencing pricing strategies toward value‑based contracts rather than volume discounts.
Europe
European participants bring a distinctive blend of precision engineering and strict compliance frameworks to 3 Inch or Larger Wafer Mapping Sensor Market. Countries such as Germany and the Netherlands maintain high‑mix, low‑volume manufacturing lines that demand highly adaptable sensor solutions. OEMs respond by offering modular hardware that can be reconfigured for differing wafer sizes and defect‑type profiles. Sustainability directives across the EU also press manufacturers to minimize material waste, encouraging the adoption of sensors with longer service lifespans and programmable calibration cycles.
South America
South America’s engagement with wafer mapping sensors remains nascent, yet growth is anchored by regional initiatives to attract semiconductor investment. Nations like Brazil are establishing pilot fabs that require cost‑effective, yet reliable, sensor packages. Suppliers therefore emphasize straightforward integration and robust field support to lower entry barriers. The market narrative is gradually shifting from imported off‑the‑shelf hardware toward locally assembled units, a move that could stimulate ancillary services such as on‑site training and regional after‑sales networks.
Middle East & Africa
In the Middle East & Africa, the sector is largely driven by government‑backed technology parks seeking to diversify economies away from traditional industries. Emerging fabrication facilities in the United Arab Emirates and Egypt are exploring wafer mapping sensors that can operate under variable climate conditions, prompting vendors to engineer temperature‑tolerant enclosures. Partnerships with local universities are fostering a talent pipeline focused on sensor diagnostics, while financing models that spread capital expenditure across multiple development phases help mitigate fiscal risk for early adopters.
Report Scope
This market research report provides a comprehensive analysis of the 3 Inch or Larger Wafer Mapping Sensor Market , covering the forecast period 2026–2034. It offers detailed insights into market dynamics, technological advancements, competitive landscape, and key trends shaping the industry.
Key focus areas of the report include:
- Market Overview: The report begins with an overview outlining its current market scenario, key growth indicators, and industry transformation drivers. It discusses macroeconomic factors, demand–supply balance, regulatory landscape, and the strategic role of semiconductors in powering advancements across industries such as automotive, telecommunications, consumer electronics, and industrial automation.
- Market Size & Forecast: Historical data and future projections for revenue, unit shipments, and market value across major regions and segments.
- Segmentation Analysis: Detailed breakdown by product type, technology, application, and end-user industry to identify high-growth segments and investment opportunities.
- Regional Insights: Insights into market performance across North America, Europe, Asia-Pacific, Latin America, and the Middle East & Africa, including country-level analysis where relevant.
- Competitive Landscape: Profiles of leading market participants, including their product offerings, R&D focus, manufacturing capacity, pricing strategies, and recent developments such as mergers, acquisitions, and partnerships.
- Technology Trends & Innovation: Assessment of emerging technologies, integration of AI/IoT, semiconductor design trends, fabrication techniques, and evolving industry standards.
- Market Drivers & Restraints: Evaluation of factors driving market growth along with challenges, supply chain constraints, regulatory issues, and market-entry barriers.
- Stakeholder Insights: Insights for component suppliers, OEMs, system integrators, investors, and policymakers regarding the evolving ecosystem and strategic opportunities.
Primary and secondary research methods are employed, including interviews with industry experts, data from verified sources, and real-time market intelligence to ensure the accuracy and reliability of the insights presented.
FREQUENTLY ASKED QUESTIONS:
What is the current market size of 3 Inch or Larger Wafer Mapping Sensor Market?
-> 3 Inch or Larger Wafer Mapping Sensor Market moves to USD 483 million by 2034, reflecting a CAGR of 10.8% over the forecast horizon.
Which key companies operate in 3 Inch or Larger Wafer Mapping Sensor Market?
-> Key players include Nordson Corporation, Baumer Holding AG, isel Germany GmbH, Balluff GmbH, TAKENAKA ELECTRONIC INDUSTRIAL CO., LTD., Panasonic Holdings Corporation, KEYENCE CORPORATION, OMRON Corporation, OPTEX FA Co., Ltd., JEL Corporation, among others.
What are the primary growth drivers for the market?
-> Growth is driven by continued expansion of 200 mm and 300 mm wafer fabs, AI‑driven automation investments, increasing demand for advanced‑node equipment, and strong policy support in the United States, Europe, China, Japan and South Korea.
Which region dominates the market?
-> East Asia remains the dominant region, with China, Japan, South Korea and Taiwan accounting for the largest share of demand, while North America and Europe show steady growth backed by new fab construction.
What emerging trends are shaping the wafer mapping sensor market?
-> Emerging trends include diversification of sensor technologies (reflective, through‑beam, fiber‑optic, background‑suppressed laser), integration of mapping modules into robot end‑effectors and EFEM/SMIF systems, and adaptation to high‑transmittance wafers such as SiC, sapphire and ultra‑thin formats.
Get Sample Report PDF for Exclusive Insights
Report Sample Includes
- Table of Contents
- List of Tables & Figures
- Charts, Research Methodology, and more...
 Download Sample Report PDF



