MARKET INSIGHTS
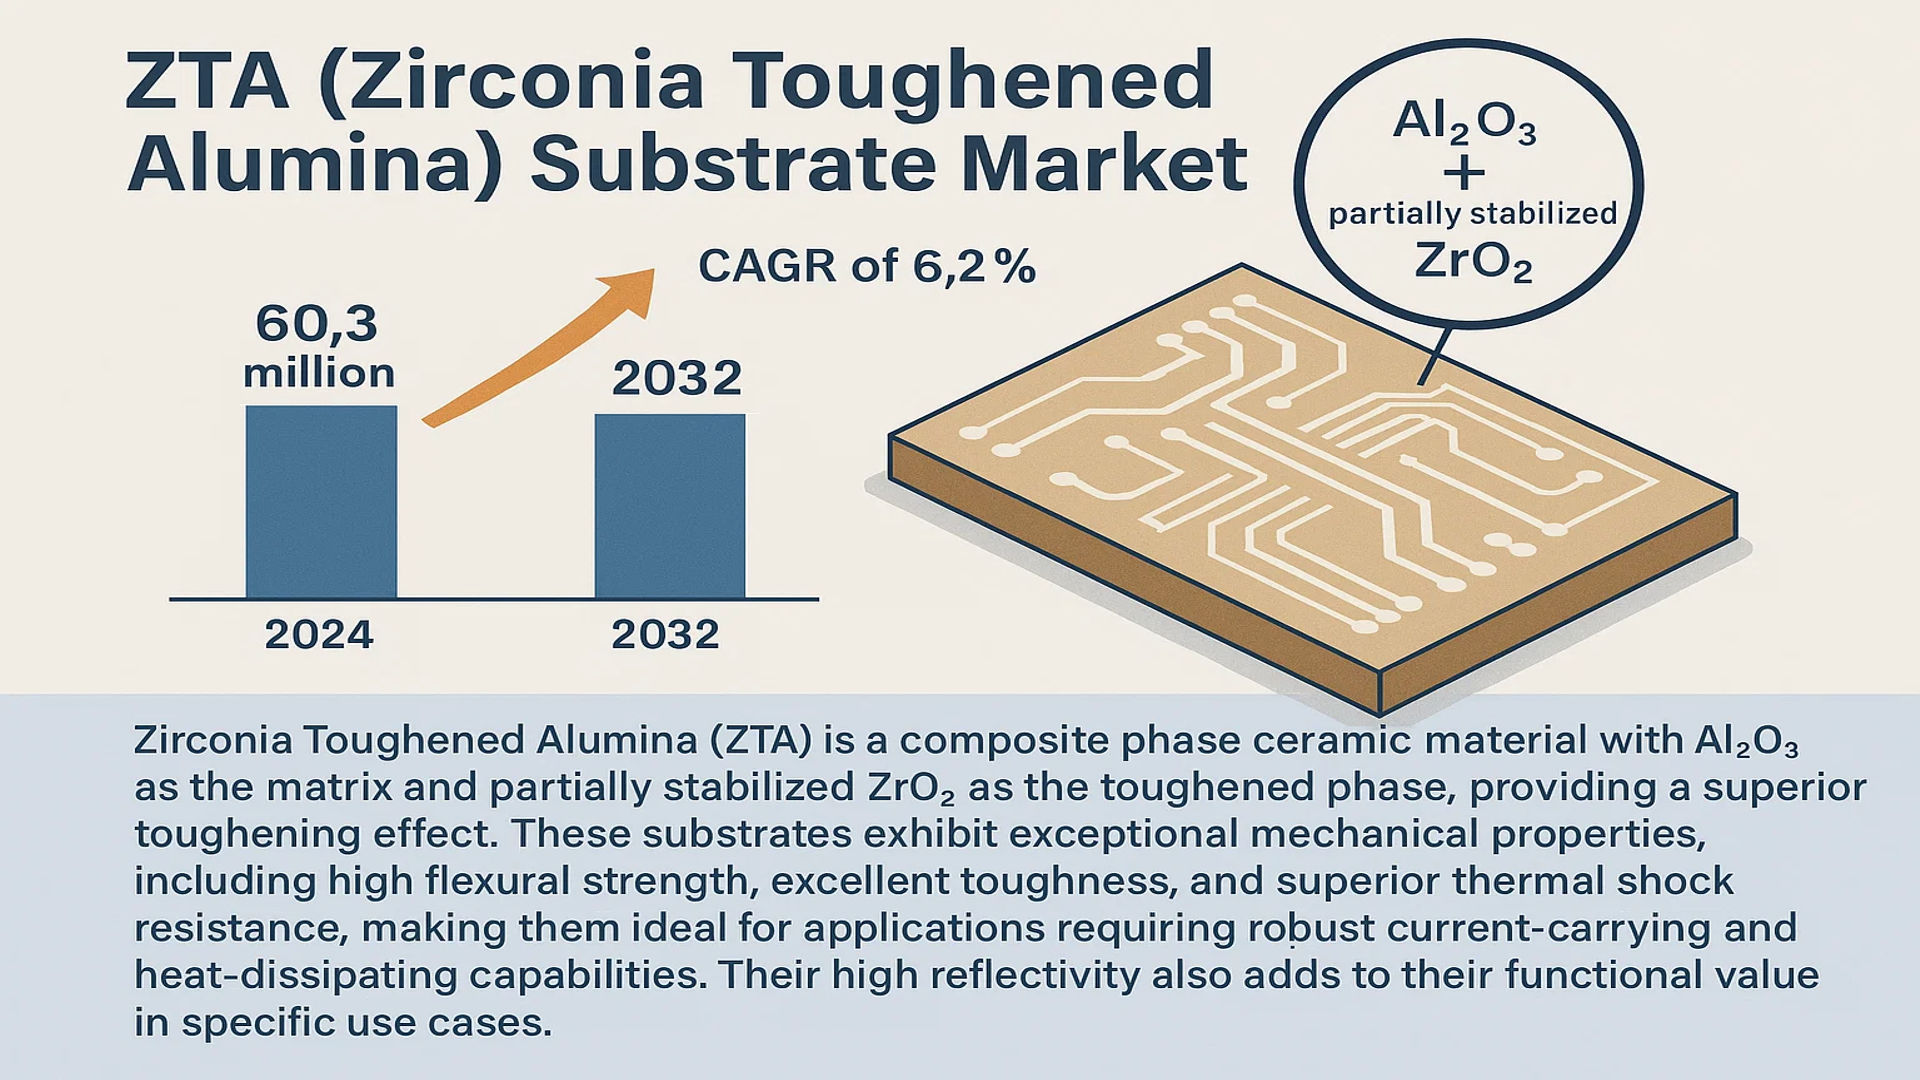
The global ZTA (Zirconia Toughened Alumina) Substrate Market was valued at 60.3 million in 2024 and is projected to reach US$ 91.2 million by 2032, at a CAGR of 6.2% during the forecast period.
Zirconia Toughened Alumina (ZTA) is a composite phase ceramic material with Al2O3 as the matrix and partially stabilized ZrO2 as the toughened phase, providing a superior toughening effect. These substrates exhibit exceptional mechanical properties, including high flexural strength, excellent toughness, and superior thermal shock resistance, making them ideal for applications requiring robust current-carrying and heat-dissipating capabilities. Their high reflectivity also adds to their functional value in specific use cases.
The market growth is primarily driven by the expanding demand for high-performance substrates in the power electronics sector, particularly for Insulated Gate Bipolar Transistor (IGBT) modules. The superior reliability of ZTA substrates in harsh thermal environments is a key factor propelling their adoption. Furthermore, the market is highly concentrated, with the top five manufacturers accounting for over 80% of the global market share. Key players such as Rogers, KCC, and Heraeus Electronics continue to innovate, focusing on enhancing product performance and expanding production capacity to meet the growing global demand.
MARKET DYNAMICS
MARKET DRIVERS
Expansion of Electric Vehicle and Power Electronics Industries to Drive ZTA Substrate Demand
The global shift toward electrification in automotive and industrial applications is significantly accelerating demand for Zirconia Toughened Alumina substrates. These advanced ceramic substrates serve as critical components in Insulated Gate Bipolar Transistor (IGBT) modules, which are essential for power conversion and control in electric vehicles (EVs), renewable energy systems, and industrial motor drives. The automotive power electronics market is projected to grow at a compound annual growth rate exceeding 8% through 2030, directly correlating with increased ZTA substrate consumption. The exceptional thermal conductivity (approximately 24-28 W/mK) and mechanical strength (flexural strength reaching 400-500 MPa) of ZTA substrates make them indispensable for high-power applications where thermal management and reliability are paramount. Furthermore, government mandates for vehicle electrification and carbon neutrality targets across major economies are creating sustained demand momentum for power electronic components utilizing ZTA substrates.
Superior Performance Characteristics Over Conventional Materials to Boost Adoption
ZTA substrates demonstrate markedly superior performance compared to standard alumina substrates, driving their replacement in demanding applications. The incorporation of zirconia particles within the alumina matrix creates a transformation toughening mechanism that significantly enhances fracture toughness—typically 4-6 MPa·m¹/² compared to 3-4 MPa·m¹/² for pure alumina. This mechanical advantage allows for thinner substrate designs (0.25mm and 0.32mm thicknesses) while maintaining structural integrity, enabling more compact power module designs. The thermal expansion coefficient of ZTA (7.5-8.5 × 10⁻⁶/K) provides better matching with silicon chips and direct bonded copper layers, reducing thermal stress failures. These performance benefits are particularly valuable in high-reliability applications such as automotive power systems, where failure rates must remain below 10 parts per million over operating lifetimes exceeding 15 years. The continuous improvement in ZTA manufacturing processes has also reduced production costs by approximately 15-20% over the past five years, making these advanced substrates more economically viable for mass production applications.
Growing LED Packaging and Optoelectronics Applications to Fuel Market Growth
The optoelectronics industry represents a significant growth avenue for ZTA substrates, particularly in high-power LED packaging and laser diode applications. The exceptional thermal stability and high reflectivity (reaching 92-95% in the visible spectrum) of ZTA substrates make them ideal for thermal management in high-brightness LED packages, where junction temperatures must be maintained below 125°C for optimal performance and longevity. The global LED packaging market is expanding at approximately 6-7% annually, with high-power segments growing even faster. ZTA substrates provide superior performance compared to conventional aluminum nitride and alumina substrates in terms of thermal shock resistance, capable of withstanding temperature cycling from -55°C to 150°C for thousands of cycles without degradation. This reliability advantage is crucial for automotive lighting, industrial lighting, and display applications where failure rates must remain extremely low. Additionally, the development of advanced metallization techniques for ZTA substrates has improved their compatibility with eutectic die-attach processes, further enhancing their suitability for optoelectronic packaging.
MARKET RESTRAINTS
High Manufacturing Complexity and Cost Structure to Limit Market Penetration
The sophisticated manufacturing process required for ZTA substrates presents significant barriers to market expansion. Producing high-quality ZTA substrates involves precise control of zirconia dispersion within the alumina matrix, requiring advanced powder processing, sintering at temperatures exceeding 1600°C, and stringent quality control measures. The raw material costs for high-purity alumina and yttria-stabilized zirconia are approximately 40-50% higher than standard electronic-grade alumina, contributing to a final product cost that is typically 60-80% above conventional alumina substrates. This cost differential makes ZTA substrates primarily viable only in applications where their performance advantages are absolutely necessary. The manufacturing yield for ZTA substrates also remains challenging, with industry averages hovering around 75-85% compared to 90-95% for standard alumina substrates, primarily due to cracking during sintering and difficulties in maintaining uniform zirconia distribution. These technical and economic factors collectively restrain broader adoption across price-sensitive applications.
Supply Chain Constraints for Critical Raw Materials to Hinder Production Scaling
The ZTA substrate market faces substantial supply chain challenges related to the availability and pricing of critical raw materials. High-purity alumina (99.5%+ purity) and yttria-stabilized zirconia (3Y-ZrO₂) represent essential inputs whose production is concentrated among a limited number of global suppliers. Recent years have witnessed price volatility exceeding 25-30% for these materials due to supply disruptions, environmental regulations affecting mining operations, and increasing demand from other advanced ceramic sectors. The geographical concentration of rare earth element production—particularly yttrium, which is essential for zirconia stabilization—creates additional supply risks, with over 80% of global production originating from a single region. These supply chain vulnerabilities have led to extended lead times for raw material procurement, increasing from typical 4-6 weeks to 12-16 weeks in recent periods. Manufacturers must maintain higher inventory levels to mitigate these risks, increasing working capital requirements by approximately 20-25% and ultimately elevating final product costs.
MARKET CHALLENGES
Technical Limitations in Ultra-Thin Substrate Production to Constrain Miniaturization Trends
The industry-wide trend toward electronic component miniaturization presents significant technical challenges for ZTA substrate manufacturers. While ZTA offers excellent mechanical properties, producing substrates thinner than 0.25mm becomes increasingly difficult due to handling issues during manufacturing and limitations in maintaining zirconia distribution homogeneity. The current manufacturing processes struggle to achieve consistent thickness variations below ±5% for substrates under 0.20mm, whereas many advanced power semiconductor applications require variations within ±2%. This precision limitation restricts ZTA substrate usage in next-generation power modules where space constraints demand thinner profiles. Additionally, the grinding and polishing processes required to achieve these tight tolerances increase production costs by approximately 30-40% compared to standard thickness substrates, making them economically challenging for volume applications. These technical barriers must be overcome through process innovations to fully capitalize on the miniaturization trend in power electronics.
Other Challenges
Standardization and Qualification Hurdles
The absence of industry-wide standards specific to ZTA substrates creates significant market adoption challenges. Unlike established materials such as standard alumina or aluminum nitride, ZTA substrates lack comprehensive international standards governing their material properties, testing methodologies, and performance specifications. This standardization gap forces manufacturers to undertake extensive customer-specific qualification processes that typically require 12-18 months and cost approximately $500,000-$1,000,000 per application. The automotive industry’s stringent qualification requirements—often demanding testing across temperature ranges from -55°C to 175°C for thousands of cycles—present particular challenges for demonstrating long-term reliability. These extended qualification timelines and costs discourage experimentation with ZTA substrates in new applications, limiting market expansion beyond established use cases.
Intellectual Property and Competitive Barriers
The ZTA substrate market faces substantial intellectual property constraints that limit technological diffusion and new market entry. Key manufacturing processes, composition patents, and specific application technologies are protected by intellectual property rights concentrated among a few established players. This IP landscape creates barriers for new entrants and limits collaborative development efforts across the industry. The top five manufacturers control over 80% of the market share and maintain extensive patent portfolios covering critical aspects of ZTA substrate production and application. This concentration of technical knowledge and legal protection slows innovation pace and maintains higher price points, ultimately restricting market growth potential and application diversity.
MARKET OPPORTUNITIES
Emerging Applications in 5G Infrastructure and Aerospace to Create New Growth Frontiers
The rapid deployment of 5G networks and increasing aerospace electronics sophistication present substantial growth opportunities for ZTA substrates. 5G base stations require advanced thermal management solutions for power amplifiers operating at millimeter-wave frequencies, where ZTA substrates’ combination of high thermal conductivity and excellent high-frequency properties offers significant advantages. The global 5G infrastructure market is projected to grow at a compound annual growth rate exceeding 40% through 2030, creating substantial demand for advanced electronic substrates. In aerospace applications, ZTA substrates provide critical reliability in harsh environments, with capabilities to operate at temperatures exceeding 200°C and withstand severe mechanical vibration. The commercial aviation sector’s increasing electrification—with more electric aircraft architectures replacing hydraulic and pneumatic systems—requires power electronics that can operate reliably in extreme conditions. ZTA substrates are positioned to capture these high-value applications where performance requirements justify their premium pricing, potentially adding $15-20 million in annual market value by 2030.
Advanced Manufacturing Technologies to Enable Cost Reduction and Performance Enhancement
Innovations in manufacturing technologies present significant opportunities for overcoming current cost and performance limitations. Advanced sintering techniques such as spark plasma sintering and microwave sintering can reduce processing times by 60-70% while improving microstructural control, potentially increasing production yields to 90-95%. These processes also enable better control of zirconia distribution within the alumina matrix, enhancing transformation toughening effectiveness and allowing for further mechanical property improvements. Developments in tape casting technology are enabling production of larger substrate formats with improved thickness uniformity, reducing waste and improving manufacturing efficiency. Additionally, progress in laser-based machining and patterning techniques is improving the precision of metallization and via formation processes, enhancing the integration capability of ZTA substrates with advanced semiconductor devices. These manufacturing advancements collectively offer the potential to reduce ZTA substrate costs by 25-30% over the next five years, making them competitive in a broader range of applications.
Strategic Collaborations and Vertical Integration to Strengthen Market Position
The evolving competitive landscape offers substantial opportunities through strategic partnerships and vertical integration initiatives. Leading substrate manufacturers are increasingly forming technology partnerships with semiconductor companies and end-users to develop application-specific solutions that maximize ZTA substrate benefits. These collaborations often involve shared development costs and guaranteed volume commitments, reducing market entry risks. Vertical integration strategies—particularly backward integration into raw material production—offer opportunities for cost reduction and supply chain security. Several major manufacturers are investing in high-purity alumina production capabilities to mitigate raw material price volatility and ensure consistent quality. Furthermore, geographic expansion into emerging manufacturing hubs, particularly in Southeast Asia, provides opportunities for cost optimization through access to skilled labor and growing local markets. These strategic initiatives collectively enable market participants to strengthen their competitive positions while expanding the overall addressable market for ZTA substrates.
ZTA (ZIRCONIA TOUGHENED ALUMINA) SUBSTRATE MARKET TRENDS
Electrification of Automotive and Industrial Sectors Driving Demand for High-Performance Substrates
The global push towards electrification, particularly in the automotive and industrial sectors, is a primary catalyst for the ZTA substrate market. The superior thermal and mechanical properties of Zirconia Toughened Alumina make it an indispensable material for Direct Bonded Copper (DBC) substrates used in high-power Insulated Gate Bipolar Transistor (IGBT) modules. These modules are the backbone of power conversion systems in electric vehicles (EVs), renewable energy inverters, and industrial motor drives. With the EV market projected to grow at a compound annual growth rate of over 19% and global investments in renewable energy infrastructure exceeding $1.7 trillion annually, the demand for reliable, high-current-carrying substrates is surging. ZTA substrates, with a flexural strength that can exceed 400 MPa and a thermal conductivity range of 20-30 W/mK, offer the necessary robustness to withstand severe thermal cycling and mechanical stress, making them the material of choice for these demanding applications. This trend is further amplified by stringent industry standards requiring higher operational reliability and longevity.
Other Trends
Miniaturization and High-Power Density in Electronics
The relentless trend towards miniaturization and higher power density in electronic devices is creating significant opportunities for advanced ceramic substrates. While standard alumina substrates are common, applications requiring superior mechanical strength and enhanced thermal management under compact form factors are increasingly adopting ZTA. This is particularly evident in advanced LED packaging for high-brightness applications and next-generation power semiconductor devices. The ability of ZTA substrates to be fabricated into thinner profiles, such as the 0.25mm and 0.32mm variants, without compromising on structural integrity or thermal performance is a key enabler. This allows designers to pack more power into smaller spaces, a critical requirement for modern consumer electronics, telecommunications infrastructure, and aerospace systems. The market for these thinner, high-performance substrates is growing at a notably faster pace compared to standard thickness offerings.
Geographic Shift and Supply Chain Consolidation in Manufacturing
A significant geographic shift in the manufacturing and consumption of ZTA substrates is underway, with Asia-Pacific consolidating its position as the dominant force. The region accounts for over 70% of the global market share, driven by its vast electronics manufacturing ecosystem and the rapid adoption of electric vehicles, particularly in China, Japan, and South Korea. This concentration is also reflected in the competitive landscape, where the top five manufacturers collectively control more than 80% of the market. This high level of consolidation creates a scenario where technological advancements and production capacity are heavily concentrated among a few key players, influencing global pricing and availability. Furthermore, recent investments in expanding production facilities within the region aim to mitigate supply chain risks and cater to the localized demand from automotive and electronics OEMs, reinforcing Asia’s pivotal role in the global ZTA substrate value chain.
COMPETITIVE LANDSCAPE
Key Industry Players
Companies Leverage Technological Innovation and Strategic Expansion to Secure Market Position
The global ZTA substrate market exhibits a highly concentrated competitive structure, dominated by a handful of established manufacturers with significant technological expertise and production capacity. This concentration is primarily driven by the complex manufacturing processes and high capital investment required for producing high-quality ZTA ceramics. The top five manufacturers collectively command over 80% of the global market share, creating significant barriers to entry for new players while ensuring stable supply chains for major end-users in the power electronics and LED industries.
Rogers Corporation maintains a leadership position in the market, leveraging its extensive experience in advanced ceramic materials and strong relationships with global IGBT module manufacturers. The company’s Curamik® DBC substrates incorporating ZTA technology have become industry standards for high-reliability applications in automotive and industrial power electronics. Their recent expansion of production facilities in Europe and Asia demonstrates strategic commitment to meeting growing global demand.
Asian manufacturers, particularly KCC Corporation and Jiangsu Fulehua Semiconductor, have significantly increased their market presence through aggressive pricing strategies and rapid capacity expansion. These companies benefit from proximity to the world’s largest electronics manufacturing hubs and have developed sophisticated production techniques that maintain quality while reducing costs. Their growth has been particularly notable in the consumer electronics and automotive sectors, where cost competitiveness is crucial.
Meanwhile, European players including Heraeus Electronics and CeramTec are focusing on high-performance segments where their technical expertise provides competitive advantages. These companies are investing heavily in research and development to enhance ZTA substrate properties, particularly targeting applications requiring extreme thermal cycling performance and superior mechanical stability. Their strategic partnerships with automotive OEMs and renewable energy equipment manufacturers have positioned them well for future market growth.
The competitive landscape continues to evolve as companies pursue different strategies: while some focus on cost leadership through scaled production, others differentiate through material innovation and application-specific solutions. This dynamic creates a market environment where technological capability, manufacturing efficiency, and customer relationships all contribute significantly to competitive advantage.
List of Key ZTA Substrate Companies Profiled
- Rogers Corporation (U.S.)
- KCC Corporation (South Korea)
- Jiangsu Fulehua Semiconductor Technology Co., Ltd. (China)
- Heraeus Electronics GmbH (Germany)
- CeramTec GmbH (Germany)
- Shengda Tech Co., Ltd. (China)
- NGK Insulators, Ltd. (Japan)
- Nanjing Zhongjiang New Material Co., Ltd. (China)
- BYD Company Limited (China)
Segment Analysis:
By Type
0.32mm ZTA Substrate Segment Dominates the Market Due to Superior Thermal and Mechanical Performance in High-Power Applications
The market is segmented based on type into:
- 0.25mm ZTA Substrate
- 0.32mm ZTA Substrate
By Application
DBC Substrate Segment Leads Due to Critical Role in Power Electronics and IGBT Modules
The market is segmented based on application into:
- DBC Substrate
- LED Package
- Others
By End-Use Industry
Automotive and Industrial Electronics Segment Leads Owing to Rising Demand for Efficient Power Modules and Electric Vehicles
The market is segmented based on end-use industry into:
- Automotive Electronics
- Industrial Electronics
- Consumer Electronics
- Renewable Energy Systems
- Aerospace and Defense
Regional Analysis: ZTA (Zirconia Toughened Alumina) Substrate Market
Asia-Pacific
The Asia-Pacific region is the undisputed leader in the global ZTA substrate market, accounting for over 65% of global consumption by volume as of 2024. This dominance is primarily fueled by the massive electronics manufacturing base, particularly in China, Japan, and South Korea. The region’s robust production of Insulated Gate Bipolar Transistor (IGBT) modules, a primary application for ZTA Direct Bonded Copper (DBC) substrates, is a key driver. Major local manufacturers, including Jiangsu Fulehua Semiconductor, Shengda Tech, and Nanjing Zhongjiang New Material, have established significant production capacities to serve both domestic demand and global supply chains. Furthermore, aggressive government investments in renewable energy infrastructure and electric vehicle production, especially in China, are creating sustained demand for high-performance power electronics that rely on ZTA’s superior thermal and mechanical properties. While cost competitiveness remains a focus, the region is also at the forefront of advancing manufacturing techniques to improve substrate precision and yield.
North America
The North American market is characterized by high-value, technologically advanced applications and is a significant hub for research and development. Demand is heavily driven by the aerospace, defense, and electric vehicle industries, which require substrates that offer exceptional reliability under extreme conditions. The presence of leading technology firms and stringent quality standards pushes the adoption of high-performance ZTA substrates from manufacturers like Rogers Corporation. Recent initiatives, such as the U.S. CHIPS and Science Act, which allocates funding for domestic semiconductor research and production, are expected to indirectly benefit the advanced ceramics supply chain, including ZTA substrates. The market is less volume-driven than Asia-Pacific but commands premium prices for specialized, high-reliability products used in critical applications.
Europe
Europe represents a mature and innovation-focused market for ZTA substrates. The region’s strong automotive sector, particularly in Germany, is a major consumer, utilizing these substrates in advanced power modules for electric and hybrid vehicles. Strict EU regulations on vehicle emissions are accelerating the transition to electrification, thereby supporting market growth. European manufacturers like Heraeus Electronics and CeramTec are recognized for their material science expertise and focus on developing next-generation ceramic solutions that meet rigorous automotive and industrial standards. Collaboration between automotive OEMs and substrate producers is common, driving innovation tailored to specific performance requirements. The market’s growth is steady, underpinned by a commitment to quality and technological advancement rather than mass production.
South America
The ZTA substrate market in South America is nascent and faces several developmental challenges. The region’s industrial and electronics manufacturing base is not as extensive as in other regions, which limits local demand. Most ZTA substrates are imported to serve niche applications in industrial equipment and limited automotive production, primarily in Brazil and Argentina. Economic volatility and currency fluctuations often hinder capital investment in advanced manufacturing technologies that would utilize these high-performance materials. While the long-term potential exists with gradual industrial modernization, the current market is characterized by low volume and is highly dependent on the economic stability and industrial policies of individual countries within the region.
Middle East & Africa
This region currently represents the smallest share of the global ZTA substrate market. Demand is sporadic and primarily linked to specific industrial projects, oil & gas infrastructure, and imported electronic equipment. There is negligible local production of either the substrates or the end-products that incorporate them, such as advanced power modules. Market development is slowed by a lack of a localized electronics manufacturing ecosystem and limited investment in the high-tech industries that drive demand for such specialized materials. Growth in the foreseeable future is expected to be minimal and will likely continue to rely on imports to fulfill any niche requirements that arise from large-scale infrastructure projects.
Report Scope
This market research report provides a comprehensive analysis of the global and regional ZTA (Zirconia Toughened Alumina) Substrate markets, covering the forecast period 2025–2032. It offers detailed insights into market dynamics, technological advancements, competitive landscape, and key trends shaping the industry.
Key focus areas of the report include:
- Market Size & Forecast: Historical data and future projections for revenue, unit shipments, and market value across major regions and segments.
- Segmentation Analysis: Detailed breakdown by product type, technology, application, and end-user industry to identify high-growth segments and investment opportunities.
- Regional Outlook: Insights into market performance across North America, Europe, Asia-Pacific, Latin America, and the Middle East & Africa, including country-level analysis where relevant.
- Competitive Landscape: Profiles of leading market participants, including their product offerings, R&D focus, manufacturing capacity, pricing strategies, and recent developments such as mergers, acquisitions, and partnerships.
- Technology Trends & Innovation: Assessment of emerging technologies, integration of AI/IoT, semiconductor design trends, fabrication techniques, and evolving industry standards.
- Market Drivers & Restraints: Evaluation of factors driving market growth along with challenges, supply chain constraints, regulatory issues, and market-entry barriers.
- Stakeholder Analysis: Insights for component suppliers, OEMs, system integrators, investors, and policymakers regarding the evolving ecosystem and strategic opportunities.
Primary and secondary research methods are employed, including interviews with industry experts, data from verified sources, and real-time market intelligence to ensure the accuracy and reliability of the insights presented.
FREQUENTLY ASKED QUESTIONS:
What is the current market size of Global ZTA (Zirconia Toughened Alumina) Substrate Market?
-> ZTA (Zirconia Toughened Alumina) Substrate Market was valued at 60.3 million in 2024 and is projected to reach US$ 91.2 million by 2032, at a CAGR of 6.2% during the forecast period.
Which key companies operate in Global ZTA (Zirconia Toughened Alumina) Substrate Market?
-> Key players include Rogers Corporation, KCC Corporation, Heraeus Electronics, Kyocera Corporation, and Maruwa Co., Ltd., among others. The top five manufacturers account for more than 80% of the market share.
What are the key growth drivers?
-> Key growth drivers include rising demand for IGBT modules in electric vehicles and renewable energy systems, superior thermal and mechanical properties of ZTA substrates, and expansion of 5G infrastructure requiring advanced LED packaging solutions.
Which region dominates the market?
-> Asia-Pacific is the dominant market, holding over 65% of the global market share in 2024, driven by strong manufacturing bases in China, Japan, and South Korea.
What are the emerging trends?
-> Emerging trends include development of ultra-thin ZTA substrates for miniaturized electronics, increased R&D in direct bond copper (DBC) technology, and growing adoption in aerospace and defense applications.

Get Sample Report PDF for Exclusive Insights
Report Sample Includes
- Table of Contents
- List of Tables & Figures
- Charts, Research Methodology, and more...
 Download Sample Report PDF