Webcams Market, Global Business Strategies 2026-2033

Webcams Market size was valued at USD 15,110 million in 2025. The market is projected to grow from USD 16,280 million in 2026 to USD 46,830 million by 2033, exhibiting a CAGR of 18.0% during the forecast period.

PDF Icon Download Sample Report PDF
  • Quick Dispatch

    All Orders

  • Secure Payment

    100% Secure Payment

Price range: $1,500.00 through $4,250.00

Clear

Market Insights

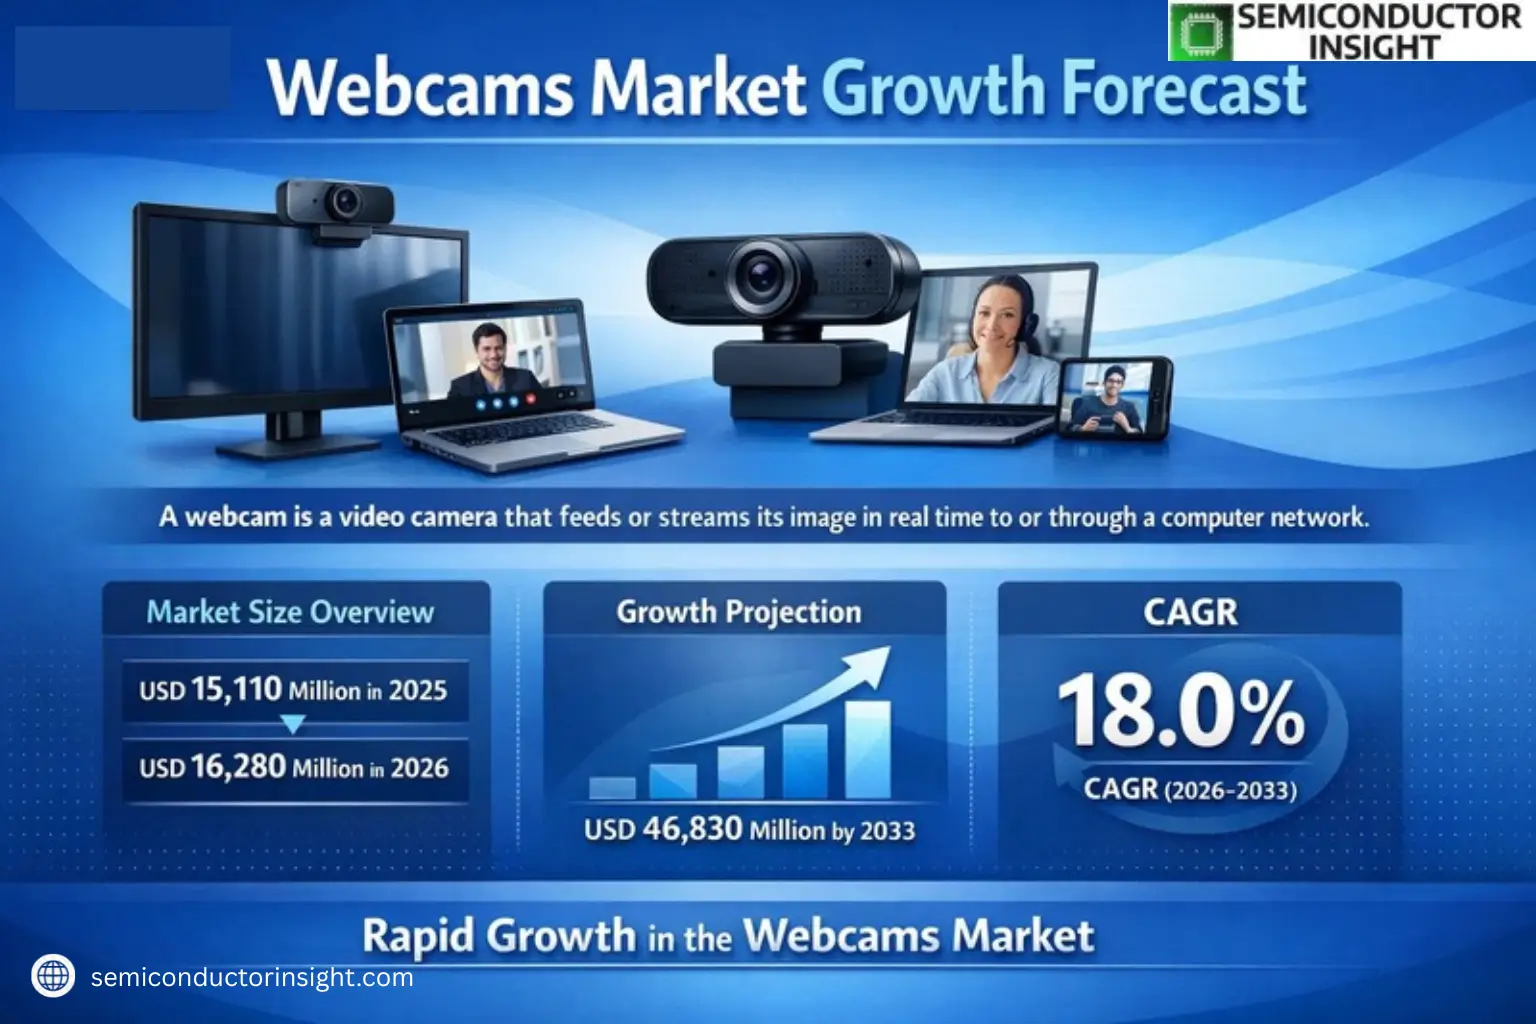
Global Webcams Market size was valued at USD 15,110 million in 2025. The market is projected to grow from USD 16,280 million in 2026 to USD 46,830 million by 2033, exhibiting a CAGR of 18.0% during the forecast period.

A webcam is a video camera that feeds or streams its image in real time to or through a computer network. These devices capture video streams that can be saved, viewed, or transmitted over the internet via email or other platforms. Unlike IP cameras, which connect via Ethernet or Wi-Fi, webcams typically use USB cables or are integrated into hardware like laptops.

The market growth is driven by increasing demand for remote communication tools, accelerated by hybrid work models and virtual collaboration trends. While USB port-based webcams dominate with a 70% market share, wireless variants are gaining traction due to convenience. China leads regional adoption with a 45% market share, followed by Japan and Europe at approximately 15% each. Key players like Logitech and Microsoft continue innovating with HD resolution and AI-enhanced features to meet evolving user needs across applications ranging from video conferencing to telehealth.

Xyz market size & forecast

MARKET DRIVERS

Rising Demand for Remote Communication

Webcams Market is experiencing significant growth due to the increasing reliance on remote work and virtual collaboration. With over 65% of businesses adopting hybrid work models, high-quality webcams have become essential for professional communication. Consumer preference for 1080p and 4K resolution cameras is driving manufacturers to enhance product offerings.

E-Learning Expansion

Educational institutions worldwide are incorporating digital learning platforms, creating sustained demand for webcams. Global e-learning market growth of approximately 15% annually directly benefits the webcam sector, with schools and universities investing in better video hardware

The gaming and content creation sectors also contribute to market growth, with streamers and professionals seeking advanced features like auto-focus and low-light correction.

MARKET CHALLENGES

Supply Chain Disruptions

Webcams Market faces component shortages, particularly for high-end image sensors. Semiconductor supply issues have led to production delays across major manufacturers, impacting inventory levels globally.

Other Challenges

Laptop Integration Threat
Built-in laptop cameras are improving in quality, reducing demand for external webcams among casual users. Over 70% of premium laptops now feature HD or better integrated cameras.

Price Sensitivity
While professionals invest in premium webcams, the consumer segment remains highly price-conscious, limiting ASP growth in the overall Webcams Market.

MARKET RESTRAINTS

Market Saturation in Developed Regions

North America and Europe show slowing growth rates as webcam penetration reaches near 80% among remote workers. Replacement cycles are extending beyond three years, with many users satisfied with existing equipment quality.

Regulatory Compliance

Stricter data privacy regulations are increasing production costs, as manufacturers must implement hardware-based privacy shutters and enhanced encryption in webcam firmware.

MARKET OPPORTUNITIES

AI-Enhanced Webcams

The integration of AI features like automatic framing, background noise cancellation, and gesture control represents a USD 1.2 billion opportunity in the Webcams Market. These premium features command higher margins and drive replacement purchases.

Emerging Markets Expansion

Developing nations in Asia Pacific and Latin America show strong growth potential, with webcam adoption rates increasing by 25% annually as internet infrastructure improves and remote work policies gain traction.


Webcams Market Trends

Robust Market Growth Projected Through 2033

Global Webcams Market is experiencing significant expansion, with valuations reaching USD 15,110 million in 2025. Industry projections indicate a compound annual growth rate (CAGR) of 18.0%, potentially elevating the market size to USD 46,830 million by 2033. This surge is driven by increasing demand for remote communication solutions across multiple sectors including corporate, education, and healthcare.

Other Trends

Dominance of USB-Powered Devices

USB-connected webcams maintain market leadership, representing approximately 70% of total shipments. Their plug-and-play functionality and cost-effectiveness make them the preferred choice for individual consumers and small businesses. Wireless alternatives are gaining traction in enterprise environments but face battery life and connectivity challenges.

Regional Market Distribution

China commands the largest market share at 45%, supported by local manufacturing ecosystems and high technology adoption rates. Japan and Europe collectively account for 15% each, with North America showing accelerated growth due to hybrid work policies. Emerging markets in Southeast Asia demonstrate the highest growth potential at 22% CAGR.

Application-Specific Demand Patterns

Common network chatting applications lead webcam usage (38%), followed by video conferencing at 32%. The remote medical sector shows the fastest adoption growth at 25% annually, fueled by telehealth expansion. Automotive applications are emerging for in-vehicle communication systems, though currently representing less than 5% of total demand.

Manufacturer Landscape

The top five manufacturers control approximately 10% of global market share, with Logitech, Microsoft, and HP leading the segment. Chinese manufacturers like KYE Systems (Genius) are gaining competitive advantage through cost-effective production. Recent industry developments include AI-powered auto-framing technology and 4K resolution adoption moving from premium to mid-range products.

COMPETITIVE LANDSCAPE

Key Industry Players

Logitech Dominates Webcams Market with 35% Revenue Share in 2025

Global Webcams Market is moderately consolidated, with the top five manufacturers controlling nearly 10% of total market share. Logitech maintains undisputed leadership with its extensive product portfolio spanning consumer and professional segments. Microsoft and HP leverage their strong PC peripheral ecosystems to secure top positions, while Asian manufacturers like KYE Systems (Genius) and Teng Wei Video Technology capture cost-sensitive markets through competitive pricing.

Niche players are gaining traction through specialized offerings – D-Link focuses on security applications, Philips emphasizes healthcare-grade webcams, and Motorola targets enterprise video conferencing solutions. Emerging brands like Ausdom and TeckNet are disrupting the budget segment with feature-rich models under USD 50, intensifying competition in the APAC region which accounts for 45% of global demand.

List of Key Webcams Companies Profiled

  • Logitech
  • Microsoft
  • HP
  • D-Link
  • Lenovo
  • Philips
  • Ausdom
  • KYE Systems Corp (Genius)
  • Motorola
  • NEXIA
  • Kinobo
  • Teng Wei Video Technology Co.
  • A4Tech
  • TeckNet

Segment Analysis:

Segment Category Sub-Segments Key Insights
By Type
  • USB Ports
  • Wireless
USB Ports

  • Dominates market share due to universal compatibility with devices
  • Preferred for stable connectivity without interference concerns
  • Lower production costs make them more affordable for mass-market adoption
By Application
  • Common Network Chatting
  • Video Conference
  • Remote Medical
  • Automobile
  • Others
Common Network Chatting

  • Largest application segment due to widespread personal communication usage
  • Growing demand from social media platforms with video calling features
  • Increased adoption during pandemic-driven remote interaction trends
By End User
  • Consumer
  • Enterprise
  • Healthcare
Consumer

  • Largest end-user segment due to personal computing needs
  • Growing demand from home office and education setups
  • Increased integration with smart home ecosystems
By Price Range
  • Budget
  • Mid-Range
  • Premium
Budget

  • Most popular category due to price sensitivity in mass market
  • Sufficient quality for basic video communication needs
  • Widely available through online retailers and electronics stores
By Technology
  • 720p HD
  • 1080p Full HD
  • 4K Ultra HD
1080p Full HD

  • Balances quality and affordability for most users
  • Becoming standard specification across mainstream devices
  • Offers sufficient resolution for professional use cases

Regional Analysis: Global Webcams Market

North America

North America dominates the global Webcams Market, driven by technological advancements and high adoption rates across professional and consumer segments. The region benefits from strong demand for high-resolution cameras in corporate environments, educational institutions, and content creation sectors. Prominent tech companies headquartered here continually innovate with AI-powered webcams featuring auto-framing and noise cancellation. Hybrid work models continue fueling demand, with businesses upgrading video conferencing equipment. The U.S. leads in market share due to its robust IT infrastructure, while Canada shows increasing demand for premium webcams in creative industries. The region’s mature e-commerce ecosystem facilitates seamless distribution of both consumer and professional-grade webcams.

Enterprise Adoption
Corporate sector accounts for nearly half of North America’s webcam demand, with businesses prioritizing HD cameras for virtual meetings. Integration with UC platforms like Zoom and Teams drives replacement cycles.
Consumer Trends
Content creators and gamers fuel premium webcam sales, with 4K resolution and background blur features gaining popularity. Home users show preference for plug-and-play models with built-in microphones.
Innovation Hub
Silicon Valley firms pioneer AI-enhanced webcams with facial recognition and automatic lighting adjustment. Major vendors focus on developing privacy-focused models with physical shutters.
Distribution Channels
Online retailers capture over 60% of sales, while B2B distributors serve corporate clients. Specialty electronics stores maintain relevance for high-end webcam purchases requiring product demonstrations.

Europe
Europe represents the second-largest Webcams Market, characterized by stringent data privacy regulations influencing product design. Germany and UK lead regional adoption, with growing demand in France’s gaming sector. Corporate purchases focus on GDPR-compliant models, while educational institutions upgrade legacy equipment. Northern European countries show preference for eco-friendly webcams with energy-saving modes. The region’s mature retail infrastructure supports both online and offline sales channels.

Asia-Pacific
APAC emerges as the fastest-growing Webcams Market, led by China’s manufacturing capabilities and India’s expanding IT sector. Japan and South Korea demand high-tech cameras with advanced features, while Southeast Asia shows price sensitivity. Education technology investments drive bulk purchases across developing markets. Local brands gain traction with affordable models tailored for emerging market needs like low-bandwidth optimization.

Latin America
Brazil dominates Latin America’s webcam market, followed by Mexico’s growing IT outsourcing industry. Economic constraints limit premium product adoption, favoring mid-range models. Distance learning initiatives post-pandemic continue driving education sector demand. E-commerce platforms facilitate access to international brands while local assemblers compete on price.

Middle East & Africa
The region shows uneven adoption, with UAE and Saudi Arabia leading in premium webcam purchases for corporate use. South Africa remains the most developed market in Sub-Saharan Africa. Government digitization programs spur demand in GCC countries, while infrastructure challenges limit growth in other African markets.

Report Scope

This market research report provides a comprehensive analysis of the Webcams Market , covering the forecast period 2026–2033. It offers detailed insights into market dynamics, technological advancements, competitive landscape, and key trends shaping the industry.

Key focus areas of the report include:

  • Market Overview: The report begins with an overview outlining its current market scenario, key growth indicators, and industry transformation drivers. It discusses macroeconomic factors, demand–supply balance, regulatory landscape, and the strategic role of semiconductors in powering advancements across industries such as automotive, telecommunications, consumer electronics, and industrial automation.
  • Market Size & Forecast: Historical data and future projections for revenue, unit shipments, and market value across major regions and segments.
  • Segmentation Analysis: Detailed breakdown by product type, technology, application, and end-user industry to identify high-growth segments and investment opportunities.
  • Regional Insights: Insights into market performance across North America, Europe, Asia-Pacific, Latin America, and the Middle East & Africa, including country-level analysis where relevant.
  • Competitive Landscape: Profiles of leading market participants, including their product offerings, R&D focus, manufacturing capacity, pricing strategies, and recent developments such as mergers, acquisitions, and partnerships.
  • Technology Trends & Innovation: Assessment of emerging technologies, integration of AI/IoT, semiconductor design trends, fabrication techniques, and evolving industry standards.
  • Market Drivers & Restraints: Evaluation of factors driving market growth along with challenges, supply chain constraints, regulatory issues, and market-entry barriers.
  • Stakeholder Insights: Insights for component suppliers, OEMs, system integrators, investors, and policymakers regarding the evolving ecosystem and strategic opportunities.

Primary and secondary research methods are employed, including interviews with industry experts, data from verified sources, and real-time market intelligence to ensure the accuracy and reliability of the insights presented.

FREQUENTLY ASKED QUESTIONS:

What is the current market size of Webcams Market?

-> Webcams Market size was valued at USD 15,110 million in 2025. The market is projected to grow from USD 16,280 million in 2026 to USD 46,830 million by 2033, exhibiting a CAGR of 18.0% during the forecast period.

Which key companies operate in Webcams Market?

-> Key players include Logitech, Microsoft, Hp, D-Link, Lenovo, Philips, Ausdom, KYE Systems Corp(Genius), Motorola, NEXIA, among others.

What are the key growth drivers?

-> Key growth drivers include rising demand for video conferencing, remote work trends, and increasing adoption of USB port webcams.

Which region dominates the market?

-> China is the largest market with 45% share, followed by Europe and Japan with about 15% each.

What are the emerging trends?

-> Emerging trends include advancements in wireless webcams, integration with AI features, and increased demand for high-resolution streaming.

Webcams Market, Global Business Strategies 2026-2033

Get Sample Report PDF for Exclusive Insights

Report Sample Includes

  • Table of Contents
  • List of Tables & Figures
  • Charts, Research Methodology, and more...
PDF Icon Download Sample Report PDF

Download Sample Report

Table of Content

1 Introduction to Research & Analysis Reports
1.1 Webcams Market Definition
1.2 Market Segments
1.2.1 Segment by Type
1.2.2 Segment by Application
1.3 Global Webcams Market Overview
1.4 Features & Benefits of This Report
1.5 Methodology & Sources of Information
1.5.1 Research Methodology
1.5.2 Research Process
1.5.3 Base Year
1.5.4 Report Assumptions & Caveats
2 Global Webcams Overall Market Size
2.1 Global Webcams Market Size: 2024 VS 2032
2.2 Global Webcams Market Size, Prospects & Forecasts: 2020-2032
2.3 Global Webcams Sales: 2020-2032
3 Company Landscape
3.1 Top Webcams Players in Global Market
3.2 Top Global Webcams Companies Ranked by Revenue
3.3 Global Webcams Revenue by Companies
3.4 Global Webcams Sales by Companies
3.5 Global Webcams Price by Manufacturer (2020-2025)
3.6 Top 3 and Top 5 Webcams Companies in Global Market, by Revenue in 2024
3.7 Global Manufacturers Webcams Product Type
3.8 Tier 1, Tier 2, and Tier 3 Webcams Players in Global Market
3.8.1 List of Global Tier 1 Webcams Companies
3.8.2 List of Global Tier 2 and Tier 3 Webcams Companies
4 Sights by Product
4.1 Overview
4.1.1 Segment by Type – Global Webcams Market Size Markets, 2024 & 2032
4.1.2 USB Ports
4.1.3 Wireless
4.2 Segment by Type – Global Webcams Revenue & Forecasts
4.2.1 Segment by Type – Global Webcams Revenue, 2020-2025
4.2.2 Segment by Type – Global Webcams Revenue, 2026-2032
4.2.3 Segment by Type – Global Webcams Revenue Market Share, 2020-2032
4.3 Segment by Type – Global Webcams Sales & Forecasts
4.3.1 Segment by Type – Global Webcams Sales, 2020-2025
4.3.2 Segment by Type – Global Webcams Sales, 2026-2032
4.3.3 Segment by Type – Global Webcams Sales Market Share, 2020-2032
4.4 Segment by Type – Global Webcams Price (Manufacturers Selling Prices), 2020-2032
5 Sights by Application
5.1 Overview
5.1.1 Segment by Application – Global Webcams Market Size, 2024 & 2032
5.1.2 Common Network Chatting
5.1.3 Video Conference
5.1.4 Remote Medical
5.1.5 Automobile
5.1.6 Others
5.2 Segment by Application – Global Webcams Revenue & Forecasts
5.2.1 Segment by Application – Global Webcams Revenue, 2020-2025
5.2.2 Segment by Application – Global Webcams Revenue, 2026-2032
5.2.3 Segment by Application – Global Webcams Revenue Market Share, 2020-2032
5.3 Segment by Application – Global Webcams Sales & Forecasts
5.3.1 Segment by Application – Global Webcams Sales, 2020-2025
5.3.2 Segment by Application – Global Webcams Sales, 2026-2032
5.3.3 Segment by Application – Global Webcams Sales Market Share, 2020-2032
5.4 Segment by Application – Global Webcams Price (Manufacturers Selling Prices), 2020-2032
6 Sights by Region
6.1 By Region – Global Webcams Market Size, 2024 & 2032
6.2 By Region – Global Webcams Revenue & Forecasts
6.2.1 By Region – Global Webcams Revenue, 2020-2025
6.2.2 By Region – Global Webcams Revenue, 2026-2032
6.2.3 By Region – Global Webcams Revenue Market Share, 2020-2032
6.3 By Region – Global Webcams Sales & Forecasts
6.3.1 By Region – Global Webcams Sales, 2020-2025
6.3.2 By Region – Global Webcams Sales, 2026-2032
6.3.3 By Region – Global Webcams Sales Market Share, 2020-2032
6.4 North America
6.4.1 By Country – North America Webcams Revenue, 2020-2032
6.4.2 By Country – North America Webcams Sales, 2020-2032
6.4.3 United States Webcams Market Size, 2020-2032
6.4.4 Canada Webcams Market Size, 2020-2032
6.4.5 Mexico Webcams Market Size, 2020-2032
6.5 Europe
6.5.1 By Country – Europe Webcams Revenue, 2020-2032
6.5.2 By Country – Europe Webcams Sales, 2020-2032
6.5.3 Germany Webcams Market Size, 2020-2032
6.5.4 France Webcams Market Size, 2020-2032
6.5.5 U.K. Webcams Market Size, 2020-2032
6.5.6 Italy Webcams Market Size, 2020-2032
6.5.7 Russia Webcams Market Size, 2020-2032
6.5.8 Nordic Countries Webcams Market Size, 2020-2032
6.5.9 Benelux Webcams Market Size, 2020-2032
6.6 Asia
6.6.1 By Region – Asia Webcams Revenue, 2020-2032
6.6.2 By Region – Asia Webcams Sales, 2020-2032
6.6.3 China Webcams Market Size, 2020-2032
6.6.4 Japan Webcams Market Size, 2020-2032
6.6.5 South Korea Webcams Market Size, 2020-2032
6.6.6 Southeast Asia Webcams Market Size, 2020-2032
6.6.7 India Webcams Market Size, 2020-2032
6.7 South America
6.7.1 By Country – South America Webcams Revenue, 2020-2032
6.7.2 By Country – South America Webcams Sales, 2020-2032
6.7.3 Brazil Webcams Market Size, 2020-2032
6.7.4 Argentina Webcams Market Size, 2020-2032
6.8 Middle East & Africa
6.8.1 By Country – Middle East & Africa Webcams Revenue, 2020-2032
6.8.2 By Country – Middle East & Africa Webcams Sales, 2020-2032
6.8.3 Turkey Webcams Market Size, 2020-2032
6.8.4 Israel Webcams Market Size, 2020-2032
6.8.5 Saudi Arabia Webcams Market Size, 2020-2032
6.8.6 UAE Webcams Market Size, 2020-2032
7 Manufacturers & Brands Profiles
7.1 Logitech
7.1.1 Logitech Company Summary
7.1.2 Logitech Business Overview
7.1.3 Logitech Webcams Major Product Offerings
7.1.4 Logitech Webcams Sales and Revenue in Global (2020-2025)
7.1.5 Logitech Key News & Latest Developments
7.2 Microsoft
7.2.1 Microsoft Company Summary
7.2.2 Microsoft Business Overview
7.2.3 Microsoft Webcams Major Product Offerings
7.2.4 Microsoft Webcams Sales and Revenue in Global (2020-2025)
7.2.5 Microsoft Key News & Latest Developments
7.3 Hp
7.3.1 Hp Company Summary
7.3.2 Hp Business Overview
7.3.3 Hp Webcams Major Product Offerings
7.3.4 Hp Webcams Sales and Revenue in Global (2020-2025)
7.3.5 Hp Key News & Latest Developments
7.4 D-Link
7.4.1 D-Link Company Summary
7.4.2 D-Link Business Overview
7.4.3 D-Link Webcams Major Product Offerings
7.4.4 D-Link Webcams Sales and Revenue in Global (2020-2025)
7.4.5 D-Link Key News & Latest Developments
7.5 Lenovo
7.5.1 Lenovo Company Summary
7.5.2 Lenovo Business Overview
7.5.3 Lenovo Webcams Major Product Offerings
7.5.4 Lenovo Webcams Sales and Revenue in Global (2020-2025)
7.5.5 Lenovo Key News & Latest Developments
7.6 Philips
7.6.1 Philips Company Summary
7.6.2 Philips Business Overview
7.6.3 Philips Webcams Major Product Offerings
7.6.4 Philips Webcams Sales and Revenue in Global (2020-2025)
7.6.5 Philips Key News & Latest Developments
7.7 Ausdom
7.7.1 Ausdom Company Summary
7.7.2 Ausdom Business Overview
7.7.3 Ausdom Webcams Major Product Offerings
7.7.4 Ausdom Webcams Sales and Revenue in Global (2020-2025)
7.7.5 Ausdom Key News & Latest Developments
7.8 KYE Systems Corp(Genius)
7.8.1 KYE Systems Corp(Genius) Company Summary
7.8.2 KYE Systems Corp(Genius) Business Overview
7.8.3 KYE Systems Corp(Genius) Webcams Major Product Offerings
7.8.4 KYE Systems Corp(Genius) Webcams Sales and Revenue in Global (2020-2025)
7.8.5 KYE Systems Corp(Genius) Key News & Latest Developments
7.9 Motorola
7.9.1 Motorola Company Summary
7.9.2 Motorola Business Overview
7.9.3 Motorola Webcams Major Product Offerings
7.9.4 Motorola Webcams Sales and Revenue in Global (2020-2025)
7.9.5 Motorola Key News & Latest Developments
7.10 NEXIA
7.10.1 NEXIA Company Summary
7.10.2 NEXIA Business Overview
7.10.3 NEXIA Webcams Major Product Offerings
7.10.4 NEXIA Webcams Sales and Revenue in Global (2020-2025)
7.10.5 NEXIA Key News & Latest Developments
7.11 Kinobo
7.11.1 Kinobo Company Summary
7.11.2 Kinobo Business Overview
7.11.3 Kinobo Webcams Major Product Offerings
7.11.4 Kinobo Webcams Sales and Revenue in Global (2020-2025)
7.11.5 Kinobo Key News & Latest Developments
7.12 Teng Wei Video Technology Co.
7.12.1 Teng Wei Video Technology Co. Company Summary
7.12.2 Teng Wei Video Technology Co. Business Overview
7.12.3 Teng Wei Video Technology Co. Webcams Major Product Offerings
7.12.4 Teng Wei Video Technology Co. Webcams Sales and Revenue in Global (2020-2025)
7.12.5 Teng Wei Video Technology Co. Key News & Latest Developments
7.13 A4Tech
7.13.1 A4Tech Company Summary
7.13.2 A4Tech Business Overview
7.13.3 A4Tech Webcams Major Product Offerings
7.13.4 A4Tech Webcams Sales and Revenue in Global (2020-2025)
7.13.5 A4Tech Key News & Latest Developments
7.14 TeckNet
7.14.1 TeckNet Company Summary
7.14.2 TeckNet Business Overview
7.14.3 TeckNet Webcams Major Product Offerings
7.14.4 TeckNet Webcams Sales and Revenue in Global (2020-2025)
7.14.5 TeckNet Key News & Latest Developments
8 Global Webcams Production Capacity, Analysis
8.1 Global Webcams Production Capacity, 2020-2032
8.2 Webcams Production Capacity of Key Manufacturers in Global Market
8.3 Global Webcams Production by Region
9 Key Market Trends, Opportunity, Drivers and Restraints
9.1 Market Opportunities & Trends
9.2 Market Drivers
9.3 Market Restraints
10 Webcams Supply Chain Analysis
10.1 Webcams Industry Value Chain
10.2 Webcams Upstream Market
10.3 Webcams Downstream and Clients
10.4 Marketing Channels Analysis
10.4.1 Marketing Channels
10.4.2 Webcams Distributors and Sales Agents in Global
11 Conclusion
12 Appendix
12.1 Note
12.2 Examples of Clients
12.3 DisclaimerList of Tables
Table 1. Key Players of Webcams in Global Market
Table 2. Top Webcams Players in Global Market, Ranking by Revenue (2024)
Table 3. Global Webcams Revenue by Companies, (US$, Mn), 2020-2025
Table 4. Global Webcams Revenue Share by Companies, 2020-2025
Table 5. Global Webcams Sales by Companies, (K Units), 2020-2025
Table 6. Global Webcams Sales Share by Companies, 2020-2025
Table 7. Key Manufacturers Webcams Price (2020-2025) & (USD/Unit)
Table 8. Global Manufacturers Webcams Product Type
Table 9. List of Global Tier 1 Webcams Companies, Revenue (US$, Mn) in 2024 and Market Share
Table 10. List of Global Tier 2 and Tier 3 Webcams Companies, Revenue (US$, Mn) in 2024 and Market Share
Table 11. Segment by Type – Global Webcams Revenue, (US$, Mn), 2024 & 2032
Table 12. Segment by Type – Global Webcams Revenue (US$, Mn), 2020-2025
Table 13. Segment by Type – Global Webcams Revenue (US$, Mn), 2026-2032
Table 14. Segment by Type – Global Webcams Sales (K Units), 2020-2025
Table 15. Segment by Type – Global Webcams Sales (K Units), 2026-2032
Table 16. Segment by Application – Global Webcams Revenue, (US$, Mn), 2024 & 2032
Table 17. Segment by Application – Global Webcams Revenue, (US$, Mn), 2020-2025
Table 18. Segment by Application – Global Webcams Revenue, (US$, Mn), 2026-2032
Table 19. Segment by Application – Global Webcams Sales, (K Units), 2020-2025
Table 20. Segment by Application – Global Webcams Sales, (K Units), 2026-2032
Table 21. By Region – Global Webcams Revenue, (US$, Mn), 2025-2032
Table 22. By Region – Global Webcams Revenue, (US$, Mn), 2020-2025
Table 23. By Region – Global Webcams Revenue, (US$, Mn), 2026-2032
Table 24. By Region – Global Webcams Sales, (K Units), 2020-2025
Table 25. By Region – Global Webcams Sales, (K Units), 2026-2032
Table 26. By Country – North America Webcams Revenue, (US$, Mn), 2020-2025
Table 27. By Country – North America Webcams Revenue, (US$, Mn), 2026-2032
Table 28. By Country – North America Webcams Sales, (K Units), 2020-2025
Table 29. By Country – North America Webcams Sales, (K Units), 2026-2032
Table 30. By Country – Europe Webcams Revenue, (US$, Mn), 2020-2025
Table 31. By Country – Europe Webcams Revenue, (US$, Mn), 2026-2032
Table 32. By Country – Europe Webcams Sales, (K Units), 2020-2025
Table 33. By Country – Europe Webcams Sales, (K Units), 2026-2032
Table 34. By Region – Asia Webcams Revenue, (US$, Mn), 2020-2025
Table 35. By Region – Asia Webcams Revenue, (US$, Mn), 2026-2032
Table 36. By Region – Asia Webcams Sales, (K Units), 2020-2025
Table 37. By Region – Asia Webcams Sales, (K Units), 2026-2032
Table 38. By Country – South America Webcams Revenue, (US$, Mn), 2020-2025
Table 39. By Country – South America Webcams Revenue, (US$, Mn), 2026-2032
Table 40. By Country – South America Webcams Sales, (K Units), 2020-2025
Table 41. By Country – South America Webcams Sales, (K Units), 2026-2032
Table 42. By Country – Middle East & Africa Webcams Revenue, (US$, Mn), 2020-2025
Table 43. By Country – Middle East & Africa Webcams Revenue, (US$, Mn), 2026-2032
Table 44. By Country – Middle East & Africa Webcams Sales, (K Units), 2020-2025
Table 45. By Country – Middle East & Africa Webcams Sales, (K Units), 2026-2032
Table 46. Logitech Company Summary
Table 47. Logitech Webcams Product Offerings
Table 48. Logitech Webcams Sales (K Units), Revenue (US$, Mn) and Average Price (USD/Unit) & (2020-2025)
Table 49. Logitech Key News & Latest Developments
Table 50. Microsoft Company Summary
Table 51. Microsoft Webcams Product Offerings
Table 52. Microsoft Webcams Sales (K Units), Revenue (US$, Mn) and Average Price (USD/Unit) & (2020-2025)
Table 53. Microsoft Key News & Latest Developments
Table 54. Hp Company Summary
Table 55. Hp Webcams Product Offerings
Table 56. Hp Webcams Sales (K Units), Revenue (US$, Mn) and Average Price (USD/Unit) & (2020-2025)
Table 57. Hp Key News & Latest Developments
Table 58. D-Link Company Summary
Table 59. D-Link Webcams Product Offerings
Table 60. D-Link Webcams Sales (K Units), Revenue (US$, Mn) and Average Price (USD/Unit) & (2020-2025)
Table 61. D-Link Key News & Latest Developments
Table 62. Lenovo Company Summary
Table 63. Lenovo Webcams Product Offerings
Table 64. Lenovo Webcams Sales (K Units), Revenue (US$, Mn) and Average Price (USD/Unit) & (2020-2025)
Table 65. Lenovo Key News & Latest Developments
Table 66. Philips Company Summary
Table 67. Philips Webcams Product Offerings
Table 68. Philips Webcams Sales (K Units), Revenue (US$, Mn) and Average Price (USD/Unit) & (2020-2025)
Table 69. Philips Key News & Latest Developments
Table 70. Ausdom Company Summary
Table 71. Ausdom Webcams Product Offerings
Table 72. Ausdom Webcams Sales (K Units), Revenue (US$, Mn) and Average Price (USD/Unit) & (2020-2025)
Table 73. Ausdom Key News & Latest Developments
Table 74. KYE Systems Corp(Genius) Company Summary
Table 75. KYE Systems Corp(Genius) Webcams Product Offerings
Table 76. KYE Systems Corp(Genius) Webcams Sales (K Units), Revenue (US$, Mn) and Average Price (USD/Unit) & (2020-2025)
Table 77. KYE Systems Corp(Genius) Key News & Latest Developments
Table 78. Motorola Company Summary
Table 79. Motorola Webcams Product Offerings
Table 80. Motorola Webcams Sales (K Units), Revenue (US$, Mn) and Average Price (USD/Unit) & (2020-2025)
Table 81. Motorola Key News & Latest Developments
Table 82. NEXIA Company Summary
Table 83. NEXIA Webcams Product Offerings
Table 84. NEXIA Webcams Sales (K Units), Revenue (US$, Mn) and Average Price (USD/Unit) & (2020-2025)
Table 85. NEXIA Key News & Latest Developments
Table 86. Kinobo Company Summary
Table 87. Kinobo Webcams Product Offerings
Table 88. Kinobo Webcams Sales (K Units), Revenue (US$, Mn) and Average Price (USD/Unit) & (2020-2025)
Table 89. Kinobo Key News & Latest Developments
Table 90. Teng Wei Video Technology Co. Company Summary
Table 91. Teng Wei Video Technology Co. Webcams Product Offerings
Table 92. Teng Wei Video Technology Co. Webcams Sales (K Units), Revenue (US$, Mn) and Average Price (USD/Unit) & (2020-2025)
Table 93. Teng Wei Video Technology Co. Key News & Latest Developments
Table 94. A4Tech Company Summary
Table 95. A4Tech Webcams Product Offerings
Table 96. A4Tech Webcams Sales (K Units), Revenue (US$, Mn) and Average Price (USD/Unit) & (2020-2025)
Table 97. A4Tech Key News & Latest Developments
Table 98. TeckNet Company Summary
Table 99. TeckNet Webcams Product Offerings
Table 100. TeckNet Webcams Sales (K Units), Revenue (US$, Mn) and Average Price (USD/Unit) & (2020-2025)
Table 101. TeckNet Key News & Latest Developments
Table 102. Webcams Capacity of Key Manufacturers in Global Market, 2023-2025 (K Units)
Table 103. Global Webcams Capacity Market Share of Key Manufacturers, 2023-2025
Table 104. Global Webcams Production by Region, 2020-2025 (K Units)
Table 105. Global Webcams Production by Region, 2026-2032 (K Units)
Table 106. Webcams Market Opportunities & Trends in Global Market
Table 107. Webcams Market Drivers in Global Market
Table 108. Webcams Market Restraints in Global Market
Table 109. Webcams Raw Materials
Table 110. Webcams Raw Materials Suppliers in Global Market
Table 111. Typical Webcams Downstream
Table 112. Webcams Downstream Clients in Global Market
Table 113. Webcams Distributors and Sales Agents in Global Market

List of Figures
Figure 1. Webcams Product Picture
Figure 2. Webcams Segment by Type in 2024
Figure 3. Webcams Segment by Application in 2024
Figure 4. Global Webcams Market Overview: 2024
Figure 5. Key Caveats
Figure 6. Global Webcams Market Size: 2024 VS 2032 (US$, Mn)
Figure 7. Global Webcams Revenue: 2020-2032 (US$, Mn)
Figure 8. Webcams Sales in Global Market: 2020-2032 (K Units)
Figure 9. The Top 3 and 5 Players Market Share by Webcams Revenue in 2024
Figure 10. Segment by Type – Global Webcams Revenue, (US$, Mn), 2024 & 2032
Figure 11. Segment by Type – Global Webcams Revenue Market Share, 2020-2032
Figure 12. Segment by Type – Global Webcams Sales Market Share, 2020-2032
Figure 13. Segment by Type – Global Webcams Price (USD/Unit), 2020-2032
Figure 14. Segment by Application – Global Webcams Revenue, (US$, Mn), 2024 & 2032
Figure 15. Segment by Application – Global Webcams Revenue Market Share, 2020-2032
Figure 16. Segment by Application – Global Webcams Sales Market Share, 2020-2032
Figure 17. Segment by Application -Global Webcams Price (USD/Unit), 2020-2032
Figure 18. By Region – Global Webcams Revenue, (US$, Mn), 2025 & 2032
Figure 19. By Region – Global Webcams Revenue Market Share, 2020 VS 2024 VS 2032
Figure 20. By Region – Global Webcams Revenue Market Share, 2020-2032
Figure 21. By Region – Global Webcams Sales Market Share, 2020-2032
Figure 22. By Country – North America Webcams Revenue Market Share, 2020-2032
Figure 23. By Country – North America Webcams Sales Market Share, 2020-2032
Figure 24. United States Webcams Revenue, (US$, Mn), 2020-2032
Figure 25. Canada Webcams Revenue, (US$, Mn), 2020-2032
Figure 26. Mexico Webcams Revenue, (US$, Mn), 2020-2032
Figure 27. By Country – Europe Webcams Revenue Market Share, 2020-2032
Figure 28. By Country – Europe Webcams Sales Market Share, 2020-2032
Figure 29. Germany Webcams Revenue, (US$, Mn), 2020-2032
Figure 30. France Webcams Revenue, (US$, Mn), 2020-2032
Figure 31. U.K. Webcams Revenue, (US$, Mn), 2020-2032
Figure 32. Italy Webcams Revenue, (US$, Mn), 2020-2032
Figure 33. Russia Webcams Revenue, (US$, Mn), 2020-2032
Figure 34. Nordic Countries Webcams Revenue, (US$, Mn), 2020-2032
Figure 35. Benelux Webcams Revenue, (US$, Mn), 2020-2032
Figure 36. By Region – Asia Webcams Revenue Market Share, 2020-2032
Figure 37. By Region – Asia Webcams Sales Market Share, 2020-2032
Figure 38. China Webcams Revenue, (US$, Mn), 2020-2032
Figure 39. Japan Webcams Revenue, (US$, Mn), 2020-2032
Figure 40. South Korea Webcams Revenue, (US$, Mn), 2020-2032
Figure 41. Southeast Asia Webcams Revenue, (US$, Mn), 2020-2032
Figure 42. India Webcams Revenue, (US$, Mn), 2020-2032
Figure 43. By Country – South America Webcams Revenue Market Share, 2020-2032
Figure 44. By Country – South America Webcams Sales, Market Share, 2020-2032
Figure 45. Brazil Webcams Revenue, (US$, Mn), 2020-2032
Figure 46. Argentina Webcams Revenue, (US$, Mn), 2020-2032
Figure 47. By Country – Middle East & Africa Webcams Revenue, Market Share, 2020-2032
Figure 48. By Country – Middle East & Africa Webcams Sales, Market Share, 2020-2032
Figure 49. Turkey Webcams Revenue, (US$, Mn), 2020-2032
Figure 50. Israel Webcams Revenue, (US$, Mn), 2020-2032
Figure 51. Saudi Arabia Webcams Revenue, (US$, Mn), 2020-2032
Figure 52. UAE Webcams Revenue, (US$, Mn), 2020-2032
Figure 53. Global Webcams Production Capacity (K Units), 2020-2032
Figure 54. The Percentage of Production Webcams by Region, 2024 VS 2032
Figure 55. Webcams Industry Value Chain
Figure 56. Marketing Channels